. 2018 May 15;48(5):1029-1045.e5.
doi: 10.1016/j.immuni.2018.04.026.

Epigenomic-Guided Mass Cytometry Profiling Reveals Disease-Specific Features of Exhausted CD8 T Cells

Affiliations

Epigenomic-Guided Mass Cytometry Profiling Reveals Disease-Specific Features of Exhausted CD8 T Cells

Bertram Bengsch et al. Immunity. .

Abstract

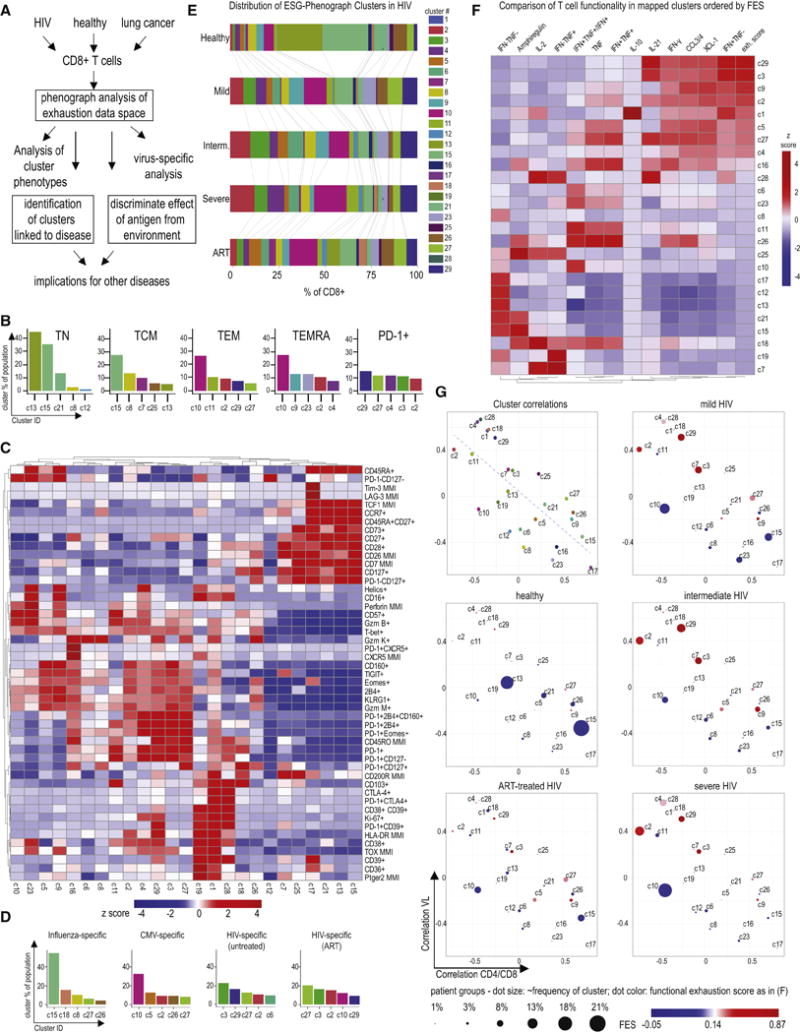
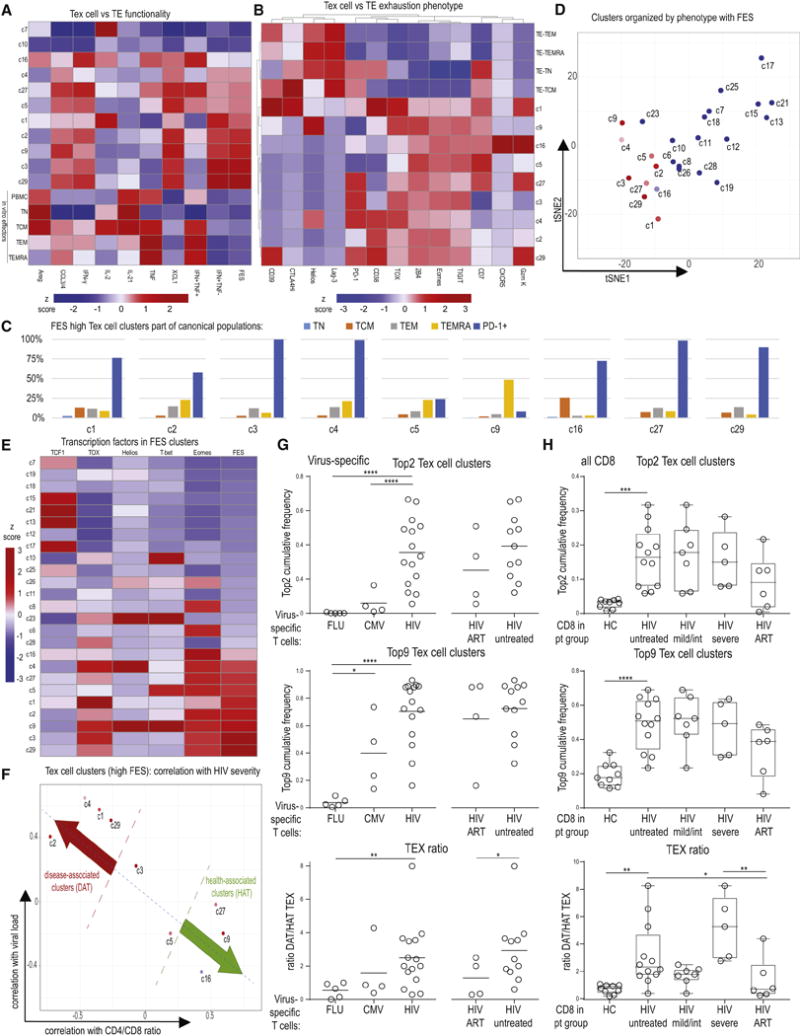
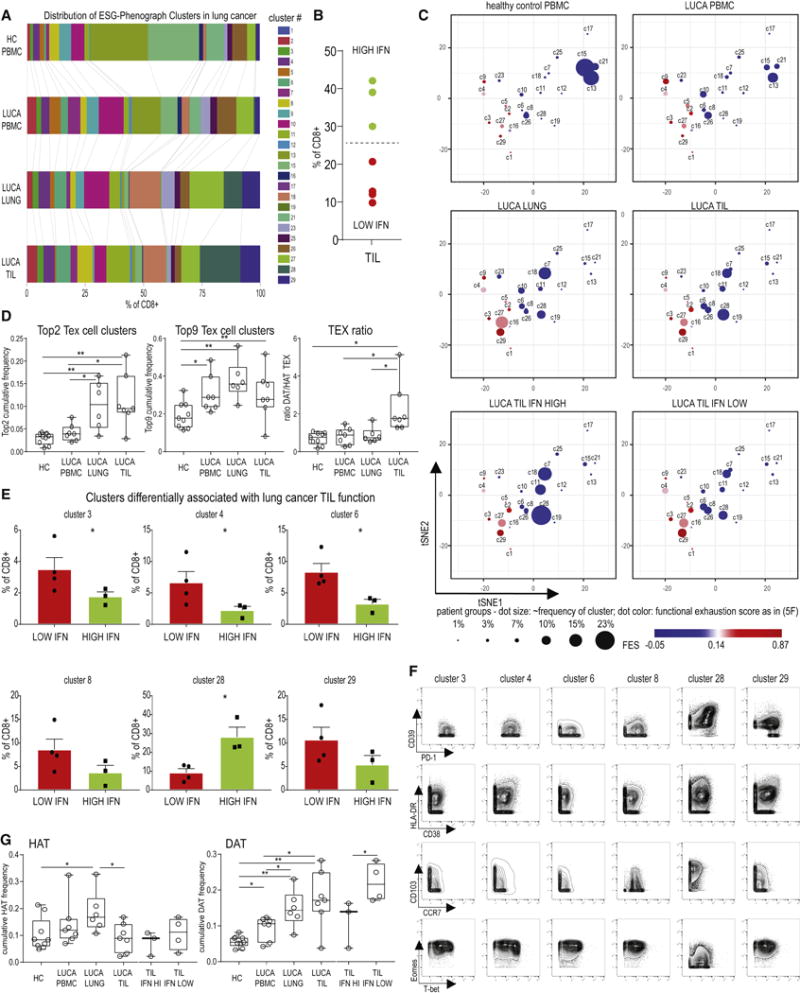
Exhausted CD8 T (Tex) cells are immunotherapy targets in chronic infection and cancer, but a comprehensive assessment of Tex cell diversity in human disease is lacking. Here, we developed a transcriptomic- and epigenetic-guided mass cytometry approach to define core exhaustion-specific genes and disease-induced changes in Tex cells in HIV and human cancer. Single-cell proteomic profiling identified 9 distinct Tex cell clusters using phenotypic, functional, transcription factor, and inhibitory receptor co-expression patterns. An exhaustion severity metric was developed and integrated with high-dimensional phenotypes to define Tex cell clusters that were present in healthy subjects, common across chronic infection and cancer or enriched in either disease, linked to disease severity, and changed with HIV therapy. Combinatorial patterns of immunotherapy targets on different Tex cell clusters were also defined. This approach and associated datasets present a resource for investigating human Tex cell biology, with implications for immune monitoring and immunomodulation in chronic infections, autoimmunity, and cancer.

Keywords: CD8 T cell; CyTOF; HIV; T cell exhaustion; cancer immunology; chronic infection; immune checkpoint; lung cancer; mass cytometry; systems immunology.


Conflict of interest statement

Declaration of Interest:

E.J.W. has a patent licensing agreement on the PD-1 pathway. S.M.A. is the recipient of a sponsored research agreement from Janssen Pharmaceuticals. A provisional patent application has been filed based on work presented in this manuscript.

Figures

Figure 1
Figure 1. Mouse-derived transcriptomic exhaustion signature translates to human exhaustion
(A) Genes transcriptionally increased or decreased in virus-specific CD8 T cells from d15 and d30 of LCMV clone 13 infection (Tex cells) were compared to TN, TEFF, TMEM from LCMV Arm infection (GSE41867) and exhaustion-specific genes defined based on moderated Bayesian statistics. (B) Heatmap of transcriptomic data (see also Supplementary Table 2). (C) Exhaustion genesets validated for enrichment in Tex cells versus TN, TEFF, or TMEM in LCMV infection via GSEA. (D) Enrichment of gene signature was analyzed in transcriptomic data from Tex cell subpopulations (PD-1Hi versus PD-1Int, Tim-3+ versus CXCR5+) from LCMV clone 13 infection (GSE41869; GSE84105) or (E) human HIV-specific CD8 T cells from HIV elite controller versus progressor patients (GSE24081) or PBMC versus TIL from melanoma patients (GSE 24536). FDR and normalized enrichment score (NES) are indicated. Dashed lines in D and E indicate leading edge genes driving the NES. (F) The exhaustion gene signature was analyzed in multiple mouse and human datasets of Tex cell populations (detailed in Supplementary Table 1) and NES plotted for each comparison. *** FDR<0.001, ** <0.01, * <0.05. (G and H) Heatmap for leading edge genes driving enrichment for genes with increased expression in exhaustion in melanoma (PBMC versus TIL) (GSE 24536), and HCV (CD39+ versus CD39− cells) (GSE 72752).
Figure 2
Figure 2. Uniquely regulated genes in exhaustion identified by epigenetic accessibility
Genes specifically regulated in Tex cells from Figure 1, were analyzed for epigenetic changes in ATAC-seq datasets from LCMV infection (GSE86797, GSE87646). Genes are detailed in Supplementary Table 2. (A) The fraction of transcriptionally identified genes with associated epigenetic changes (increased accessibility of open chromatin regions (OCR) near exhaustion genes for UP-, decreased accessibility of OCRs in the vicinity of DOWN-exhaustion genes) is shown. (B) Exemplary ATAC-seq tracks indicating increased OCR (highlighted by grey bars) near exhaustion genes from GSE86797. (C) Exhaustion genes were analyzed for associated OCR changes and the role in driving the enrichment (“leading edge”) in the comparisons of Tex cells versus other T cell datasets, as detailed in Supplementary Tables 1 and 3. Genes with an associated OCR change displayed higher leading edge involvement. *** p<0.001. The leading edge contribution of exhaustion signature genes with an associated OCR change is shown as a binary heatmap for genes up- (D) and down-regulated in exhaustion (E) (rows indicate genes, columns individual GSEA comparisons, red denoting leading edge contribution (for details, see Supplementary Table 3). (F) GO Term analysis of the exhaustion-specific genesets with associated OCR changes. The 20 GO terms with the lowest p values are shown.
Figure 3
Figure 3. Mass cytometry analysis of exhaustion molecule expression
(A) Exhaustion genesets defined in Figure 1 and 2 were used to design an exhaustion-focused mass cytometry panel. The leading edge contribution of genes chosen for CyTOF is shown; rows indicate genes, columns individual GSEA comparisons. See also Supplementary Table 4. Cytokines and chemokines were analyzed using a dedicated panel (see Supplementary Table 6) (B) Genes selected for CyTOF had significantly higher leading edge contribution in the GSEA analyses of Tex cells compared to the remaining exhaustion genes (*** p <0.001) and showed similar ability to discriminate Tex cells in single-cell transcriptomic data (see Supplementary Figure 1). (C) Exhaustion markers were analyzed on canonical CD8 T cell populations (TN, TCM, TEM, TEMRA) and total PD-1+ CD8 T cells in HC and patients with HIV and lung cancer. Heatmap depicts exhaustion marker expression by median metal intensity (MMI) on concatenated CD8 T cell data from PBMC (n=35; see Supplementary Table 7). (D) Linear regression analysis versus CD4/CD8 ratio was performed for marker expression in patients with HIV infection and HC using percent positive or MMI as indicated. Each dot represents an individual patient CD8 T cells. (n=75 samples from 48 HIV patients and HC were analyzed, higher sample number indicates longitudinal samples when available, for details see Supplementary Table 7). Green - positive correlation; red - negative correlation. Similar results were obtained in a repeat analysis on a different mass cytometer (Supplementary Figure 2). (E) These data were further analyzed for cross-correlation of exhaustion marker expression estimated by pairwise method (see also Supplementary Figure 3). (F) The expression of indicated exhaustion markers on CD8 T cells is plotted versus PD-1 in a representative HC, an untreated HIV patient with a CD4/CD8 ratio of 0.06 typical of AIDS, and tumor-infiltrating lymphocytes isolated from a lung cancer patient.
Figure 4
Figure 4. An exhaustion map allows comparison of Tex cells across HIV and lung cancer
(A) An exhaustion map was generated by tSNE-based dimensionality reduction on 48 samples (see Supplementary Table 7) using information about expression of 16 exhaustion markers (see Supplementary Table 4) on nonnaive (CD45RA−CCR7−) CD8 T cells. (B) Expression of individual molecules (upper left corner of each panel) on the exhaustion map is visualized (color based on percentile of marker expression). (C) Schematic: The exhaustion map was generated for HIV patients with varying severity of untreated disease based on CD4/CD8 ratio and ART-treated patients and compared to HC and patients with lung cancer. (D) HIV-, FLU-, and CMV-specific CD8 T cells identified by tetramer staining were visualized on the exhaustion map. (E) Total CD8 T cells from HC and viremic and ART-treated HIV+ patients and from (F) lung cancer patient samples were mapped to the exhaustion landscape: PBMC (left), macroscopically uninvolved lung tissue (middle) or tumor-infiltrating lymphocytes (right). (G) Differential overlay of TILs compared to CD8 T cells from uninvolved lung on the exhaustion map. A TIL>LU cluster was gated (gate indicated by the arrow) and validated on a per-sample basis (right).
Figure 5
Figure 5. High-dimensional clustering identifies Tex cell phenotypes linked to HIV disease progression
(A) Schematic of the pipeline for high-dimensional CD8 Tex cellcluster identification by phenograph and assessment in disease (B) Phenograph analysis of Tex cell markers was performed on live singlet CD45+CD3+CD8+ T cells (n=48; see Supplementary Table 7). Canonical CD8 T cell populations and total PD-1+ T cells were analyzed for their composition based on the phenograph analysis. The top 5 phenograph clusters within TN, TCM, TEM, TEMRA and PD-1+ CD8 T cells are shown. (C) Phenograph clusters were tested for expression of T cell markers using manual gating. Heatmap indicates expression of markers or marker combinations (using (+) or (−), as in PD-1+CD39+) or MMI (e.g., TOX). Row- and column-based clustering was performed using Pearson’s correlation. The heatmap coloring reflects z scores after row normalization, as indicated. (D) The contribution of phenograph clusters to virus-specific T cell responses from HIV patients and HC detected via tetramer staining was analyzed, the top 5 clusters are shown (n=24 tetramer responses; CMV n=4, FLU n=5, HIV n=15). Changes in phenograph cluster composition of HIV-specific T cells on or off antiretroviral therapy (ART) are displayed. (E) The distribution of phenograph clusters in HC and HIV patients (total n= 25) with differing disease states (CD4/CD8 ratio for viremic “Severe”: <0.2, “Intermediate”: 0.2-0.5, “Mild”: >0.5) is shown. The coloring reflects cluster assignment. The mean frequency of each cluster for each patient population is depicted by the size of the corresponding bar. (F) Viremic HIV and control samples were stimulated with PMA/Ionomycin and analyzed for cytokine expression by cluster mapping using phenograph classify function and the scaffold parameters detailed in Supplementary Table 6. Heatmap indicates gated expression of markers or marker combinations and the functional exhaustion score (FES) (see STAR Methods). Column-based clustering using Pearson’s correlation metric was performed. Rows are arranged by FES. Values displayed are column normalized. (G) The correlation of each phenograph cluster frequency with key parameters of HIV disease progression in viremic HIV patients (i.e. CD4/CD8 ratio and viral load) was plotted (upper left panel). This coordinate system displays the relative frequency of each cluster in HC, HIV patients with untreated disease and patients on ART therapy (remaining panels). The dot size corresponds linearly to cluster relative abundance, the color corresponds to the FES.
Figure 6
Figure 6. Distinct exhausted high dimensional clusters are enriched in HIV patients and differentially linked to HIV progression
(A) The FES was calculated for in vitro differentiated TEFF (TEFF generated from total PBMC, or sorted TN, TCM, TEM, or TEMRA see STAR Methods) and compared to phenograph clusters. TCM and TEMRA-enriched clusters c7 and c10 are displayed for comparison in addition to phenograph clusters with high FES. (B) Comparison of in vitro differentiated TEFF (as in A) to the 9 Tex cell subsets with highest FES. Median frequencies of populations positive for given marker are displayed. Heatmap is clustered by row and column using Pearson’s correlation. (C) Tex cell clusters with high FES were analyzed for classical differentiation subsets. Depicted is the frequency of the indicated Tex cell clusters that fell into the classically gated TN, TCM, TEM, or TEMRA phenotypes or was PD-1+ (D) Phenograph clusters were plotted based on a tSNE analysis using exhaustion marker expression as outlined in Supplemental Figure 3 and colored by the FES. (E) Clusters were analyzed for transcription factor expression and arranged based on FES. Heatmap is clustered by rows using Pearson’s correlation. (F) Tex cell clusters with high FES were plotted versus correlation of cluster frequency with CD4/CD8 and viral load. (G) Virus-specific T cells identified in PBMCs from HC and HIV patients were analyzed for the prevalence of the Top 2 (upper graph) and Top 9 (middle graph) clusters with highest FES (sum of percentages for Top 2 and Top 9 clusters is displayed). The TEX ratio (lower graph) is shown as the sum of clusters defined to be disease associated (DAT; i.e. linked to severe HIV) divided by the sum of clusters defined to be health associated (HAT; i.e., linked to mild HIV), as in Figure 6F. (H) As in (G), Top 2, Top 9 and TEX ratio was determined for CD8+ T cells from PBMC of HC and HIV patients and displayed by HIV disease stage. Heatmap coloring in (A), (B), (E) reflects z scores after column normalization.
Figure 7
Figure 7. TIL dysfunction in lung cancer is linked to Tex cell phenotypes shared with severe HIV and tissue-associated features
(A) Distribution of phenograph clusters in the blood, uninvolved lung tissue and tumor from 7 lung cancer patients and HC. The mean frequency of each cluster in each patient population is indicated by the size of the corresponding bar. (B) Tumors were evaluated based on CD8 TIL IFN-γ production following overnight anti-CD3 stimulation, and stratified into high and low TIL functionality. (C) The relative frequency of each cluster is shown on the same exhaustion coordinate system as in Figure 6D and Supplementary Figure 6. (D) Sum of the frequencies for the Top 2 and Top 9 Tex cell clusters and TEX ratio were determined as defined in Figure 6. (E) Clusters overrepresented in low or high functionality TIL are shown (for stacked bar analysis see Supplementary Figure 5). * indicates p <0.05. c8: p=0.07; c29: p=0.08. (F) Bivariate plots indicate expression of markers of exhaustion, activation, tissue residency and transcriptional programming for clusters differentially linked to tumor functionality. Plots display concatenated CD8 T cell data from lung cancer patients and HC as assigned by phenograph clustering. (G) The sum of the frequencies of HAT or DAT clusters linked to mild or severe HIV was determined in the lung cancer cohort. TIL data was analyzed both as total aggregate data and separating the high and low functionality samples as shown in (B). DAT clusters enrich in the dysfunctional tumor microenvironment in lung cancer.

Comment in

  • Bigger and better in Tex's.
    Joshi S, Pillai A. Joshi S, et al. Sci Immunol. 2018 Jun 1;3(24):eaau2260. doi: 10.1126/sciimmunol.aau2260. Sci Immunol. 2018. PMID: 29858288 Free PMC article.

References

    1. Angelosanto JM, Blackburn SD, Crawford A, Wherry EJ. Progressive loss of memory T cell potential and commitment to exhaustion during chronic viral infection. J Virol. 2012;86:8161–8170. - PMC - PubMed
    1. Baitsch L, Baumgaertner P, Devevre E, Raghav SK, Legat A, Barba L, Wieckowski S, Bouzourene H, Deplancke B, Romero P, et al. Exhaustion of tumor-specific CD8(+) T cells in metastases from melanoma patients. J Clin Invest. 2011;121:2350–2360. - PMC - PubMed
    1. Bengsch B, Ohtani T, Herati RS, Bovenschen N, Chang KM, Wherry EJ. Deep immune profiling by mass cytometry links human T and NK cell differentiation and cytotoxic molecule expression patterns. J Immunol Methods 2017 - PMC - PubMed
    1. Bengsch B, Seigel B, Ruhl M, Timm J, Kuntz M, Blum HE, Pircher H, Thimme R. Coexpression of PD-1, 2B4, CD160 and KLRG1 on exhausted HCV-specific CD8+ T cells is linked to antigen recognition and T cell differentiation. PLoS Pathog. 2010;6:e1000947. - PMC - PubMed
    1. Betts MR, Nason MC, West SM, De Rosa SC, Migueles SA, Abraham J, Lederman MM, Benito JM, Goepfert PA, Connors M, et al. HIV nonprogressors preferentially maintain highly functional HIV-specific CD8+ T cells. Blood. 2006;107:4781–4789. - PMC - PubMed

Publication types

MeSH terms

Substances