. 2018 May 15;23(7):1922-1931.e4.
doi: 10.1016/j.celrep.2018.04.045.

GSK3β Regulates Brain Energy Metabolism

Affiliations

GSK3β Regulates Brain Energy Metabolism

Stephen A Martin et al. Cell Rep. .

Abstract

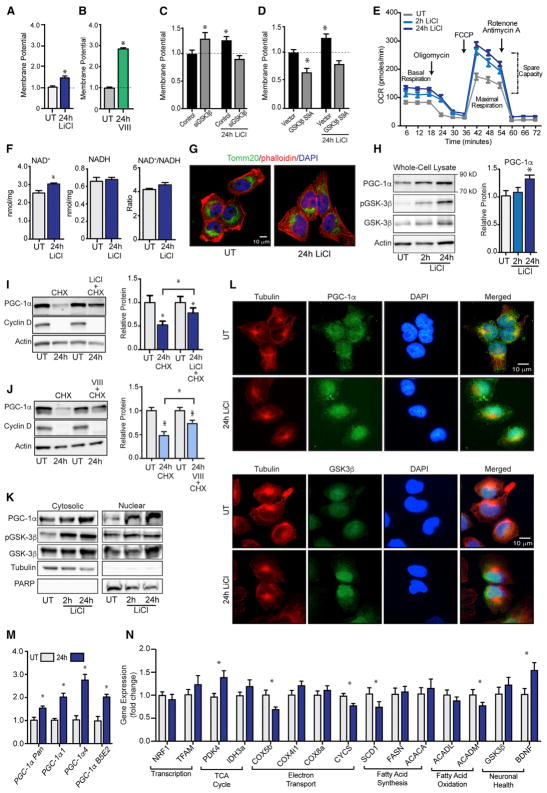
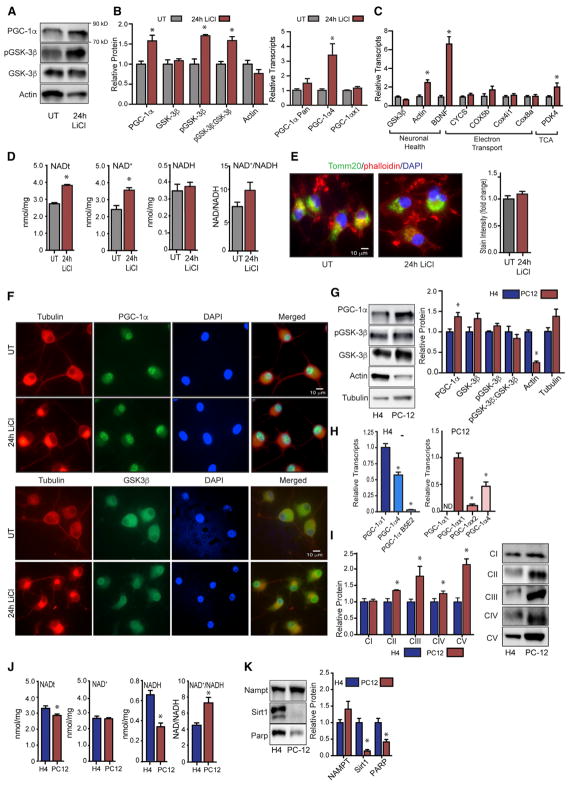
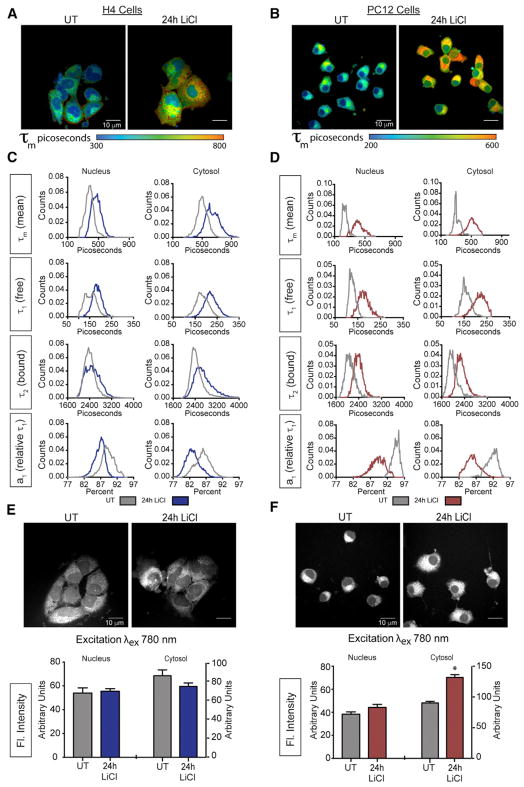
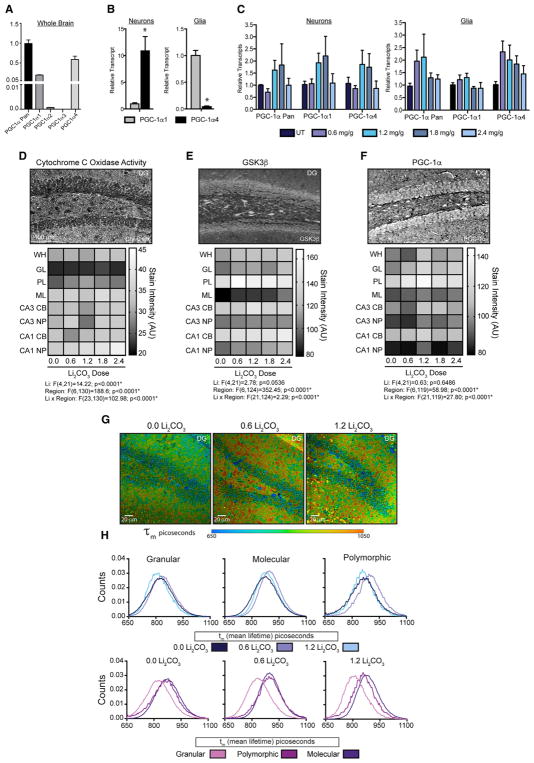
GSK3β is a serine threonine kinase implicated in the progression of Alzheimer's disease. Although the role of GSK3β in growth and pathology has been extensively studied, little is known about the metabolic consequences of GSK3β manipulation, particularly in the brain. Here, we show that GSK3β regulates mitochondrial energy metabolism in human H4 neuroglioma cells and rat PC12-derived neuronal cells and that inhibition of GSK3β in mice in vivo alters metabolism in the hippocampus in a region-specific manner. We demonstrate that GSK3β inhibition increases mitochondrial respiration and membrane potential and alters NAD(P)H metabolism. These metabolic effects are associated with increased PGC-1α protein stabilization, enhanced nuclear localization, and increased transcriptional co-activation. In mice treated with the GSK3β inhibitor lithium carbonate, changes in hippocampal energy metabolism are linked to increased PGC-1α. These data highlight a metabolic role for brain GSK3β and suggest that the GSK3β/PGC-1α axis may be important in neuronal metabolic integrity.

Keywords: GSK3β; PGC-1α; brain; energy metabolism; glia; hippocampus; lithium; neuron.


Conflict of interest statement

DECLARATION OF INTERESTS

The authors declare no competing interests.

Figures

Figure 1
Figure 1. GSK3β Regulates Mitochondrial Metabolism and PGC-1α Stability, Localization, and Activity in H4 Glioma
(A–D) JC-1 measurement of mitochondrial membrane potential following (A) LiCl (15 mM) or (B) inhibitor VIII (15 μM) treatment and following LiCl treatment (15 mM) in cells transfected with GSK3β siRNA (C) or GSK3β-S9A (D). (E–J) Basal and maximal cellular respiration (E); NAD+, NADH, and NAD+/NADH ratio (F); immunodetection of mitochondrial Tomm20 (G); PGC-1α, GSK3β, GSK3β, and actin protein levels following 2- or 24-hr LiCl treatment (H); PGC-1α, cyclin D, and actin protein detection in cells treated with cyclohexamide (100 μM) in the absence or presence of LiCl (15 mM) (I); or inhibitor VIII (15 μM) (J). (K–N) Protein levels of PGC-1α, pGSK3β, GSK3β, tubulin, and PARP protein in cytoplasmic and nuclear fractions following 24-hr LiCl treatment (K); immunodetection of tubulin, PGC-1α, and GSK3β (L); RT-PCR detection of PGC-1α (M); and the indicated transcripts following LiCl treatment (N). n = 3–6 biological replicates per assay; data are shown as an average ± SEM; *p < 0.05 ANOVA.
Figure 2
Figure 2. GSK3β Regulation of PGC-1α Activity in PC12-Derived Neuron-like Cells
(A) Detection of PGC-1α, pGSK3β, GSK3β, and actin proteins following LiCl treatment (15 mM). (B and C) RT-PCR detection of PGC-1α (B) and indicated transcripts following 24-hr LiCl treatment (C). (D) Total NAD (NADt), NAD+, NADH, and NAD+/NADH ratio following 24-hr LiCl treatment. (E) Immunodetection of mitochondrial Tomm20. (F) Immunodetection of PGC-1α, GSK3β, and tubulin. (G) Protein levels of PGC-1α, pGSK3β, GSK3β, actin, and tubulin in H4 glioma and PC12-derived neuronal cells. (H) RT-PCR detection PGC-1α isoforms in H4 glioma and PC12. (I) Protein levels of subunits of complexes I–V of the electron transport system. (J) Total NAD (NADt), NAD+, NADH, and NAD+/NADH ratio in H4 glioma and PC12-derived neuronal cells. (K) Protein levels of NAMPT, Sirt1, and PARP proteins in H4 glioma and PC12-derived neuronal cells. n = 3–6 biological replicates per assay; data are shown as an average ± SEM; *p < 0.05 Student’s t test.
Figure 3
Figure 3. GSK3β Affects Cellular NAD(P)H Metabolism
(A and B) Representative image showing mean fluorescence lifetime (τm) in picoseconds (exλ780) in the absence or presence of LiCl (15 mM) for H4 glioma (A) and PC12-derived neurons (B). (C and D) Distributions of mean fluorescence lifetime τm (top rows), short component τ1 (upper middle rows), long component τ2 (lower middle rows), a1, the relative contribution of τ1 to τm (bottom row) before and after 24 hr LiCl treatment for H4 glioma (C) and PC12-derived neurons (D). (E and F) NAD(P)H fluorescent intensity within the nucleus and cytoplasm following 24-hr LiCl treatment (15 mM) for H4 glioma (E) and PC12-derived neurons (F). n = 6–8 biological replicates per measure; data are shown as a distribution or as an average ± SEM; *p < 0.05, linear mixed model.
Figure 4
Figure 4. Inhibition of GSK3β Regulates Hippocampal Energy Metabolism in Mice
(A and B) RT-PCR detection of PGC-1α isoforms in the whole-mouse brain (A) or in isolated neurons and glia (B). (C) RT-PCR detection of PGC-1α isoforms in neurons and glia isolated from the whole brain of mice fed the indicated doses of dietary lithium carbonate (Li2CO3) for 4 months. (D–F) Representative images and quantification of cytochrome C oxidase mitochondrial activity stain (D), GSK3β immunodetection (E), and PGC-1α immunodetection in the indicated hippocampal regions from Li2CO3 fed mice (F). (G and H) Representative images of mean fluorescence lifetime (τm) in picoseconds (exλ780) in the dentate gyrus from Li2CO3 fed mice (G) and τm distributions separated by region (top panel) and by dose (bottom panel) (H). n = 4–6 mice per Li2CO3 dosage; data shown as an average ± SEM or distributions; *p < 0.05, linear mixed models. WH, whole hippocampus; DG, dentate gyrus; GL, granular layer; PL, polymorphic layer; ML, molecular layer; CB, cell bodies; and NP, neuropil.

References

    1. Anderson RM, Barger JL, Edwards MG, Braun KH, O’Connor CE, Prolla TA, Weindruch R. Dynamic regulation of PGC-1alpha localization and turnover implicates mitochondrial adaptation in calorie restriction and the stress response. Aging Cell. 2008;7:101–111. - PMC - PubMed
    1. Bélanger M, Allaman I, Magistretti PJ. Brain energy metabolism: focus on astrocyte-neuron metabolic cooperation. Cell Metab. 2011;14:724–738. - PubMed
    1. Beurel E, Grieco SF, Jope RS. Glycogen synthase kinase-3 (GSK3): regulation, actions, and diseases. Pharmacol Ther. 2015;148:114–131. - PMC - PubMed
    1. Bird DK, Yan L, Vrotsos KM, Eliceiri KW, Vaughan EM, Keely PJ, White JG, Ramanujam N. Metabolic mapping of MCF10A human breast cells via multiphoton fluorescence lifetime imaging of the coenzyme NADH. Cancer Res. 2005;65:8766–8773. - PubMed
    1. Cheng A, Wan R, Yang JL, Kamimura N, Son TG, Ouyang X, Luo Y, Okun E, Mattson MP. Involvement of PGC-1α in the formation and maintenance of neuronal dendritic spines. Nat Commun. 2012;3:1250. - PMC - PubMed

Publication types

MeSH terms

Substances