. 2018 May 16;16(5):e2004734.
doi: 10.1371/journal.pbio.2004734. eCollection 2018 May.

Tissue-specific activities of the Fat1 cadherin cooperate to control neuromuscular morphogenesis

Affiliations

Tissue-specific activities of the Fat1 cadherin cooperate to control neuromuscular morphogenesis

Françoise Helmbacher. PLoS Biol. .

Abstract

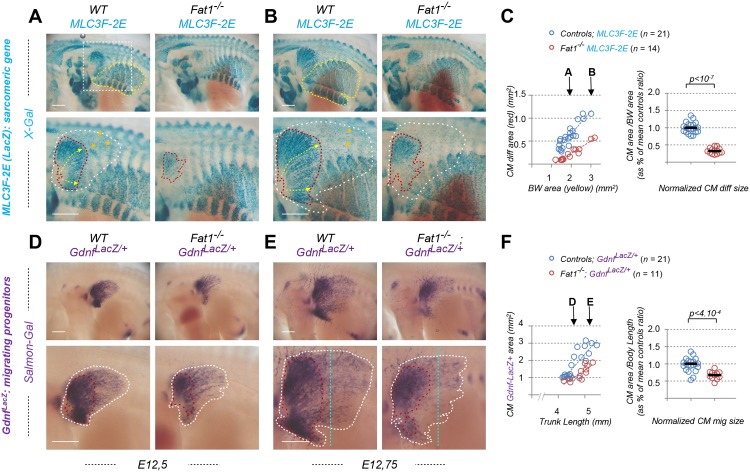
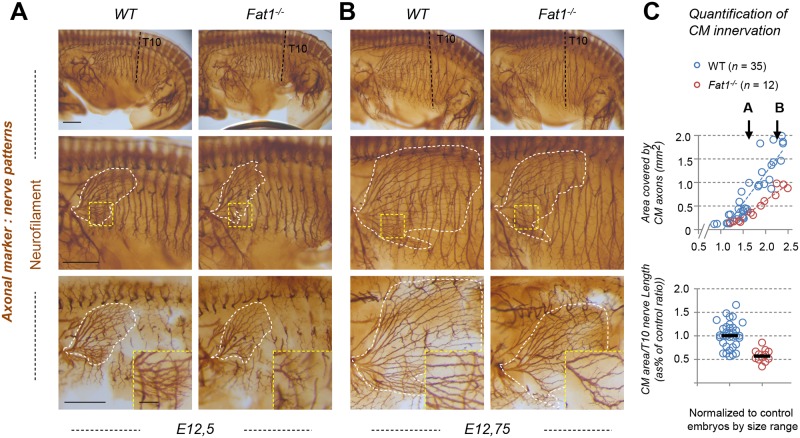
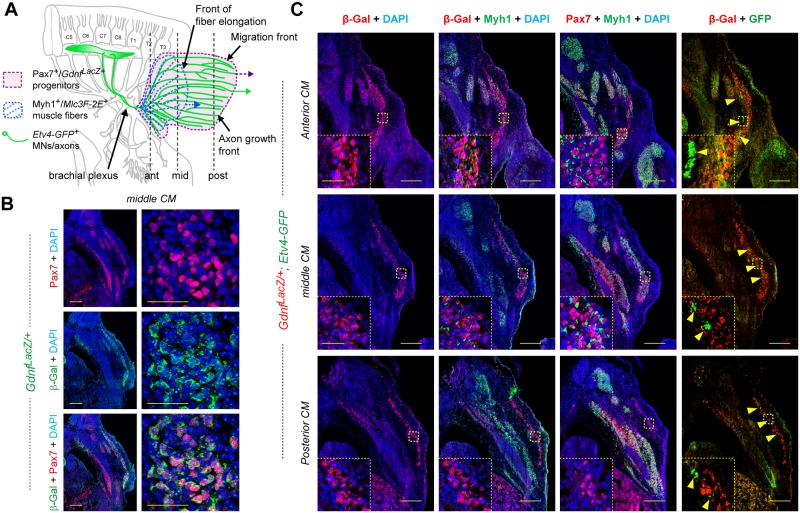
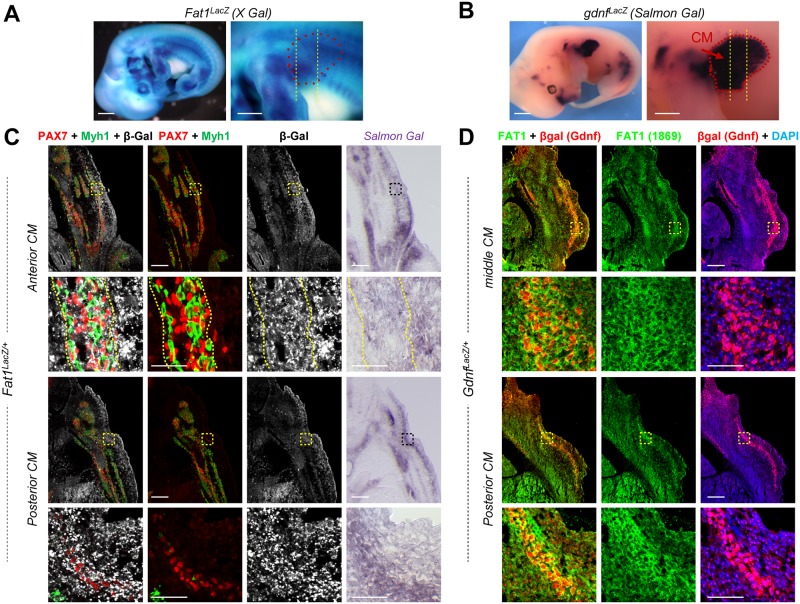
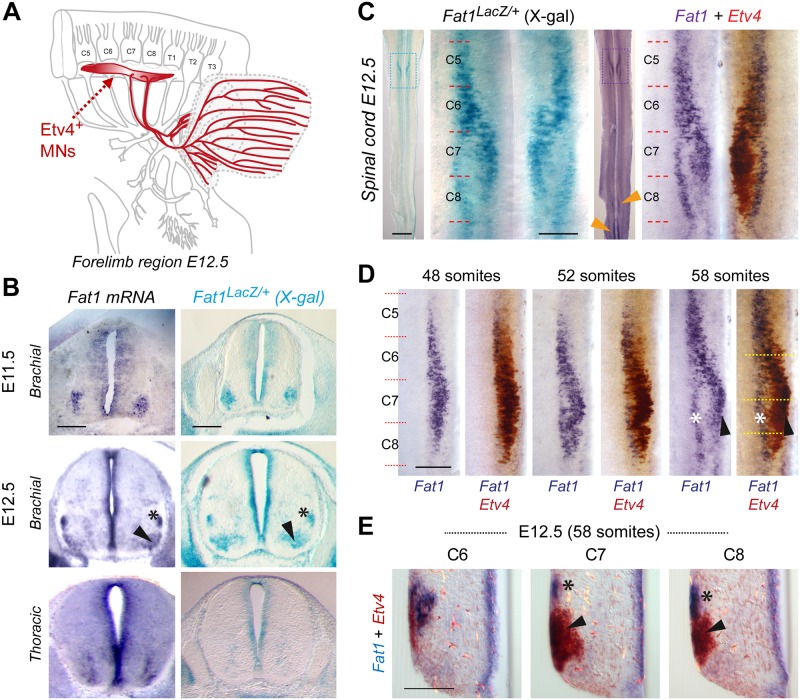
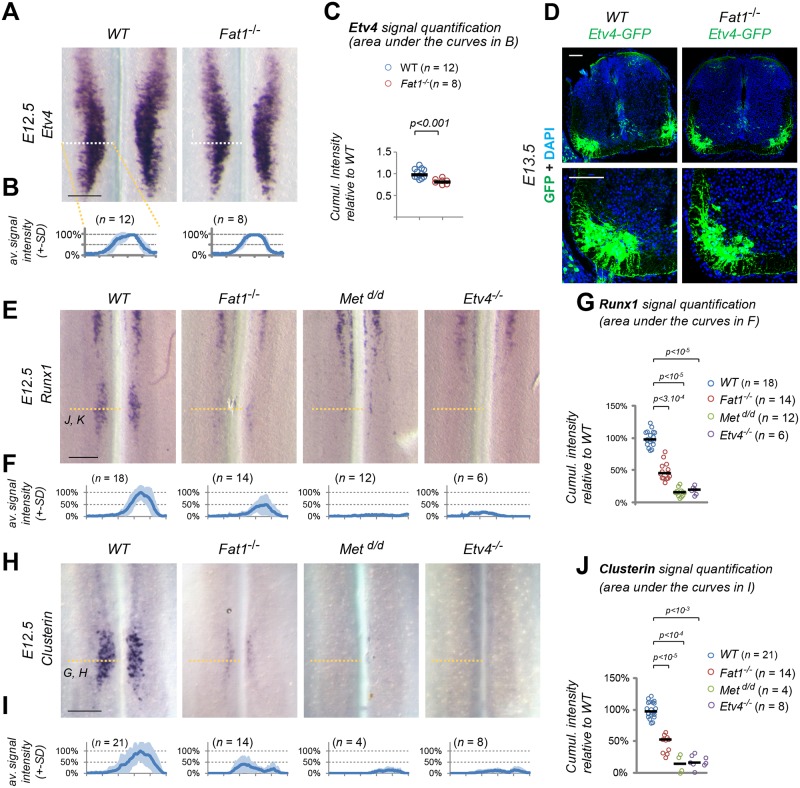
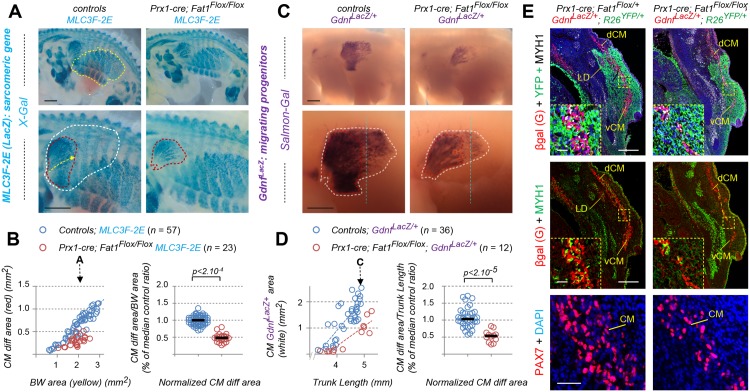
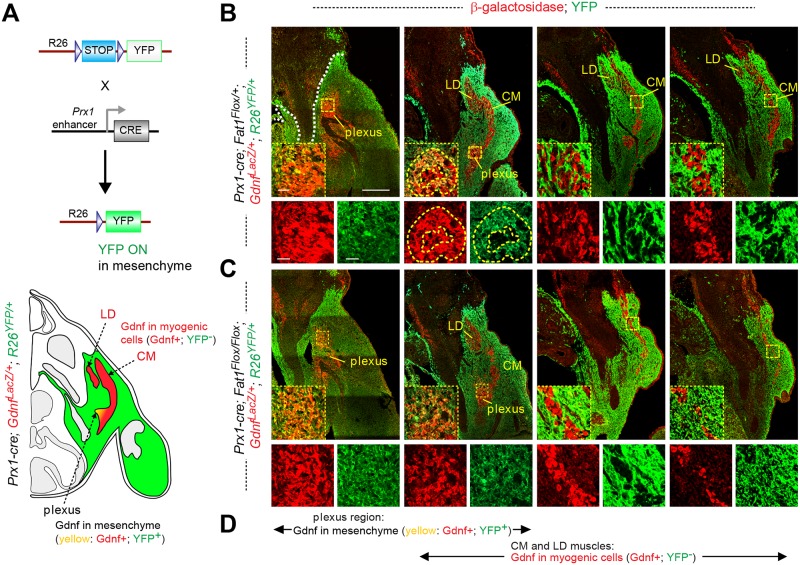
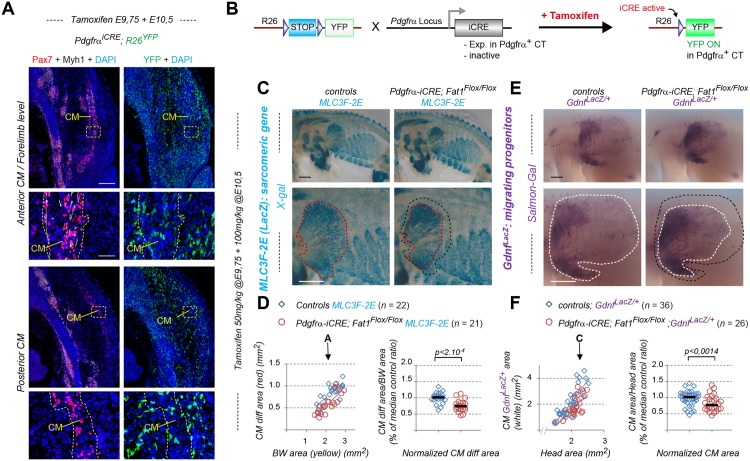
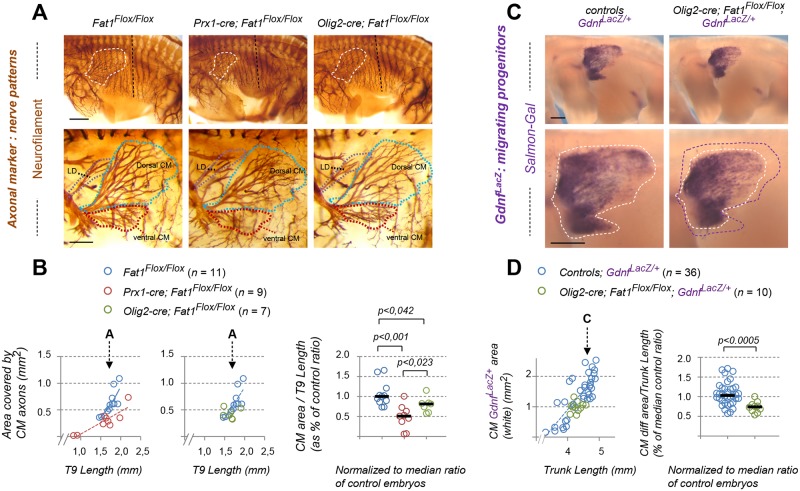
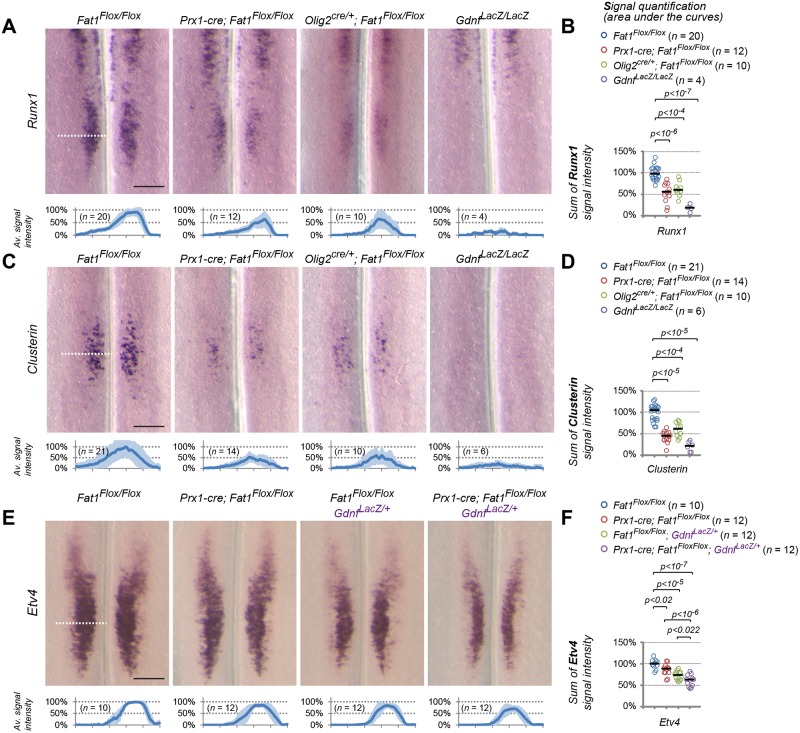
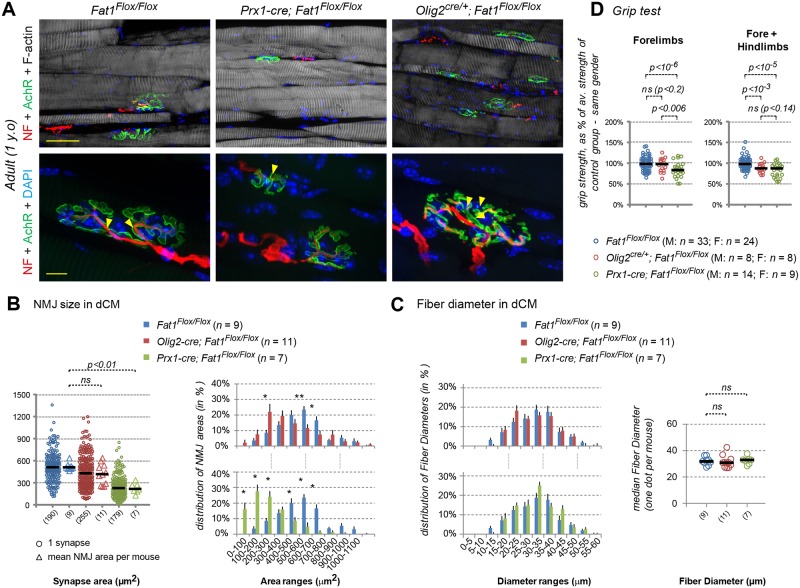
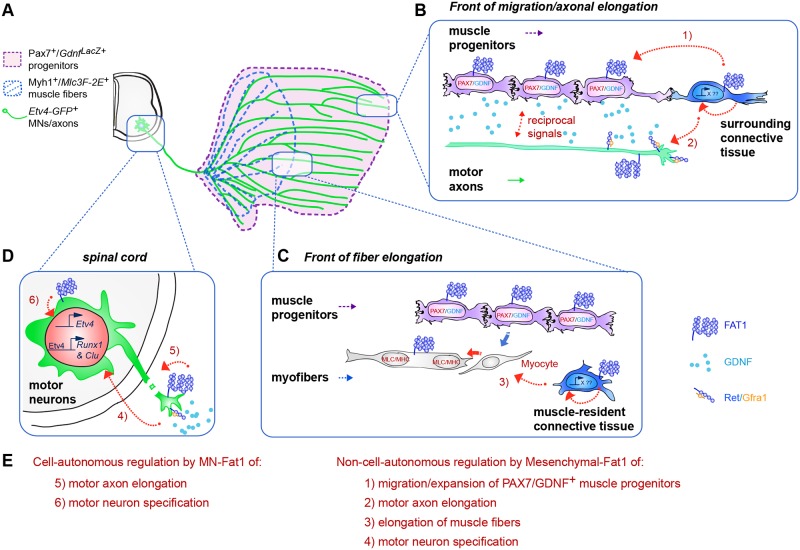
Muscle morphogenesis is tightly coupled with that of motor neurons (MNs). Both MNs and muscle progenitors simultaneously explore the surrounding tissues while exchanging reciprocal signals to tune their behaviors. We previously identified the Fat1 cadherin as a regulator of muscle morphogenesis and showed that it is required in the myogenic lineage to control the polarity of progenitor migration. To expand our knowledge on how Fat1 exerts its tissue-morphogenesis regulator activity, we dissected its functions by tissue-specific genetic ablation. An emblematic example of muscle under such morphogenetic control is the cutaneous maximus (CM) muscle, a flat subcutaneous muscle in which progenitor migration is physically separated from the process of myogenic differentiation but tightly associated with elongating axons of its partner MNs. Here, we show that constitutive Fat1 disruption interferes with expansion and differentiation of the CM muscle, with its motor innervation and with specification of its associated MN pool. Fat1 is expressed in muscle progenitors, in associated mesenchymal cells, and in MN subsets, including the CM-innervating pool. We identify mesenchyme-derived connective tissue (CT) as a cell type in which Fat1 activity is required for the non-cell-autonomous control of CM muscle progenitor spreading, myogenic differentiation, motor innervation, and for motor pool specification. In parallel, Fat1 is required in MNs to promote their axonal growth and specification, indirectly influencing muscle progenitor progression. These results illustrate how Fat1 coordinates the coupling of muscular and neuronal morphogenesis by playing distinct but complementary actions in several cell types.


Conflict of interest statement

The authors have declared that no competing interests exist.

Figures

Fig 1
Fig 1. Fat1 knockout alters expansion of the subcutaneous muscle, CM.
Whole-mount β-galactosidase staining was performed using X-gal as substrate on embryos carrying the MLC3F-2E transgene (S1 Table) (A, B) or using Salmon-Gal as substrate on embryos carrying the GdnfLacZ/+ allele (S1 Table) (D, E). In each case, two successive stages are shown, E12.5 (A,D) and E12.75 (B, E), respectively with Fat1+/+ (left) and Fat1-/- (right) embryos, with the lower panels showing a higher magnification of the flank in which the CM muscle spreads. On upper panels in (A, B), the yellow dotted line highlights the BW muscles, the area of which is being measured. The white square highlights the area shown in lower panels. Lower panels: the red dotted line highlights the area covered by differentiating MLC3F-2E+ muscle fibers constituting the CM muscle in (A, B), also matching an area of higher GdnfLacZ intensity in (D, E); the white dotted lines highlight the area corresponding to the full shape of the GdnfLacZ+ area in (D, E), in which a low density of blue (MLC3F-2E+) nuclei can also be observed in (A, B). (C) Quantifications of the relative expansion of the MLC3F-2E+ CM differentiated area. Left plot: for each embryo side, the area of differentiated CM is plotted relative to the BW area. Arrows represent the stages shown in (A) and (B), respectively. Right plot: for each embryo, the CM area/BW area was normalized to the median ratio of control embryos. Blue dots: Fat1+/+; MLC3F-2E (n = 21); red dots: Fat1-/-; MLC3F-2E (n = 14). Underlying data are provided in S1 Data. (F) Quantifications of the relative expansion of the GdnfLacZ+ area. Left plot: for each embryo side, the GdnfLacZ+ area is plotted relative to the length of the trunk (measured between two fixed points). Arrows represent the stages shown in (D) and (E), respectively. Right plot: for each embryo, the CM area/trunk length was normalized to the median ratio of control embryos. Blue dots: Fat1+/+; GdnfLacZ/+ (n = 21); red dots: Fat1-/-; GdnfLacZ/+ (n = 11). Underlying data are provided in S1 Data. Scale bars: 500 μm. BW, body wall; CM, cutaneous maximus; Gdnf, glial cell line-derived neurotrophic factor; MLC3F-2E, Mlc3f-nLacZ-2E line (S1 Table); Salmon-Gal, 6-Chloro-3-indolyl-β-D-galactopyranoside, substrate for β-galactosidase activity; WT, wild-type; X-gal, 5-bromo-4-chloro-3-indolyl-β-D-galactopyranoside, substrate for β-galactosidase activity.
Fig 2
Fig 2. Fat1 knockout alters motor innervation of the CM muscle.
(A, B) The nerve pattern was analyzed by IHC with antibodies against neurofilament in E12.5 (A) to E12.75 (B) wild-type and Fat1-/- embryos. Embryos were cut in half, cleared in BB-BA, and flat-mounted. Upper panels are low-magnification images of the left flank, showing the whole trunk. Lower panels show high-magnification views of the area containing the CM muscle. The area covered by CM-innervated axons is highlighted in white (middle panels). Axons of vertically oriented thoracic spinal nerves have been manually removed by dissection in the lower panels to improve visibility of CM axons. Inserts in the lower panels represent higher magnification of the area in the yellow squares. (C) Quantifications of the relative expansion of the area covered by CM-innervating axons. Upper plot: for each embryo side, the area covered by CM-innervating axons is plotted relative to the length of a thoracic nerve (T10, from dorsal root origin to ventral tip). Arrows point the stages of representative examples shown in (A) and (B). Bottom plot: for each embryo, the CM-innervated area/T10 length was normalized to the median ratio of control embryos, by size range. Blue dots: Fat1+/+ (n = 35, same sample set as in controls of S3 Fig); red dots: Fat1-/- (n = 12). Underlying data are provided in S1 Data. Scale bars: 500 μm (large images); 100 μm (inserts in lower panels). BB-BA, benzyl-benzoate/benzyl-alcohol mix; CM, cutaneous maximus; IHC, immunohistochemistry; T10, 10th thoracic nerve; WT, wild-type.
Fig 3
Fig 3. Topographic organization of myogenesis and nerve pattern in the CM muscle.
(A) Scheme representing the shape of the CM muscle seen from the side of an embryo, featuring the area covered by GdnfLacZ+ muscle progenitors in purple, MLC3F-2E+ muscle fibers represented in blue, and CM-innervating axons represented in green, indicating (vertical lines) the level corresponding to sections shown in (B) and (C). (B) Cross section of an E12.5 GdnfLacZ/+ embryo, at the middle CM level, immunostained with antibodies to Pax7 (red) and β-galactosidase (green), showing that GdnfLacZ is expressed in Pax7+ progenitors. (C) Cross sections of an E12.5 GdnfLacZ/+; Etv4-GFP+ embryo at the anterior CM (top pictures), middle CM (middle row), and posterior CM (bottom row) levels and immunostained with antibodies to Pax7 (red), β-galactosidase (red), Myh1 (green), and GFP (green) and with DAPI (blue). At each level, three neighboring sections of the same embryo were used with the indicated antibody combinations. In (C), inserts show high magnifications of the area highlighted with the yellow dotted square. Scale bars: low-magnification pictures in C: 200 μm; inserts in C: 40 μm; high-magnification (right) pictures in B: 40 μm; low-magnification pictures (left) in B: 200 μm. ant, anterior CM level; β-Gal, β-galactosidase; CM, cutaneous maximus; C5 to C8, Cervical levels 5 to 8; Etv4, Ets variant gene 4; Etv4-GFP, transgenic line in which expression of an Etv4-GFP fusion protein is driven by the Etv4 locus (S1 Table); GFP, green fluorescent protein; mid, middle CM level; Myh1, myosin heavy chain 1; Pax7, paired box 7; post, posterior CM level; T1 to T3, Thoracic levels 1 to 3.
Fig 4
Fig 4. Fat1 is expressed in CM progenitors and the surrounding subcutaneous mesenchyme.
(A) Fat1 expression is visualized in an E12.5 Fat1LacZ/+ embryo by X-gal staining. Left panel: whole embryo picture; right panel: higher magnification of the forelimb and flank region in which the CM spreads. In the right panel, the approximate CM shape is highlighted by red dotted lines, and the level of sections shown in (C) is indicated by vertical lines. (B) Gdnf expression is visualized in an E12.5 GdnfLacZ/+ embryo (S1 Table) by Salmon-Gal staining. Left panel: whole embryo left side view. Right panel: higher magnification of the upper forelimb and flank region, showing that the CM exhibits a high level of GdnfLacZ+ expression (highlighted with red dotted lines). The level of sections shown in (D) is represented by vertical bars. (C) Cross sections of an E12.5 Fat1LacZ/+ embryo at anterior and posterior CM levels were immunostained with antibodies against Pax7 (red), Myh1 (green), and β-galactosidase (white). The right panels show neighboring sections of the same Fat1LacZ/+ embryo in which β-galactosidase activity was revealed by Salmon-Gal staining. (D) Comparison between expression of GdnfLacZ (visualized with an anti-β-galactosidase antibody [red]) and that of Fat1 (green, Ab FAT1-1869 Sigma) on two cross sections of an E12.5 GdnfLacZ/+ mouse embryo at middle and posterior CM levels, as indicated in (B). Fat1 protein is detected both within and around the GdnfLacZ/+ CM progenitors. Scale bars (A, B): 1 mm (left), 500 μm (right); (C, D): 200 μm (low magnification), 50 μm (high magnification). β-Gal, β-galactosidase; CM, cutaneous maximus.
Fig 5
Fig 5. Fat1 is expressed in subsets of brachial MN pools, including CM-innervating Etv4+ MNs.
(A) Scheme representing the brachial region of a mouse embryo at E12.5 with the C4–T2 portion of the spinal cord, the corresponding spinal nerves and their projections to the forelimb, with Etv4+ MNs and their axons highlighted in red, whereas the target muscles CM and LD are delineated in blue (the LD being underneath the CM). (B) Fat1 expression in the mouse brachial spinal cord is shown by in situ hybridization in wild-type embryo sections (left panels) and by X-gal staining on sections of Fat1LacZ/+ spinal cords at E11.5 (top) and E12.5 (bottom), showing expression in all neural progenitors in the ventricular zone and in pools of MNs, visible as one single cluster at E11.5 and two separate pools (arrowhead and asterisk) at E12.5. (C) Fat1 expression in the mouse brachial spinal cord at E12.5 is shown through an X-gal staining of a Fat1LacZ/+ spinal cord (left) or a double in situ hybridization with Fat1 (purple) and Etv4 (brown) RNA probes on a wild-type spinal cord. Fat1 expression is detected in Etv4-expressing MN pools (arrowheads) but also expressed in a distinct dorsal column (asterisk). Spinal cords are flat-mounted, such that the ventral midline is seen as a vertical line in the middle, and motor columns are seen on both sides. For both stainings, the entire spinal cord is shown on the left, and a magnification of the brachial region is shown on the right (corresponding to the delineated zone). Left and right sides of the in situ hybridization panel show a mirror image of the same spinal cord side before and after developing the brown (Etv4) reaction. (D) Double in situ hybridizations with Fat1 (purple) and Etv4 (brown) RNA probes on wild-type spinal cords at three successive time points, 48 somites (E11.5), 52 somites (E12.0), and 58 somites (E12.5), showing the left side of the brachial spinal cord after developing Fat1 only (purple, left) or after developing the second reaction, in brown (right). (E) Cross section on the 58 somite spinal cord shown in (D, right panel) at the three levels indicated by the dotted line in (D), showing the partial overlap (arrowhead) between Fat1 and Etv4 expression and the dorsal pool of MNs expressing Fat1 only. Scale bars, (B) 200 μm; (C) low magnification: 1 mm; (C) high magnification: 200 μm; (D) 200 μm; and (E) 100 μm. CM, cutaneous maximus; C5 to C8, Cervical segments 5 to 8; Etv4, Ets variant gene 4; LD, latissimus dorsi; MN, motor neuron.
Fig 6
Fig 6. Fat1 knockout alters the specification of CM motor neuron pools.
(A) Etv4 expression was analyzed by in situ hybridization in E12.5 wild-type and Fat1-/- embryos. The images represent flat-mounted spinal cords in the brachial region. (B) Quantifications of Etv4 signal: each plot represents the average signal distribution (± standard deviation in light blue) measured on the indicated number of spinal cord sides along the white dotted line in each image in (A) (Fat1+/+ [n = 12; this set of controls includes the same samples as those shown in S7 Fig]; Fat1-/- [n = 8]). (C) Quantifications and statistical analyses of the sum of signal intensity corresponding to the area under the curves in plots shown in (C): each dot represents the sum of Etv4 intensity for each spinal cord side, the number of samples being indicated (the two sides of each embryo are considered independent). (B–C) Underlying data are provided in S1 Data. (D) Sections of spinal cords from E13.5 Fat1+/+; Etv4-GFP and Fat1-/-; Etv4-GFP embryos (Etv4-GFP transgene, S1 Table) were stained with antibodies against GFP and with DAPI. (E–J) Analysis by ISH of Runx1 (E) and Clusterin (H) expression in flat-mounted brachial spinal cords from E12.5 wild-type, Fat1-/-, Metd/d, and Etv4-/- embryos: expression of Clusterin and Runx1 in the C7–C8 segments is lost in both Etv4 and Met mutants and severely reduced in Fat1-/- spinal cords, whereas the rostral domain of Runx1 expression is independent of Met, Etv4, and Fat1. Quantifications of Runx1 (F, G) and Clusterin (I, J) signal intensity: each plot in (F, I) represents the average signal distribution (± standard deviation in light blue) measured on the indicated number of spinal cord sides along the orange dotted line in each image above (with the corresponding genotype), in (F) for Clusterin and (I) for Runx1. (F, G) Clusterin probe: Fat1+/+ (n = 21); Fat1-/- (n = 14); Metd/d (n = 4); Etv4-/- (n = 8); (I, J) Runx1 probe: Fat1+/+ (n = 18); Fat1-/- (n = 14); Metd/d (n = 12); and Etv4-/- (n = 6). Underlying data are provided in S1 Data. (G, J) Quantifications and statistical analyses of the sum of signal intensity corresponding to the area under the curves in plots shown in (F) and (I), respectively: each dot represents the sum of Runx1 or Clusterin intensity for each spinal cord side, the number of samples being indicated. Underlying data are provided in S1 Data. Scale bars: 200 μm (A, E, H); 100 μm (D). CM, cutaneous maximus; ISH, in situ hybridization; WT, wild-type.
Fig 7
Fig 7. Mesenchyme-specific Fat1 deletion non–cell-autonomously alters CM expansion.
(A, C) Whole-mount β-galactosidase staining was performed using X-gal as a substrate on embryos carrying the MLC3F-2E transgene (A), or using Salmon-Gal as substrate on embryos carrying the GdnfLacZ/+ allele (C), in the context of mesenchyme-specific deletion of Fat1, driven by Prx1-cre (S1 Table) at E12.5. Top images show a side view of the whole flank of an embryo. Yellow dotted lines highlight the area occupied by body wall muscles. Lower images are higher magnification of the area in which the CM spreads. Red and white dotted lines correspond (as in Fig 1) to the areas covered by MLC3F-2E+ CM fibers (red, A) and to the area covered by GdnfLacZ+ progenitors (white, C), respectively. (B) Quantification of the expansion rate of differentiated CM fibers. Left graph: For each embryo side, the area covered by differentiated CM fibers was plotted relative to the area occupied by body wall muscles. Right plot: for each embryo, the CM area/body wall area was normalized to the median ratio of control embryos. Blue dots: Fat1Flox/Flox; MLC3F-2E (n = 57, includes the same set of controls as S8C Fig); red dots: Prx1-cre; Fat1Flox/Flox-; MLC3F-2E (n = 23). Underlying data are provided in S1 Data. (D) Quantification of the expansion rate of the area occupied by GdnfLacZ+ progenitors. Left plot: for each embryo side, the area covered by GdnfLacZ+ progenitors was plotted relative to the trunk length. Right plot: for each embryo, the GdnfLacZ+ CM area/trunk length was normalized to the median ratio of control embryos. Blue dots: Fat1Flox/Flox; GdnfLacZ/+ (n = 36, pooling respective littermates); red dots: Prx1-cre; Fat1Flox/Flox-; GdnfLacZ/+ (n = 12). Underlying data are provided in S1 Data. (E) Cross sections of E12.5 Prx1-cre; Fat1Flox/+; GdnfLacZ/+; R26YFP/+ and Prx1-cre; Fat1Flox/Flox; GdnfLacZ/+; R26YFP/+ embryos at equivalent rostro-caudal positions (caudal CM level) were immunostained with antibodies against GFP/YFP (green) to reveal the domain of Prx1-cre activity (green) against β-galactosidase (red), against Myh1 (white on top panels and inserts, green on middle panels), against Pax7 (bottom panels), and with DAPI (blue). The yellow dotted boxes indicate the areas magnified in inserts and in the bottom panels, in equivalent positions of the CM. Images show that lowered Gdnf levels represent a non–cell-autonomous consequence of lack of Fat1 signaling in the mesenchyme of Prx1-cre; Fat1Flox/Flox embryos and result from a reduced number of Pax7-GDNF-expressing progenitors cells rather than from a lower level of GdnfLacZ expression per cell. Scale bars: (A, C) 500 μm; (E) low magnification: 200 μm; inserts: 20 μm; lower panels: 40 μm. CM, cutaneous maximus; cre, cre recombinase; dCM, dorsal cutaneous maximus; GFP, green fluorescent protein; Prx1-cre, mesenchymal cre expression driven by a regulatory enhancer of the paired related homeobox 1 gene; R26, Rosa26 locus; vCM, ventral cutaneous maximus; X-gal, substrate for β-galactosidase; YFP, yellow fluorescent protein.
Fig 8
Fig 8. Mesenchymal Fat1 is required for expansion of the myogenic component of Gdnf expression domain but dispensable for Gdnf expression in plexus mesenchyme.
(A) Top: principle of the genetic paradigm used to follow the Prx1-cre lineage, using the R26Lox-STOP-Lox-YFP reporter line combined with Prx1-cre. In tissues in which cre is not expressed, YFP expression is prevented by the STOP cassette. In CRE-expressing mesenchymal cells, STOP cassette excision allows YFP expression. Bottom: scheme of a cross section of a Prx1-cre; R26YFP/+; GdnfLacZ/+ embryo, highlighting in green the cells in which YFP expression is activated, in red, the cells expressing GdnfLacZ, and in white or gray, the other non-recombined tissues. (B, C) Cross sections of E12.5 Prx1-cre; Fat1Flox/+; GdnfLacZ/+; R26YFP/+ (B) and Prx1-cre; Fat1Flox/Flox; GdnfLacZ/+; R26YFP/+ (C) embryos stained with antibodies against GFP (YFP; to reveal the domain of Prx1-cre activity, in green), with an anti-β-galactosidase antibody (for GdnfLacZ, red), visualized at four successive rostro-caudal positions spanning from the brachial plexus to the caudal half of the CM muscle. For each level, the inserts below represent a high-magnification view of the area indicated in the yellow dotted boxes, showing red only, green only, and overlay. (D) Visual summary of the two components of GdnfLacZ expression domain, spanning the sections shown in (B) and (C): at the plexus level, GdnfLacZ is expressed in YFP+ cells derived from Prx1-cre mesenchyme, whereas in the CM and LD muscles (emerging from the plexus and extending dorsally and caudally), GdnfLacZ-positive cells do not express YFP, as they are from the myogenic rather than the mesenchymal lineage. At the point where the first myogenic patches emerge from the plexus, such myogenic patches (red only, yellow dotted line in [B], second section) can be surrounded by mesenchymal-Gdnf cells (red + green = yellow, white dotted lines). The overall analysis shows that Prx1-cre-mediated Fat1 ablation does not affect Gdnf expression in the plexus mesenchyme but causes non–cell-autonomous reduction in the myogenic component of Gdnf expression domain through a reduction of the number of GdnfLacZ-expressing myogenic progenitors. Scale bars: (B, C) low magnification: 200 μm; inserts: 20 μm. CM, cutaneous maximus; cre, cre recombinase; LD, latissimus dorsi; Lox, recombination sites for the CRE recombinate; Lox-STOP-Lox, cassette in which STOP signal for transcription/translation is flanked by Lox sites; Prx1-cre, transgene driving cre expression in the mesenchyme; R26, Rosa26 locus; YFP, yellow fluorescent protein.
Fig 9
Fig 9. Inducible Fat1 deletion in the pdgfrα connective tissue lineage alters progression of CM migration and differentiation.
(A) Cross sections of a Pdgfrα-iCre; R26YFP/+ embryo collected at E12.5, after in utero administration of tamoxifen at E9.75 (50 mg/kg) + E10.5 (100 mg/kg). Alternate sections at anterior and posterior CM levels, respectively, were immunostained with antibodies against: left panels: Pax7 (red) and myh1 (white), plus DAPI (blue); right panels: GFP (green), plus DAPI (blue), to reveal the outcome of Pdgfrα-iCre-mediated R26-YFP recombination (right panels). The yellow dotted boxes indicate the areas magnified in the bottom panels. (B) Principle of the genetic paradigm used to follow the Pdgfrα-iCre lineage, using the R26Lox-STOP-Lox-YFP reporter line combined with Pdgfrα-iCre. iCRE (CRE/ERT2) is expressed in the domain of Pdgfrα expression but remains catalytically inactive. iCRE activity is permitted by in utero treatment with tamoxifen. Catalytic activity is triggered in the cells expressing iCRE at the time of tamoxifen treatment, thus allowing the stop cassette to be deleted and YFP to be permanently expressed. (C, E) Whole-mount β-galactosidase staining was performed using X-gal as substrate on embryos carrying the MLC3F-2E transgene (C) or using Salmon-Gal as substrate on embryos carrying the GdnfLacZ/+ allele (E) in the context of tamoxifen-induced Fat1 deletion in the Pdgfrα lineage driven by Pdgfrα-iCre at E12.5. Top images show a side view of the whole flank of an embryo. Lower images are higher magnification of the area in which the CM spreads. Red and white dotted lines correspond to the areas covered in control embryos by MLC3F-2E+ CM fibers (C) and by GdnfLacZ+ progenitors (E), respectively. In comparison, the corresponding areas observed in mutants are indicated as black dotted lines in both cases. (D) Quantification of the expansion rate of differentiated CM fibers. Left graph: For each embryo side, the area covered by differentiated CM fibers was plotted relative to the area occupied by body wall muscles. Right plot: for each embryo, the CM area/body wall area was normalized to the median ratio of control embryos. Blue dots: Fat1Flox/Flox; MLC3F-2E (n = 22, control embryos from tamoxifen-treated litters); red dots: Pdgfrα-iCre; Fat1Flox/Flox- ; MLC3F-2E (n = 21). Underlying data are provided in S1 Data. (F) Quantification of the expansion rate of the area occupied by GdnfLacZ+ progenitors. Left plot: for each embryo side, the area covered by GdnfLacZ+ progenitors was plotted relative to the trunk length. Right plot: for each embryo, the GdnfLacZ+ CM area/trunk length was normalized to the median ratio of control embryos. Blue dots: Fat1Flox/Flox; GdnfLacZ/+ (n = 36; control embryos from tamoxifen-treated litters); red dots: Pdgfrα-iCre; Fat1Flox/Flox-; GdnfLacZ/+ (n = 26). Underlying data are provided in S1 Data. Scale bars: (A) low magnification: 200 μm; high magnification: 50 μm; (C, E) 500 μm. CM, cutaneous maximus; CRE/ERT2, CRE fused with the estrogen receptor Tamoxifen-binding domain; iCre, short form of CRE/ERT2; Pdgfrα, platelet-derived growth factor receptor alpha.
Fig 10
Fig 10. Dual control of CM innervation by Fat1 activity in MNs and mesenchyme.
(A) Anti-neurofilament IHC was performed on E12.5 embryos in the context of Prx1-cre-mediated mesenchyme deletion of Fat1 or of Olig2-cre-mediated Fat1 deletion in MNs (S1 Table). After BB-BA clearing, the embryos were cut in half and the internal organs and skin removed to visualize the CM and brachial plexus. Upper panels show the entire flank of Fat1Flox/Flox (left), Prx1-cre; Fat1Flox/Flox (middle), or Olig2-cre; Fat1Flox/Flox (right) at comparable stages. The area covered by CM-innervating axons is outlined with white dotted lines. Lower panels represent a higher magnification of the flank area containing the CM and corresponding motor axons, after manual removal by dissection of a large part of the thoracic cage and nerves. The shape of the control area corresponding to the dCM and vCM is outlined in green and red dotted lines, respectively. (B) Quantifications of the progression of CM innervation. Left and middle plots: for each embryo side, the area covered by CM-innervating axons was plotted relative to the length of the T9 thoracic nerve, comparing Prx1-cre; Fat1Flox/Flox embryos (red dots) to controls (blue dots) on the left plot, and Olig2-cre; Fat1Flox/Flox embryos (green dots) to the same set of controls (blue dots) on the middle plot. Arrows point to the stage of representative examples shown in (A). Right plot: for each embryo, the CM-innervated area/T9 length was normalized to the median ratio of control embryos, by size range. Blue dots: Controls (n = 11, same sample set in left and middle plot, pooling respective littermates); red dots: Prx1-cre; Fat1Flox/Flox (n = 9); green dots: Olig2-cre; Fat1Flox/Flox (n = 7). Underlying data are provided in S1 Data. (C) Whole-mount β-galactosidase staining was performed using Salmon-Gal as substrate on embryos carrying the GdnfLacZ/+ allele, in the context of MN-specific deletion of Fat1, driven by Olig2-cre at E12.5. Top images: side view of the whole flank. Lower images: higher magnification of the area in which the CM spreads. White dotted lines correspond to the area covered by GdnfLacZ+ progenitors, whereas the purple line on the Olig2-cre; Fat1Flox/Flox image indicates the shape of the control area, to highlight the difference. (D) Quantification of the expansion rate of the area occupied by GdnfLacZ+ progenitors. Left plot: for each embryo side, the area covered by GdnfLacZ+ progenitors was plotted relative to the trunk length. Right plot: for each embryo, the GdnfLacZ+ CM area/trunk length was normalized to the median ratio of control embryos. Blue dots: Fat1Flox/Flox; GdnfLacZ/+ (n = 36; same control set as in Fig 7D); red dots: Olig2-cre; Fat1Flox/Flox-; GdnfLacZ/+ (n = 10). Underlying data are provided in S1 Data. Scale bars: (A) top: 500 μm; (A) bottom: 200 μm; (B) 500 μm. BB-BA, benzyl-benzoate/benzyl-alcohol mix; CM, cutaneous maximus; cre, cre recombinase; dCM, dorsal cutaneous maximus; IHC, immunohistochemistry; MN, motor neuron; Olig2, Oligodendrocyte transcription factor 2; Olig2-cre, cre expression in MN progenitors; Prx1-cre, cre expression in the mesenchyme; vCM, ventral cutaneous maximus.
Fig 11
Fig 11. Fat1 is required in both peripheral mesenchyme and motor neurons for proper specification of CM motor pool identity.
(A–B) Analysis of Runx1 (A, B) and Clusterin (C, D) mRNA expression in brachial spinal cords from E12.5 Fat1Flox/Flox, Prx1-cre; Fat1Flox/Flox, Olig2cre/+; Fat1Flox/Flox, and GdnfLacZ/LacZ embryos. Spinal cords are presented as open book and flat-mounted so that the line in the middle of each picture corresponds to the ventral midline, and the motor columns are visible on each side. Fat1 ablation in both the mesenchyme and MNs leads to significant lowering of Clusterin and Runx1 expression levels, whereas expression is absent in the GdnfLacZ/LacZ embryos. Quantifications in (A–D): each plot in (A) and (C) represents, respectively, the average Runx1 and Clusterin signal distribution (± standard deviation in light blue) measured on the indicated number of spinal cord sides along the white dotted line in each image above. Underlying data are provided in S1 Data. (B) The cumulated Runx1 signal intensity (area under the curves in [A]) was plotted for each spinal cord side. Fat1Flox/Flox (n = 20) Prx1-cre; Fat1Flox/Flox (n = 12), Olig2cre/+; Fat1Flox/Flox (n = 10), and GdnfLacZ/LacZ (n = 4). Underlying data are provided in S1 Data. (D) The cumulated Clusterin signal intensity (area under the curves in (C) was plotted for each spinal cord side. Fat1Flox/Flox (n = 21) Prx1-cre; Fat1Flox/Flox (n = 14), Olig2cre/+; Fat1Flox/Flox (n = 10), and GdnfLacZ/LacZ (n = 6). Underlying data are provided in S1 Data. (E) In situ hybridization analysis of the Etv4 expression domain in brachial spinal cord of flat-mounted E12.5 Fat1Flox/Flox, Prx1-cre; Fat1Flox/Flox, Fat1Flox/Flox; GdnfLacZ/+, and Prx1-cre; Fat1Flox/Flox; GdnfLacZ/+ embryos at E12.5. Whereas Fat1 ablation in mesenchyme mildly affects Etv4 expression, genetic lowering of Gdnf levels further prevents Etv4 induction in Prx1-cre; Fat1Flox/Flox; GdnfLacZ/+ embryos, when compared to either Prx1-cre; Fat1Flox/Flox or Fat1Flox/Flox; GdnfLacZ/+. (E, F) Quantifications and statistical analyses of the sum of signal intensity corresponding to the area under the curves in plots shown in (E): each dot represents the sum of intensity for one spinal cord side. Fat1Flox/Flox (n = 10) Prx1-cre; Fat1Flox/Flox (n = 12), Fat1Flox/Flox;GdnfLacZ/+ (n = 12), and Prx1-cre; Fat1Flox/Flox; GdnfLacZ/+ (n = 12). Underlying data are provided in S1 Data. Scale bars: (A, C, E): 200 μm. CM, cutaneous maximus; cre, cre recombinase; Etv4, Ets variant gene 4; MN, motor neuron; Olig2-cre, cre expression in MN progenitors; Prx1-cre, cre expression in the mesenchyme.
Fig 12
Fig 12. Impact of mesenchyme-specific and motor neuron–specific Fat1 ablation on adult CM muscle anatomy and grip strength.
(A–C) Analysis of NMJ morphology (A) was performed by immunostaining with α-Bungarotoxin (green, detecting AchR), phalloidin (white, detecting F-actin), and anti-neurofilament antibodies on cryosections of the dCM in Fat1Flox/Flox, in Olig2cre/+; Fat1Flox/Flox, and in Prx1-cre; Fat1Flox/Flox adult mice (about 1 year old). (A) Top pictures show low 20× magnifications, whereas bottom pictures show high magnification of individual synapses. (B, C) Histograms showing quantification of NMJ area (B) and fiber diameter (C) distributions in the dCM muscle of Fat1Flox/Flox (n = 9), Olig2cre/+; Fat1Flox/Flox (n = 11), and Prx1-cre; Fat1Flox/Flox (n = 7) mice. Underlying data are provided in S1 Data. (B) Left plot shows the synapse area, with all synapses plotted (circles) for each genotype, as well as the median NMJ area per mouse (with each triangle representing one mouse). An average of 20 synapses per mouse were analyzed in the indicated number of mice. Total numbers of synapses and mice are indicated below the graph. Right plots: average distribution of synapse areas in Fat1Flox/Flox (blue bars) and Olig2-cre; Fat1Flox/Flox (red bars) mice (top) and Fat1Flox/Flox (blue bars, same data as above) and Prx1-cre; Fat1Flox/Flox (green bars) mice (bottom). (C) Left plots: average distribution of fiber diameters in the same samples. Right plots show the median fiber diameter in each mouse (one dot representing one mouse). Statistical significance: * indicates p < 0.01, ** indicates p < 0.001, Mann Whitney test. Underlying data are provided in S1 Data. (D) Measurements of grip strength in mice with the indicated genotypes. In the plots, each dot represents the average value for one mouse, assaying forelimb grip strength (left plot) or cumulative strength of forelimbs plus hind limbs (right). For each mouse, the measured strength was normalized to the mean strength of the control group of the same gender, so that males and females could be expressed as percentages and pooled on the same graph. Underlying data are provided in S1 Data. Statistical significance: p-values are indicated for the relevant comparisons, using unpaired student t test for values with normal distribution and equal variance, or Mann Whitney test, otherwise. Significance threshold: p < 0.01. Scale bars: (A) upper images: 50 μm; (A) lower images: 10 μm. AchR, acetylcholine receptor; CM, cutaneous maximus; cre, cre recombinase; dCM, dorsal cutaneous maximus; NMJ, neuromuscular junction; Olig2-cre, cre expression in MN progenitors; Prx1-cre, cre expression in the mesenchyme.
Fig 13
Fig 13. Fat1 coordinates neuromuscular morphogenesis by playing distinct roles in mesenchyme, muscles, and motor neurons.
(A) Scheme representing the CM neuronal circuit, with Etv4+ MNs in the spinal cord and the CM muscle featuring the area covered by GdnfLacZ+ muscle progenitors in purple, MLC3F-2E+ muscle fibers represented in blue, and CM-innervating axons represented in green. (B) Scheme summarizing event occurring at the migration front, where muscle progenitors and axons of CM motor neurons encounter the surrounding connective tissue and the non–cell-autonomous functions exerted by Fat1 by acting in the mesenchyme. (C) Scheme summarizing event occurring at the front of fiber elongation, where new myocytes produced by the neighboring myogenic progenitors are added to elongating myofibers and the non–cell-autonomous function exerted by Fat1, by acting in the resident mesenchymal cells. (D) Scheme of event occurring at the level of CM-innervating MNs, in which Fat1 cell-autonomously promotes axonal growth and fine-tunes cell fate specification by modulating expression of the Etv4 target genes Clusterin and Runx1 in the CM MN pools. (E) Summary of the roles played by Fat1 in MNs and in mesenchyme/connective tissue. Right: in muscle-associated connective tissue (both at the migration front and at the front of fiber elongation), Fat1 acts by controlling the production of a signal (Fat1 protein itself or a gene activated by a signaling cascade downstream of Fat1), which influences (1) expansion of muscle progenitors, (2) motor axon elongation, (3) myofiber elongation, and (4) MN specification. As a result of mesenchyme-specific Fat1 ablation, the reduced CM muscle produces less GDNF, the depletion of which mildly affects Etv4 expression but severely impacts expression of the two Etv4-target genes Clusterin and Runx1. Left: in CM MNs, Fat1 cell-autonomously modulates axon growth and controls Clusterin and Runx1 expression, either directly or as a consequence of the non–cell-autonomous impact of MNs on myogenic progenitor expansion. Clu, Clusterin; CM, cutaneous maximus; Etv4, Ets variant gene 4; Gdnf, glial cell line-derived neurotrophic factor; Gfra1, glial cell line-derived neurotrophic factor family receptor alpha 1; MHC, myosin heavy chain; MLC, myosin light chain; MN, motor neuron; Myh1, myosin heavy chain 1; PAX7, Paired box 7; Runx1, runt related transcription factor 1.

References

    1. Francius C, Clotman F. Generating spinal motor neuron diversity: a long quest for neuronal identity. Cell Mol Life Sci. 2014;71(5):813–29. Epub 2013/06/15. doi: 10.1007/s00018-013-1398-x . - DOI - PMC - PubMed
    1. Comai G, Tajbakhsh S. Molecular and cellular regulation of skeletal myogenesis. Curr Top Dev Biol. 2014;110:1–73. Epub 2014/09/25. doi: 10.1016/B978-0-12-405943-6.00001-4 . - DOI - PubMed
    1. Buckingham M, Rigby PW. Gene regulatory networks and transcriptional mechanisms that control myogenesis. Dev Cell. 2014;28(3):225–38. Epub 2014/02/15. doi: 10.1016/j.devcel.2013.12.020 . - DOI - PubMed
    1. Vasyutina E, Birchmeier C. The development of migrating muscle precursor cells. Anat Embryol (Berl). 2006;211 Suppl 1:37–41. Epub 2006/09/16. doi: 10.1007/s00429-006-0118-9 . - DOI - PubMed
    1. Chevallier A, Kieny M. On the role of the connective tissue in the patterning of the chick limb musculature. Wilehm Roux Arch Dev Biol. 1982;191(4):277–80. Epub 1982/07/01. doi: 10.1007/BF00848416 . - DOI - PubMed

Publication types

Substances

LinkOut - more resources