

Wild boar mapping using population-density statistics: From polygons to high resolution raster maps
- PMID: 29768413
- PMCID: PMC5955487
- DOI: 10.1371/journal.pone.0193295
Wild boar mapping using population-density statistics: From polygons to high resolution raster maps
Abstract
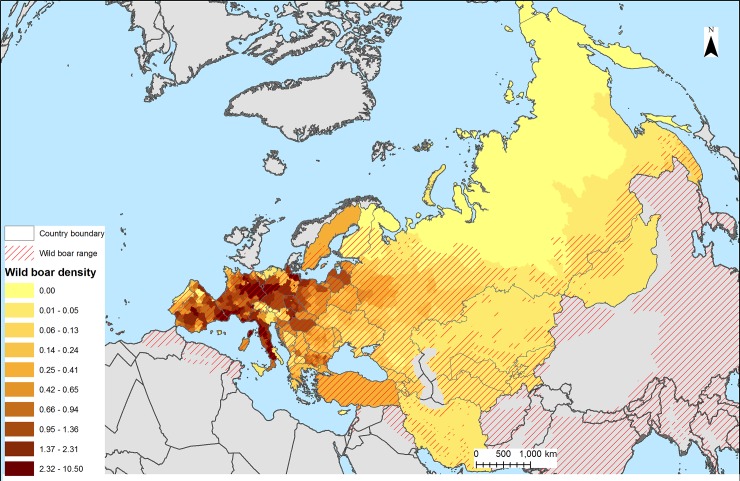
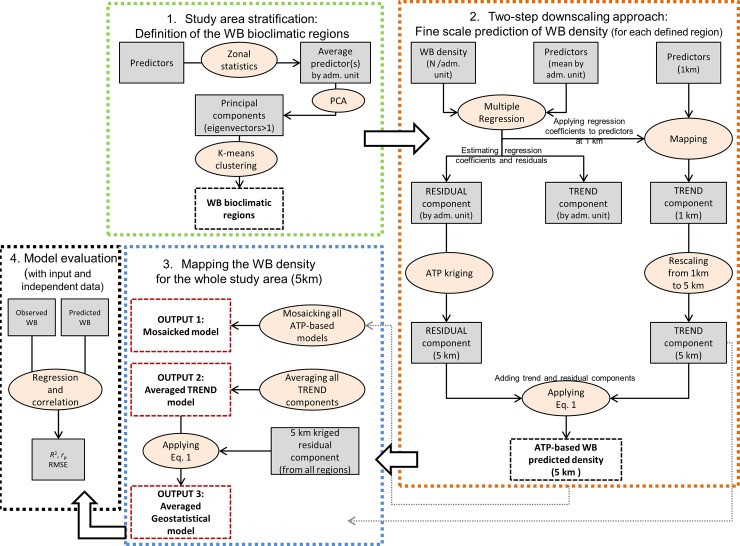
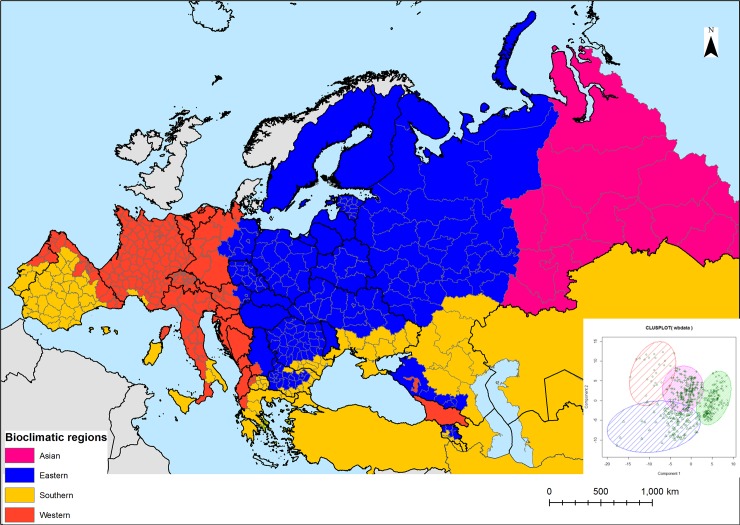
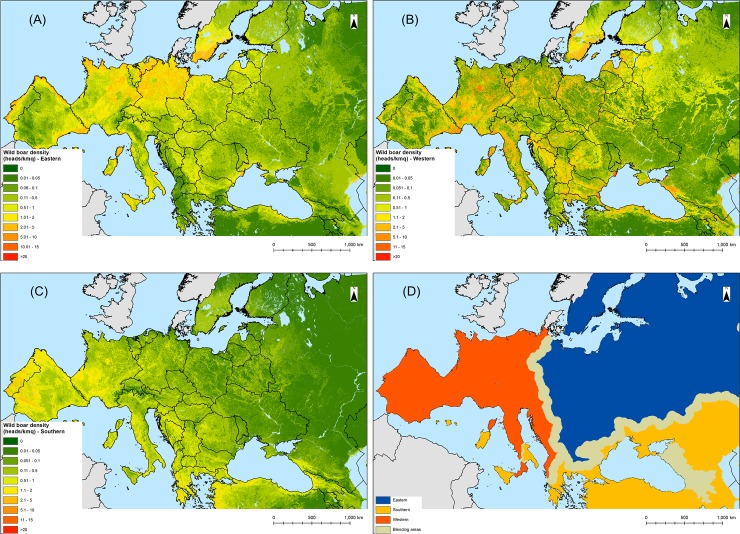
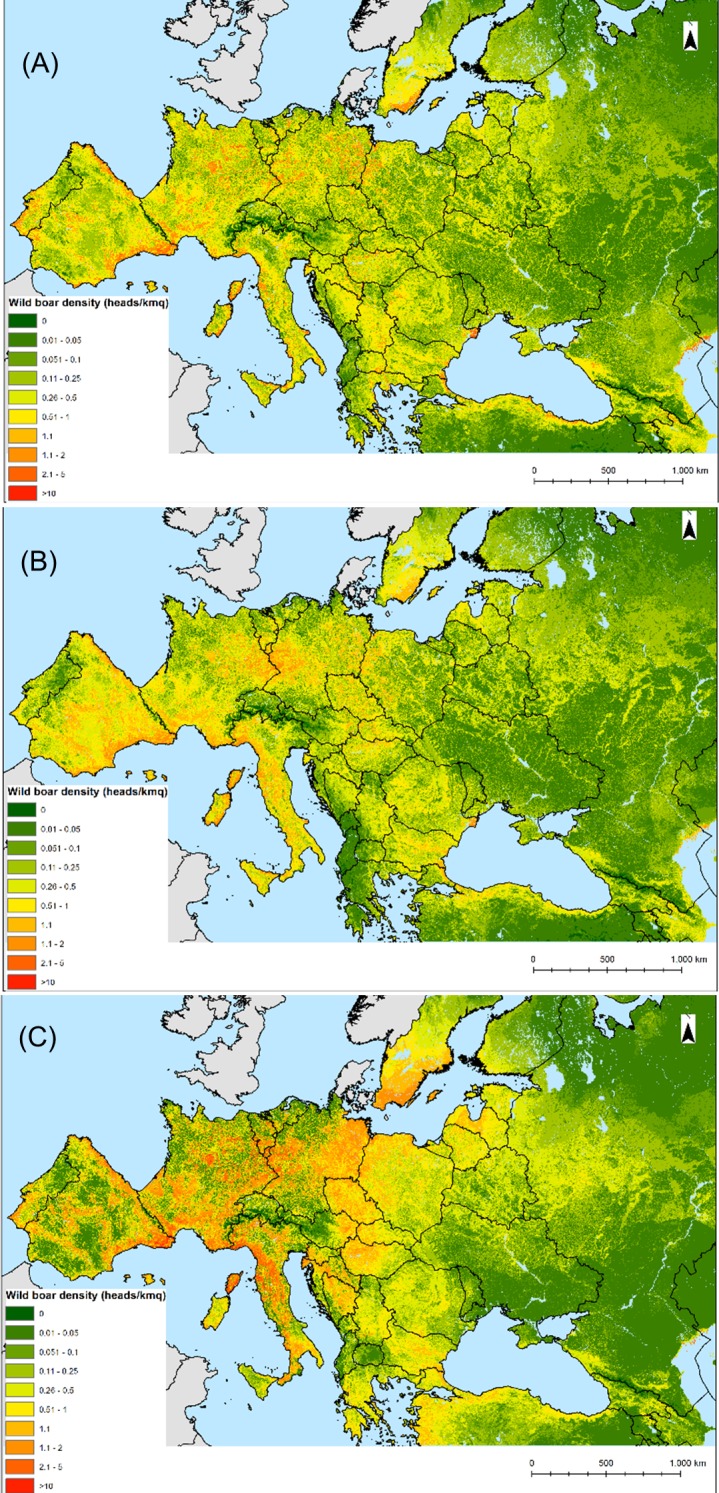
The wild boar is an important crop raider as well as a reservoir and agent of spread of swine diseases. Due to increasing densities and expanding ranges worldwide, the related economic losses in livestock and agricultural sectors are significant and on the rise. Its management and control would strongly benefit from accurate and detailed spatial information on species distribution and abundance, which are often available only for small areas. Data are commonly available at aggregated administrative units with little or no information about the distribution of the species within the unit. In this paper, a four-step geostatistical downscaling approach is presented and used to disaggregate wild boar population density statistics from administrative units of different shape and size (polygons) to 5 km resolution raster maps by incorporating auxiliary fine scale environmental variables. 1) First a stratification method was used to define homogeneous bioclimatic regions for the analysis; 2) Under a geostatistical framework, the wild boar densities at administrative units, i.e. subnational areas, were decomposed into trend and residual components for each bioclimatic region. Quantitative relationships between wild boar data and environmental variables were estimated through multiple regression and used to derive trend components at 5 km spatial resolution. Next, the residual components (i.e., the differences between the trend components and the original wild boar data at administrative units) were downscaled at 5 km resolution using area-to-point kriging. The trend and residual components obtained at 5 km resolution were finally added to generate fine scale wild boar estimates for each bioclimatic region. 3) These maps were then mosaicked to produce a final output map of predicted wild boar densities across most of Eurasia. 4) Model accuracy was assessed at each different step using input as well as independent data. We discuss advantages and limits of the method and its potential application in animal health.
Conflict of interest statement
Figures
References
-
- Ballari SA, Barrios-García MN (2014) A review of wild boar Sus scrofa diet and factors affecting food selection in native and introduced ranges. Mammal Review 44: 124–134.
-
- Massei G, Genov PV (2004) The environmental impact of wild boar Galemys; 16.
-
- Apollonio M, Anderson R, Putman R, editors (2010) European Ungulates and their Management in the 21st Century Cambridge: Cambridge University Press.
-
- Massei G, Kindberg J, Licoppe A, Gačić D, Šprem N, Kamler J, et al. (2015) Wild boar populations up, numbers of hunters down? A review of trends and implications for Europe. Pest Management Science 71: 492–500. doi: 10.1002/ps.3965 - DOI - PubMed
-
- Lewis JS, Farnsworth ML, Burdett CL, Theobald DM, Gray M, Miller RS (2016) Biotic and abiotic factors predicting the global distribution and population density of an invasive large mammal. Sci Rep. 2017;7:44152 doi: 10.1038/srep44152 - DOI - PMC - PubMed
Publication types
MeSH terms
LinkOut - more resources
Full Text Sources
Other Literature Sources
