. 2018 May 16;13(5):e0196127.
doi: 10.1371/journal.pone.0196127. eCollection 2018.

Projecting shifts in thermal habitat for 686 species on the North American continental shelf

Affiliations

Projecting shifts in thermal habitat for 686 species on the North American continental shelf

James W Morley et al. PLoS One. .

Abstract

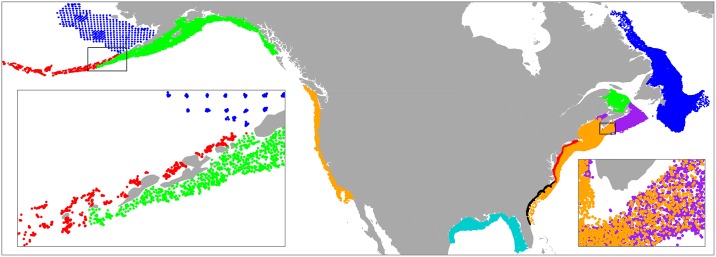
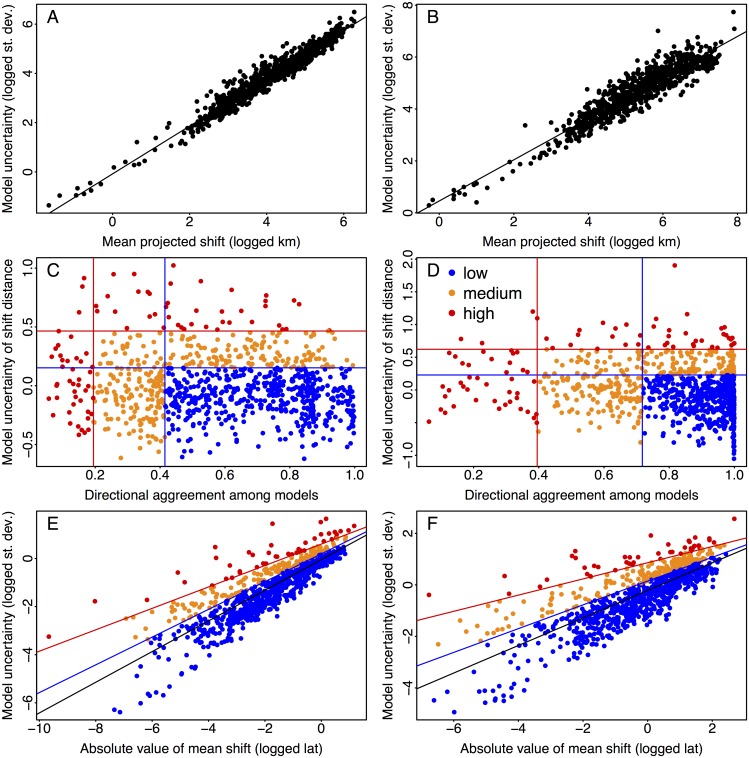
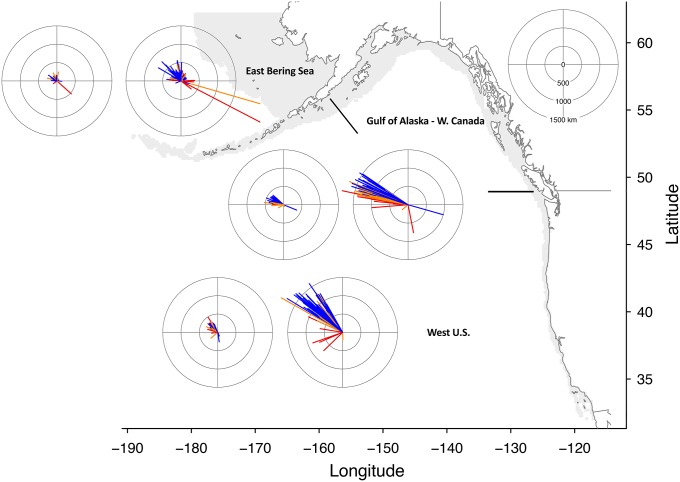
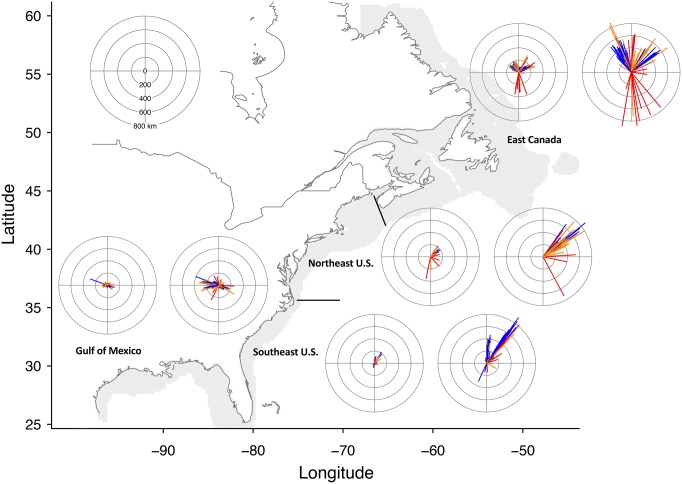
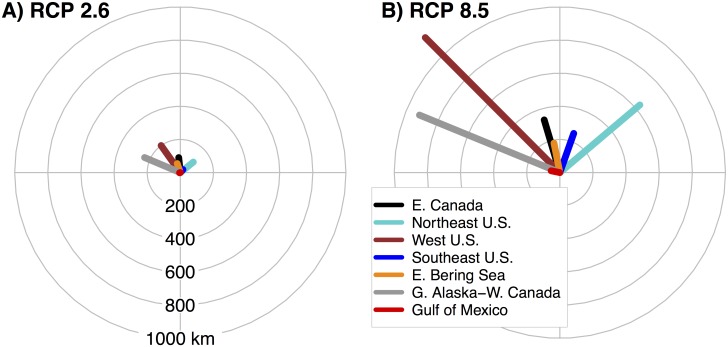
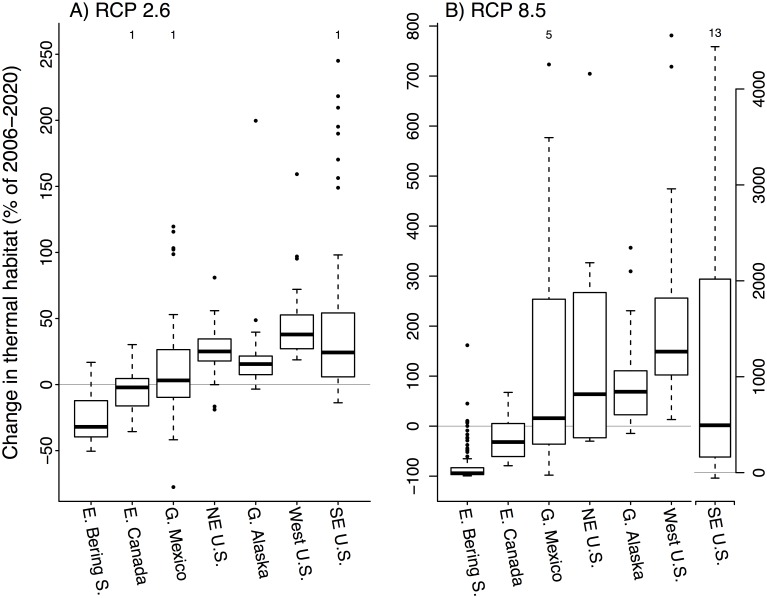
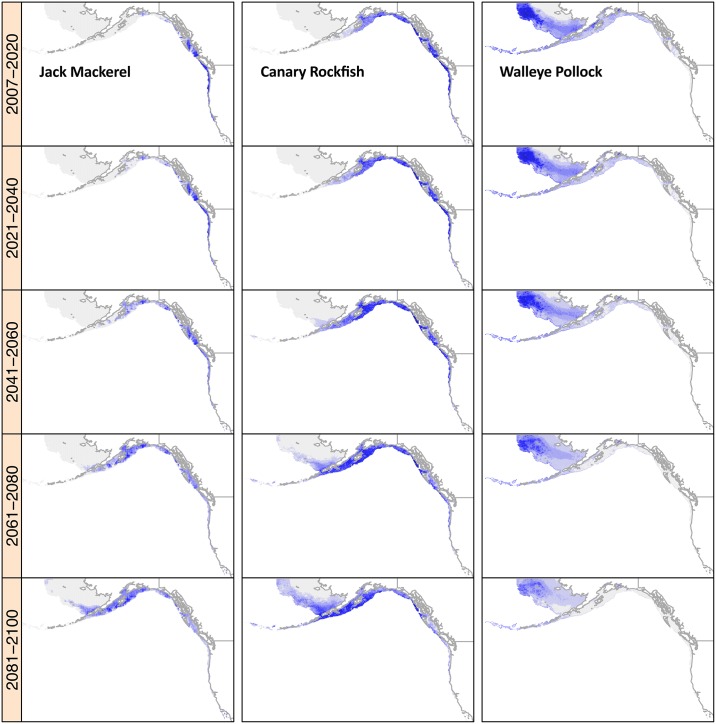
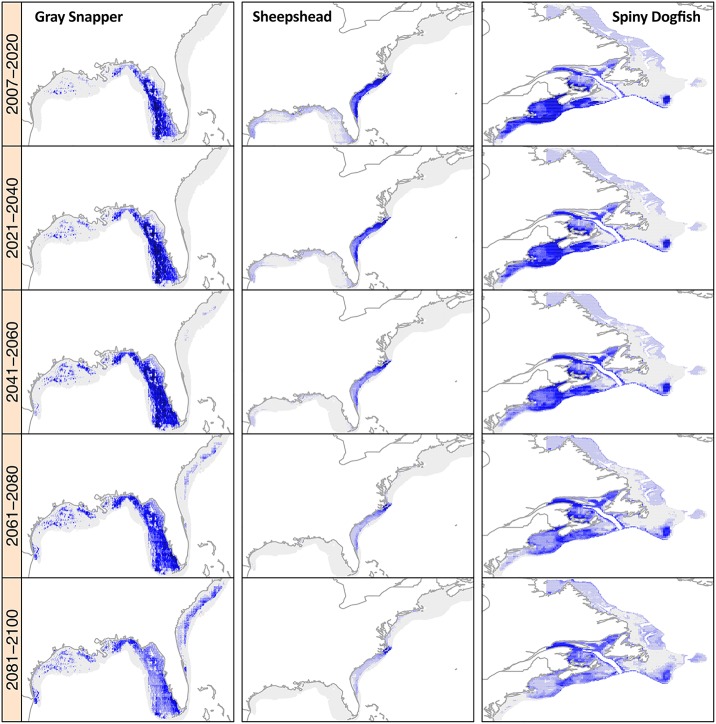
Recent shifts in the geographic distribution of marine species have been linked to shifts in preferred thermal habitats. These shifts in distribution have already posed challenges for living marine resource management, and there is a strong need for projections of how species might be impacted by future changes in ocean temperatures during the 21st century. We modeled thermal habitat for 686 marine species in the Atlantic and Pacific oceans using long-term ecological survey data from the North American continental shelves. These habitat models were coupled to output from sixteen general circulation models that were run under high (RCP 8.5) and low (RCP 2.6) future greenhouse gas emission scenarios over the 21st century to produce 32 possible future outcomes for each species. The models generally agreed on the magnitude and direction of future shifts for some species (448 or 429 under RCP 8.5 and RCP 2.6, respectively), but strongly disagreed for other species (116 or 120 respectively). This allowed us to identify species with more or less robust predictions. Future shifts in species distributions were generally poleward and followed the coastline, but also varied among regions and species. Species from the U.S. and Canadian west coast including the Gulf of Alaska had the highest projected magnitude shifts in distribution, and many species shifted more than 1000 km under the high greenhouse gas emissions scenario. Following a strong mitigation scenario consistent with the Paris Agreement would likely produce substantially smaller shifts and less disruption to marine management efforts. Our projections offer an important tool for identifying species, fisheries, and management efforts that are particularly vulnerable to climate change impacts.


Conflict of interest statement

Competing Interests: The authors have declared that no competing interests exist.

Figures

Fig 1
Fig 1. Biological survey regions.
Locations for 136,044 bottom trawl hauls from long-term ecological surveys conducted on the North American continental shelf. Hauls are colored to indicate the different survey regions described in Table 1.
Fig 2
Fig 2. Species projection uncertainty.
Categorizing uncertainty for 878 species projections within the RCP 2.6 (A, C, and E) and RCP 8.5 (B, D and F) scenarios. (A and B) The logged standard deviation of projected shift distance plotted against the logged mean shift distance in km among 16 GCMs. (C and D) The distance-directional uncertainty (DDU) method where the residual error values from panels (A) and (B) were plotted against shift directional agreement among GCMs. (E and F) The latitudinal uncertainty (LU) method where the logged standard deviation in projected shift in latitude was plotted against logged mean shift in latitude among 16 GCMs. Red and blue lines indicate the 95th and 75th percentiles (C and D) or quantiles (E and F), respectively. Points are colored according to their level of uncertainty where red indicates high uncertainty, orange is medium, and blue is low uncertainty (C–F).
Fig 3
Fig 3. Projected shifts in distribution for west coast species.
The direction and magnitude in km of projected shifts in centroids for 303 species on the North American west coast. Species were grouped into regions based on projected origin of centroid averaged over 2007–2020, but all projections were on a coast-wide scale. Each regional pair of plots consists of RCP 2.6 projections on the left and RCP 8.5 projections on the right. Projections colored blue indicate low uncertainty, orange indicates medium uncertainty, and red indicates high uncertainty. Note that the distance scales on the compass plots and that of the map do not match. The gray area on the map indicates the projection area on the continental shelf.
Fig 4
Fig 4. Projected shifts in distribution for east coast species.
The direction and magnitude in km of projected shifts in centroids for 336 species on the North American east coast and 239 species in the Gulf of Mexico. For additional detail refer to Fig 3 caption. Note that the scale of the compass plots for the east and west coasts differ.
Fig 5
Fig 5. Regional difference in projected distribution shifts.
Mean direction and magnitude of projected centroid shifts over the 21st century for low uncertainty species originating from seven regions of the North American shelf for (A) RCP 2.6 and (B) RCP 8.5.
Fig 6
Fig 6. Projected change in thermal habitat availability.
Mean percentage change in projected thermal habitat availability over the 21st century for low uncertainty species originating from seven regions of the North American shelf for (A) RCP 2.6 and (B) RCP 8.5. Boxes indicate the median and the 25th and 75th percentiles, whiskers extend to within 1.5 of the interquartile range or to data extremes. Number of extreme data points occurring out of the plotting range is indicated for each region at the top. The right y-axis in (B) applies to SE U.S. only. Sample size for each region is provided in Table 4.
Fig 7
Fig 7. Examples of west coast species projections.
Jack mackerel Trachurus symmetricus is in the left-most column, canary rockfish Sebastes pinniger is in the middle column, and walleye pollock Theragra chalcogramma is in the right-most column. Mean annual thermal habitat suitability during summer under RCP 8.5 is shown for twenty-year periods in the 21st century. Habitat quality is higher in areas of greater blue intensity. Gray areas indicate regions of the projection grid that are not suitable thermal habitat. White areas indicate regions not included in the projections (either land or deep water).
Fig 8
Fig 8. Examples of east coast species projections.
Gray snapper Lutjanus griseus is in the left-most column, sheepshead Archosargus probatocephalus is in the middle column, and spiny dogfish Squalus acanthias is in the right-most column. For other details, refer to Fig 7 caption.

References

    1. Sunday JM, Bates AE, Duty NK. Thermal tolerance and the global redistribution of animals. Nat Clim Chang. 2012; 2:686–690.
    1. Poloczanska ES, Brown CJ, Sydeman WJ, Kiessling W, Schoeman DS, Moore PJ, et al. Global imprint of climate change on marine life. Nat Clim Chang. 2013; 3:919–925.
    1. Pinsky ML, Worm B, Fogarty MJ, Sarmiento JL, Levin SA. Marine taxa track local climate velocities. Science. 2013; 341:1239–1242. doi: 10.1126/science.1239352 - DOI - PubMed
    1. Kleisner KM, Fogarty MJ, McGee S, Barnett A, Fratantoni P, Greene J, et al. The effects of sub-regional climate velocity on the distribution and spatial extent of marine species assemblages. PloS ONE. 2016; 1–21. - PMC - PubMed
    1. Hettler WF. Correlation of winter temperature and landings of pink shrimp Penaeus duorarum in North Carolina. Fish Bull. 1992; 90:405–406.

Publication types