. 2018 May 16;13(5):e0197472.
doi: 10.1371/journal.pone.0197472. eCollection 2018.

Secretion of autoimmune antibodies in the human subcutaneous adipose tissue

Affiliations

Secretion of autoimmune antibodies in the human subcutaneous adipose tissue

Daniela Frasca et al. PLoS One. .

Abstract

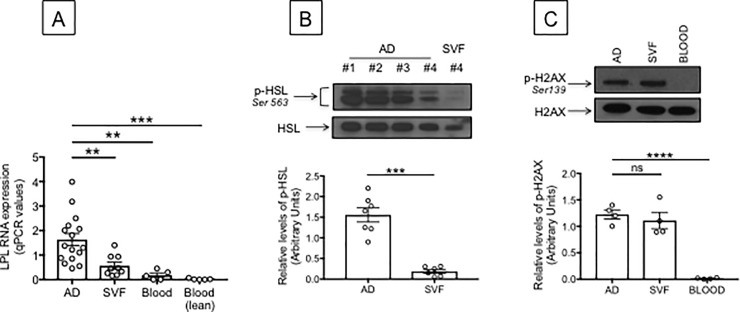
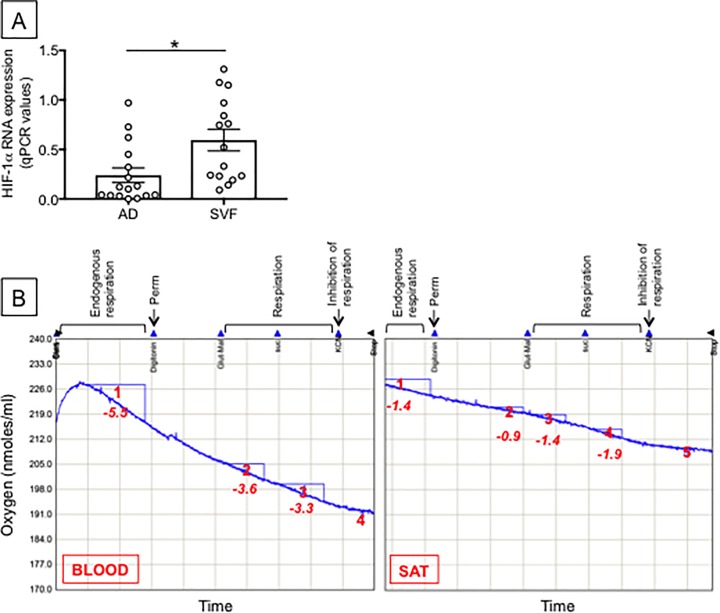
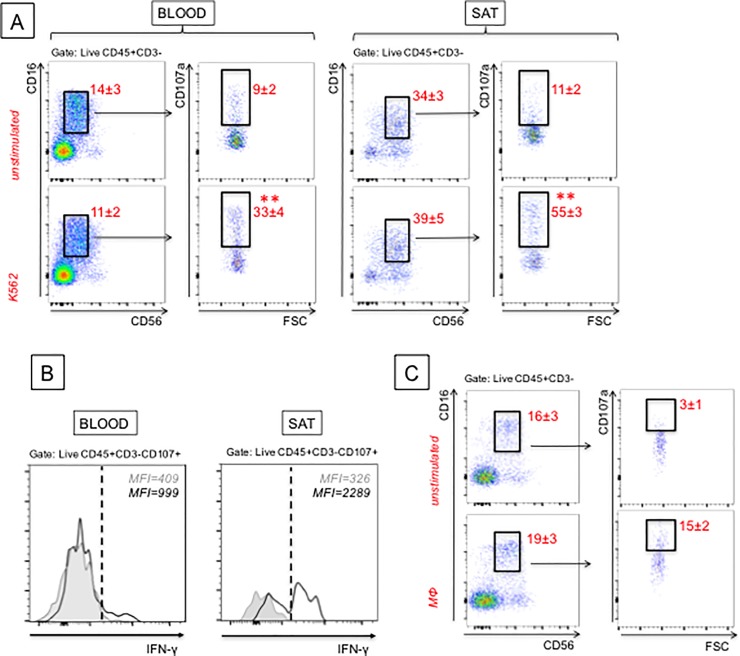
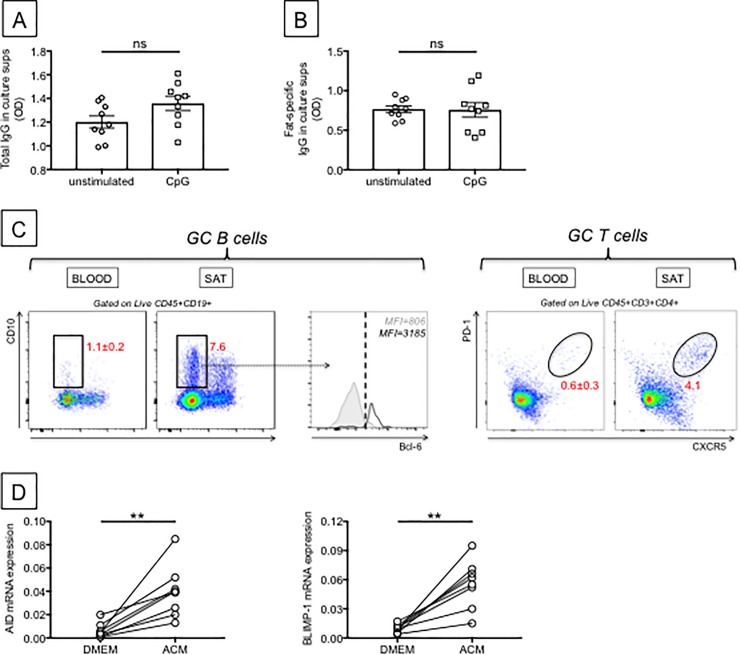
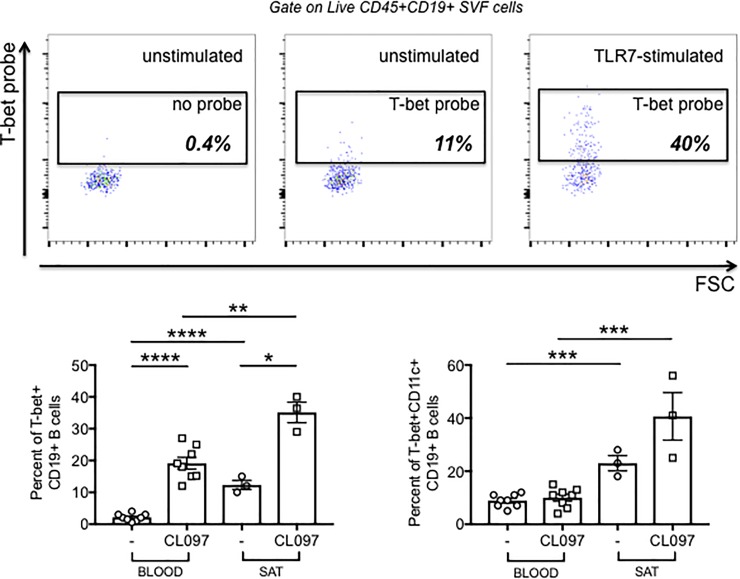
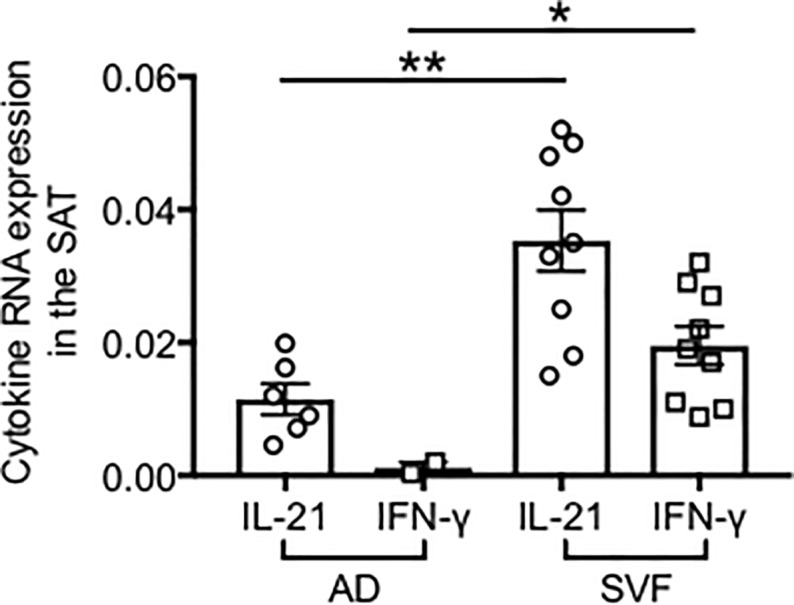
The adipose tissue (AT) contributes to systemic and B cell intrinsic inflammation, reduced B cell responses and secretion of autoimmune antibodies. In this study we show that adipocytes in the human obese subcutaneous AT (SAT) secrete several pro-inflammatory cytokines and chemokines, which contribute to the establishment and maintenance of local and systemic inflammation, and consequent suboptimal immune responses in obese individuals, as we have previously shown. We also show that pro-inflammatory chemokines recruit immune cells expressing the corresponding receptors to the SAT, where they also contribute to local and systemic inflammation, secreting additional pro-inflammatory mediators. Moreover, we show that the SAT generates autoimmune antibodies. During the development of obesity, reduced oxygen and consequent hypoxia and cell death lead to further release of pro-inflammatory cytokines, "self" protein antigens, cell-free DNA and lipids. All these stimulate class switch and the production of autoimmune IgG antibodies which have been described to be pathogenic. In addition to hypoxia, we have measured cell cytotoxicity and DNA damage mechanisms, which may also contribute to the release of "self" antigens in the SAT. All these processes are significantly elevated in the SAT as compared to the blood. We definitively found that fat-specific IgG antibodies are secreted by B cells in the SAT and that B cells express mRNA for the transcription factor T-bet and the membrane marker CD11c, both involved in the production of autoimmune IgG antibodies. Finally, the SAT also expresses RNA for cytokines known to promote Germinal Center formation, isotype class switch, and plasma cell differentiation. Our results show novel mechanisms for the generation of autoimmune antibody responses in the human SAT and allow the identification of new pathways to possibly manipulate in order to reduce systemic inflammation and autoantibody production in obese individuals.


Conflict of interest statement

Competing Interests: The authors have declared that no competing interests exist.

Figures

Fig 1
Fig 1. Frequencies of immune cells in the obese SAT versus blood.
The blood and the SVF from the SAT of the same individuals (n = 20, representing all individuals recruited) were stained to evaluate the frequencies of B, T, NK, NKT as well as monocytes and MΦ. Gating strategies and a representative dot plot from one individual are shown. B, T, NK, NKT are gated on the continuous line, whereas monocytes and MΦ are gated on the dotted line. Means±SE are shown in red. Mean comparisons between groups were performed by Student’s t test (two-tailed). **p<0.01, ***p<0.001, ****p<0.0001.
Fig 2
Fig 2. Frequencies of B and T cell subsets in the obese SAT versus blood.
The blood and the SVF from the SAT of the same individuals were stained to measure B (left) and T (right) cell subsets. Gating strategies and a representative dot plot from one individual are shown. Means±SE are shown in red. Mean comparisons between groups were performed by Student’s t test (two-tailed). **p<0.01, ***p<0.001, ****p<0.0001.
Fig 3
Fig 3. RNA expression of chemokines in adipocytes and corresponding chemokine receptors in the obese SAT versus blood.
Top. Adipocytes (AD) were sonicated for cell disruption in the presence of TRIzol to separate the soluble fraction (used for RNA isolation) from lipids and cell debris. Results show qPCR values (2-ΔΔCt) of CXCL10, IL-8, CCL2, CCL5 RNA expression. Bottom. The SVF were resuspended in TRIzol. AD and SVF were from the same obese individuals. PBMC (blood) were from obese individuals age-, gender- and BMI-matched. Results show qPCR values (2-ΔΔCt) of CXCR2, CXCR3, CCR2, CCR3 RNA expression. Mean comparisons between groups were performed by Student’s t test (two-tailed). **p<0.01, ***p<0.001.
Fig 4
Fig 4. RNA expression of pro-inflammatory cytokines in the obese SAT versus blood.
Adipocytes (AD), SVF and PBMC (blood) were sonicated for cell disruption in the presence of TRIzol to separate the soluble fraction (used for RNA isolation) from lipids and cell debris. AD and SVF were from the same obese individuals. PBMC (blood) were from obese individuals age-, gender- and BMI-matched. Results show qPCR values (2-ΔΔCt) of TNF-α and IL-6 RNA expression.
Fig 5
Fig 5. Measure of lipolysis in the obese SAT versus blood.
A. Adipocytes (AD), SVF and PBMC (blood) were sonicated for cell disruption in the presence of TRIzol to separate the soluble fraction (used for RNA isolation) from lipids and cell debris. AD and SVF were from the same obese individuals. PBMC (blood) were from obese individuals age-, gender- and BMI-matched. Results show qPCR values (2-ΔΔCt) of LPL RNA expression. B. Total protein lysates of adipocytes (AD) and SVF (from different obese individuals age-, gender- and BMI-matched) were prepared and run in WB to measure phospho-HSL. A representative WB for the higest and lowest values is shown (top). Mean comparisons between groups were performed by Student’s t test (two-tailed). ***p<0.001. C. Total protein lysates of adipocytes (AD) and SVF (same as in B) were prepared and run in WB to measure phospho-H2AX. Total protein lysates of PBMC (blood) from different obese individuals age-, gender- and BMI-matched, were also prepared and run in WB. A representative WB is shown (top). Mean comparisons between groups were performed by Student’s t test (two-tailed). ****p<0.0001.
Fig 6
Fig 6. Measure of hypoxia in the obese SAT versus blood.
A. Hypoxia was measured by RNA expression of HIF-1α in adipocytes (AD) and SVF from the same individuals. AD were sonicated for cell disruption in the presence of TRIzol. The SVF was also resuspended in TRIzol. AD and SVF were from the same individuals. Results show qPCR values (2-ΔΔCt) of HIF-1α RNA expression. Mean comparisons between groups were performed by Student’s t test (two-tailed). *p<0.05. B. Respiration in the SVF and in PBMC (blood) from different obese individuals age-, gender- and BMI-matched was measured as described in Materials and methods. Numbers in red indicate Oxygen consumption rates (O2 nmoles/ml/min) in the example shown. Results are representative of 2 independent experiments.
Fig 7
Fig 7. NK degranulation is higher in SAT as compared to blood.
A. Cytotoxicity of CD16+CD56dim NK cells from the SVF and PBMC (blood) as control was measured against the leukemic cell target K562. PBMC are from different obese individuals age-, gender- and BMI-matched. Numbers in red are means±SE from 3 independent experiments. The target:NK cell ratio was 1:1. Mean comparisons between groups were performed by Student’s t test (two-tailed). **p<0.01. B. IFN-γ was detected by intracellular staining and flow cytometry, before (grey line, filled histogram) and after (black line, unfilled histogram) stimulation with K562, overnight at 37°C. C. Cytotoxity of CD16+CD56dim NK cells was measured against SAT MΦ. SAT MΦ were enriched from the SVF of the same individuals through plastic adherence for 1 hr at 37°C. Numbers in red are means±SE from 3 independent experiments. The target:NK cell ratio was 1:1.
Fig 8
Fig 8. Autoantibody production in the SAT.
A. Total IgG antibodies were detected by ELISA in supernatants of unstimulated and CpG-stimulated SVF cultures. B. Fat-specific IgG antibodies were detected by ELISA after enrichment in IgG antibodies. ELISA plates were coated with protein lysates from adipocytes from the same individuals. C. Detection of GC B and T cells in the SVF, and in the blood (from the same individuals) as control, was performed by flow cytometry. GC B cells were CD19+CD10+IgD- and also expressed intracellular Bcl-6. Grey line, filled histogram: blood; black line, unfilled histogram: SVF. GC T cells were CD3+CD4+PD-1+CXCR5+. D. Naïve B cells were sorted from the peripheral blood of 8 lean healthy individuals and stimulated in the presence of ACM for 5–8 days to detect mRNA expression of AID and BLIMP-1, respectively. Cells (106/ml of ACM) were stimulated with 5 μg/ml of CpG. Results show qPCR values (2-ΔΔCt) of RNA expression of AID (top) and BLIMP-1 (bottom). Mean comparisons between groups were performed by Student’s t test (two-tailed). **p<0.01.
Fig 9
Fig 9. Expression of T-bet and CD11c in B cells from SAT SVF.
A. Detection of T-bet by Prime Flow. Unstimulated and CL097-stimulated SVF were labeled with Live/Dead detection kit and then with anti-CD19/CD27/IgD antibodies to detect B cells. Negative control was the sample without the labeled probe. Approximately 200,000 cell events were acquired from each sample on the flow cytometer. Top. A representative dot plot is shown. Bottom left. Means±SE from independent experiments, in which unstimulated and stimulated samples from the SVF and from PBMC (blood) of different obese individuals age-, gender- and BMI-matched were analyzed, are plotted. Mean comparisons between groups were performed by Student’s t test (two-tailed). *p<0.05, **p<0.01, ****p<0.0001. Bottom right. Detection of T-bet+CD11c+ B cells. Unstimulated and CL097-stimulated PBMC and SVF were processed as in A, then membrane labeled with anti-CD11c. Mean comparisons between groups were performed by Student’s t test (two-tailed). ***p<0.001.
Fig 10
Fig 10. RNA expression of IFN-γ and IL-21 in the obese SAT.
Adipocytes (AD) were sonicated for cell disruption in the presence of TRIzol. SVF was also resuspended in TRIzol. AD and SVF were from the same individuals. Results show qPCR values (2-ΔΔCt) of IFN-γ and IL-21. Mean comparisons between groups were performed by Student’s t test (two-tailed). **p<0.01, **p<0.01.

References

    1. Apovian CM, Gokce N. Obesity and cardiovascular disease. Circulation. 2012;125(9):1178–82. doi: 10.1161/CIRCULATIONAHA.111.022541 ; PubMed Central PMCID: PMCPMC3693443. - DOI - PMC - PubMed
    1. Hotamisligil GS. Inflammation and metabolic disorders. Nature. 2006;444(7121):860–7. doi: 10.1038/nature05485 . - DOI - PubMed
    1. Johnson AM, Olefsky JM. The origins and drivers of insulin resistance. Cell. 2013;152(4):673–84. doi: 10.1016/j.cell.2013.01.041 . - DOI - PubMed
    1. Shoelson SE, Lee J, Goldfine AB. Inflammation and insulin resistance. J Clin Invest. 2006;116(7):1793–801. doi: 10.1172/JCI29069 ; PubMed Central PMCID: PMCPMC1483173. - DOI - PMC - PubMed
    1. Renehan AG, Tyson M, Egger M, Heller RF, Zwahlen M. Body-mass index and incidence of cancer: a systematic review and meta-analysis of prospective observational studies. Lancet. 2008;371(9612):569–78. doi: 10.1016/S0140-6736(08)60269-X . - DOI - PubMed

Publication types