. 2018 May 16;13(5):e0197074.
doi: 10.1371/journal.pone.0197074. eCollection 2018.

Multi-site evaluation of the LN34 pan-lyssavirus real-time RT-PCR assay for post-mortem rabies diagnostics

Affiliations

Multi-site evaluation of the LN34 pan-lyssavirus real-time RT-PCR assay for post-mortem rabies diagnostics

Crystal M Gigante et al. PLoS One. .

Abstract

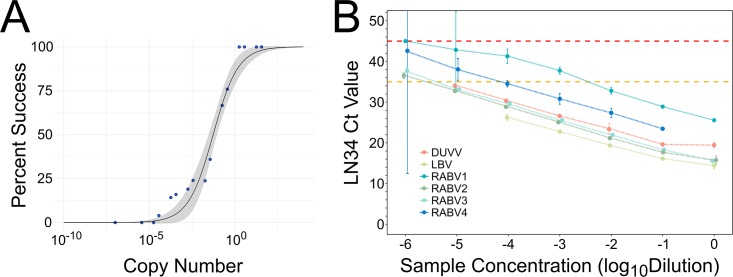
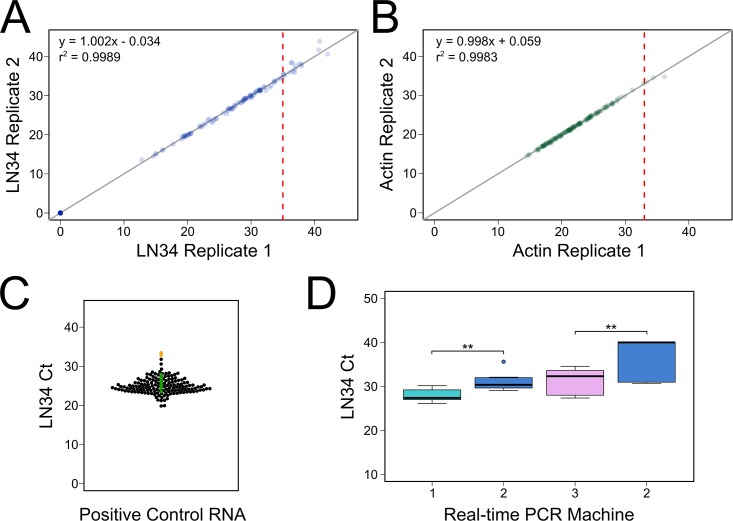
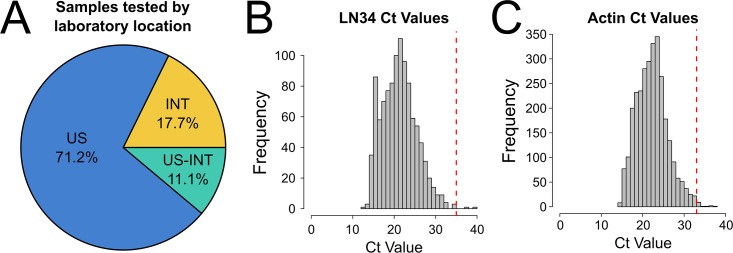
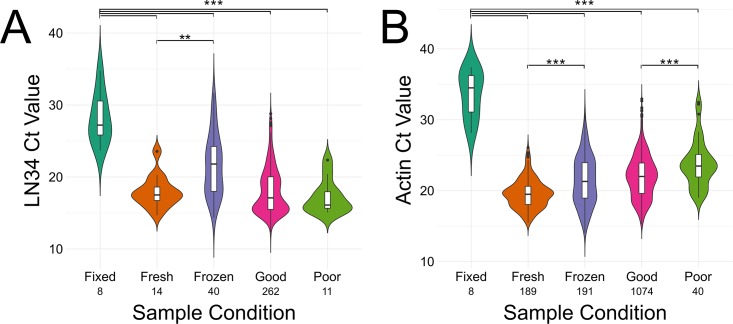
Rabies is a fatal zoonotic disease that requires fast, accurate diagnosis to prevent disease in an exposed individual. The current gold standard for post-mortem diagnosis of human and animal rabies is the direct fluorescent antibody (DFA) test. While the DFA test has proven sensitive and reliable, it requires high quality antibody conjugates, a skilled technician, a fluorescence microscope and diagnostic specimen of sufficient quality. The LN34 pan-lyssavirus real-time RT-PCR assay represents a strong candidate for rabies post-mortem diagnostics due to its ability to detect RNA across the diverse Lyssavirus genus, its high sensitivity, its potential for use with deteriorated tissues, and its simple, easy to implement design. Here, we present data from a multi-site evaluation of the LN34 assay in 14 laboratories. A total of 2,978 samples (1,049 DFA positive) from Africa, the Americas, Asia, Europe, and the Middle East were tested. The LN34 assay exhibited low variability in repeatability and reproducibility studies and was capable of detecting viral RNA in fresh, frozen, archived, deteriorated and formalin-fixed brain tissue. The LN34 assay displayed high diagnostic specificity (99.68%) and sensitivity (99.90%) when compared to the DFA test, and no DFA positive samples were negative by the LN34 assay. The LN34 assay produced definitive findings for 80 samples that were inconclusive or untestable by DFA; 29 were positive. Five samples were inconclusive by the LN34 assay, and only one sample was inconclusive by both tests. Furthermore, use of the LN34 assay led to the identification of one false negative and 11 false positive DFA results. Together, these results demonstrate the reliability and robustness of the LN34 assay and support a role for the LN34 assay in improving rabies diagnostics and surveillance.


Conflict of interest statement

Competing Interests: The authors have declared that no competing interests exist.

Figures

Fig 1
Fig 1. Analytical sensitivity of the LN34 assay.
A. Result of limit of detection analysis using serial dilutions of artificial positive control RNA. Estimated RNA copy number was plotted against the percent of runs in which amplification was observed (blue dots). A sigmoidal curve was fit to the data to estimate the limit of detection as the RNA copy number corresponding to 95% assay success (black line, gray shading indicates 95% confidence interval). B. LN34 assay Ct value upon 10 fold serial dilutions of RNA extracted from six lyssavirus isolates. Average Ct value and 95% confidence intervals are shown; several points are artificially offset along the x axis to avoid overlap. Linear regression analysis revealed the following slopes: DUVV -3.58, LBV -3.37, RABV1–3.64, RABV2–3.84, RABV3–3.66, RABV4–3.56. LN34 assay diagnostic cut-off for positive samples (Ct 35) is highlighted in yellow. Assay failure (Ct 45) is shown in red.
Fig 2
Fig 2. LN34 assay repeatability and reproducibility.
A–B. Comparison of replicate Ct values for the same RNA sample tested in the same assay run for LN34 (A) and β-actin (B) assays. Ct value for replicate 1 is plotted against replicate 2. Gray line indicates identity (y = x). Results of linear regression analysis is shown in the upper left corner. Vertical red lines indicate the diagnostic cut-off values for positive samples for each assay. Points are transparent; darker color indicates overlapping points. Samples that failed to amplify are plotted at Ct 0. C. LN34 Ct values reported for positive control RNA tested in 12 laboratories shown as a beeswarm plot. Each dot represents the average value for one assay run; points are plotted according to Ct value (y-axis), then offset along the x-axis to show the distribution of points at each Ct value. Orange dots indicate Ct values observed in one laboratory using a PCR machine with decreased sensitivity, and green dots indicate Ct values reported from the same laboratory using a different PCR machine. D. Comparison of LN34 Ct value for a panel of 14 samples tested in three real-time PCR machines. Machine 2 was determined to produce significantly higher Ct values than either Machine 1 or 3, for the same sample. Boxplots show median (thick line) and 25th and 75th quartiles. Whiskers extend to 1.5×(inter-quartile range); data outside whiskers are plotted individually. ** p < 0.01.
Fig 3
Fig 3. A multi-laboratory international evaluation of the LN34 assay.
A. Proportion of samples originating and tested in the United States (US), originating and tested outside the U.S. (INT), or originating outside the U.S. and tested in the U.S. (US-INT). B. Frequency of LN34 Ct values for DFA positive samples. C. Frequency of β-actin Ct values for all 2,978 samples tested. Diagnostic cut-off values for positive samples (Ct 35 for LN34 and Ct 33 for β-actin) are highlighted by red vertical lines.
Fig 4
Fig 4. LN34 assay performance in different samples types.
Violin plots showing LN34 (A) and β-actin (B) Ct values observed for brain samples of varying reported sample conditions. Overlaid boxplots show median (thick line), 25th and 75th quartiles. Whiskers indicate 1.5×(inter-quartile range). Data points beyond the whiskers are plotted individually. Data are only shown for samples that exhibited amplification. The number of samples for each condition is indicated under the sample condition. ** p <0.01, *** p < 0.001.

References

    1. Petersen BW, Rupprecht CE (2011) Human rabies epidemiology and diagnosis In: T S., editor. Non-Flavivirus encephalitis: INTECH Open Access Publisher; doi: 10.5772/21708 - DOI
    1. World Health Organization (2013) WHO Expert Consultation on Rabies: second report. World Health Organization. http://www.who.int/iris/handle/10665/85346 - PubMed
    1. Fooks AR, Cliquet F, Finke S, Freuling C, Hemachudha T, et al. (2017) Rabies. Nat Rev Dis Primers 3: 17091 doi: 10.1038/nrdp.2017.91 - DOI - PubMed
    1. World Organization for Animal Health (OIE) (2017) Rabies (infection with rabies virus) In: Manual of diagnostic tests and vaccines for terrestrial animals. http://www.oie.int/en/international-standard-setting/terrestrial-manual/...
    1. Picard-Meyer E, Barrat J, Cliquet F (2007) Use of filter paper (FTA) technology for sampling, recovery and molecular characterisation of rabies viruses. J Virol Methods 140: 174–182. doi: 10.1016/j.jviromet.2006.11.011 - DOI - PubMed

Publication types