doi: 10.4097/kja.d.18.00067.
Epub 2018 May 17.
Survival analysis: Part I - analysis of time-to-event
Affiliations
- PMID: 29768911
- PMCID: PMC5995015
- DOI: 10.4097/kja.d.18.00067
Item in Clipboard
Survival analysis: Part I - analysis of time-to-event
Korean J Anesthesiol.
2018 Jun.
Erratum in
-
Survival analysis: Part I - analysis of time-to-event.Korean J Anesthesiol. 2023 Feb;76(1):83. doi: 10.4097/kja.d.18.00067.e1. Epub 2023 Jan 4. Korean J Anesthesiol. 2023. PMID: 36597017 Free PMC article. No abstract available.
Abstract
Length of time is a variable often encountered during data analysis. Survival analysis provides simple, intuitive results concerning time-to-event for events of interest, which are not confined to death. This review introduces methods of analyzing time-to-event. The Kaplan-Meier survival analysis, log-rank test, and Cox proportional hazards regression modeling method are described with examples of hypothetical data.
Keywords: Censored data; Cox regression; Hazard ratio; Kaplan-Meier method; Log-rank test; Medical statistics; Power analysis; Proportional hazards; Sample size; Survival analysis.
Figures
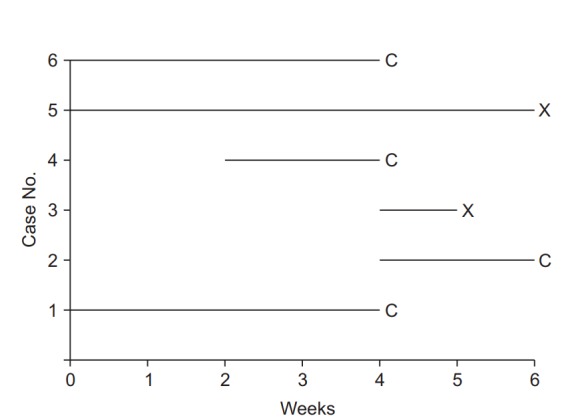
Illustration of survival analysis data from an imaginary experiment with a 6-week study period. Cases 3 and 5 experienced the event and are coded as “event cases”, denoted “X”. Their follow-up periods were 6 and 1 weeks, respectively. The others are all “censored cases,” denoted “C.” Patient 1 participated in the study from the start, but the follow-up was terminated due to unexpected death from an irrelevant cause. Patient 2 participated in the study from 4 to 6 weeks, but then refused to participate further. Case 4 was enrolled in the study in the 2nd week, lost contact in the 4th week, and was considered lost to follow-up. Case 6 was excluded in the 4th week because of uncovered random allocation.
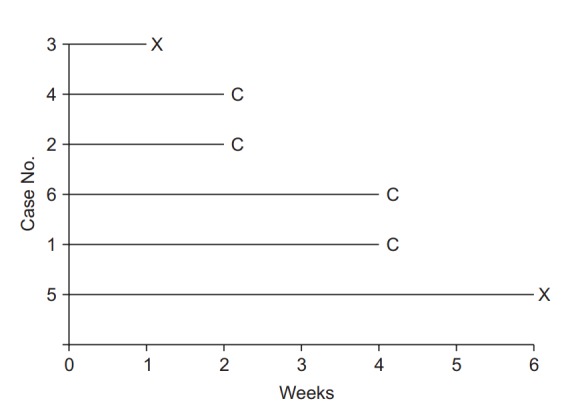
Data arranged for Kaplan-Meier analysis. Note that for all participants the observations are rearranged to start at zero. Events are denoted “X,” and censored data are denoted “C.”
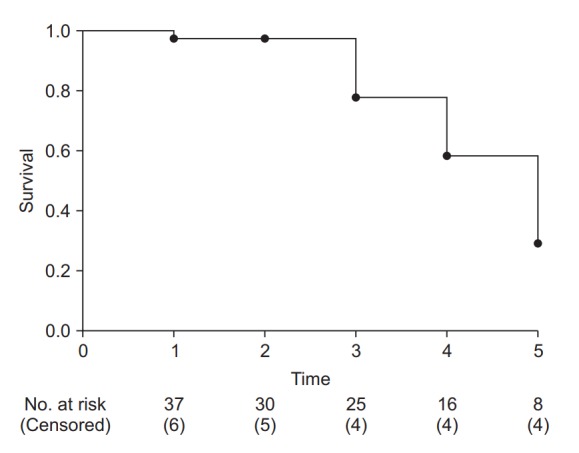
Example of a Kaplan-Meier survival curve. The axes represent time (x-axis) and survival rate (y-axis). At every time point of event occurrence, the survival curve steps down to the next lower level. Black dots represent points of censored data. At the bottom of the graph, the number of risk and censored cases are presented. It is recommended that specify these numbers with adequate time interval to clarify the clinical meanings.
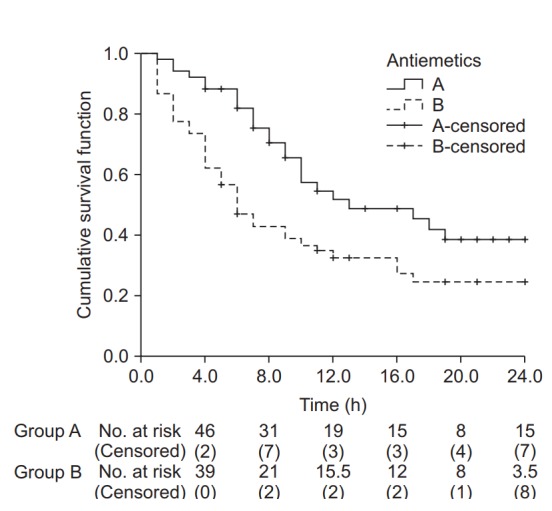
Kaplan-Meier curves for groups A and B. The median survival time (postoperative nausea and vomiting-free time) for group A was 13.0 h (Q1, Q3: 8.0, 24.0 h), and for group B 6.0 h (Q1, Q3: 3.0, 17.0 h). The median survival time was significantly longer in group A than in group B (log-rank test, χ2 (1) = 6.802, P = 0.009). Black crosses indicate censored data.
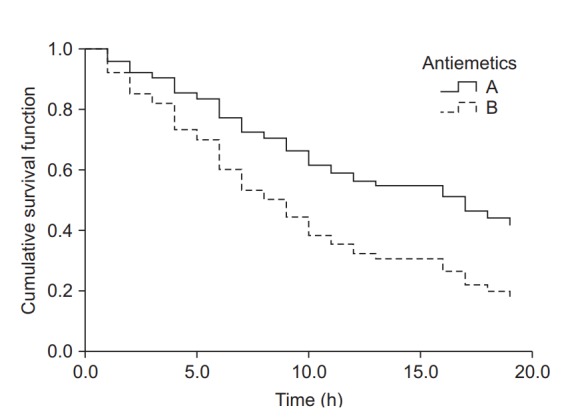
Cumulative survival curves of groups A and B estimated using the Cox proportional hazards regression model. The survival curve of group B decreases considerably compared to that of group A as time passes. The hazard ratio for antiemetics was estimated as 2.0 (95% CI: 1.2–3.3, P = 0.009). Group B showed a 2-fold greater hazard of postoperative nausea and vomiting (PONV) compared to group A. Intraoperative fentanyl increased the PONV risk about 4.7-fold (95% CI: 2.8–8.1, P < 0.001) compared to non-use.
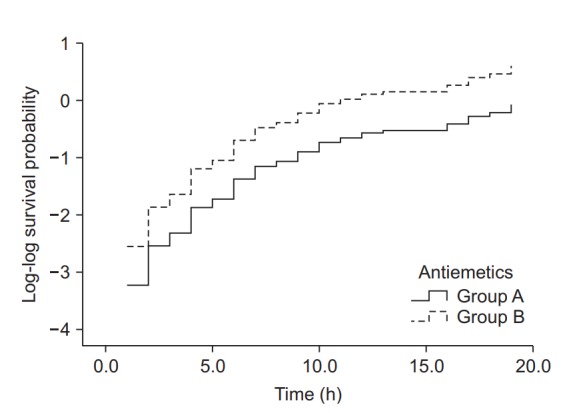
Log-log function curves for the antiemetic comparison experiment. The Y-axis represents the log-log transformed survival function estimated using the Cox proportional hazards regression model. The basic assumption of Cox proportional hazards regression modeling, a constant hazard ratio over the time (the proportional hazards assumption), can be checked using this plot for only one covariate, the antiemetic. The two curves do not cross over in the early period of observation and remain parallel after that. This plot suggests that this model does not violate the proportional hazards assumption (Created with: IBM® SPSS® Statistics ver. 23 [IBM Corp., USA]).
Similar articles
-
Biostatistics Series Module 9: Survival Analysis.Indian J Dermatol. 2017 May-Jun;62(3):251-257. doi: 10.4103/ijd.IJD_201_17. Indian J Dermatol. 2017. PMID: 28584366 Free PMC article.
-
Survival analysis: A primer for the clinician scientists.Indian J Gastroenterol. 2021 Oct;40(5):541-549. doi: 10.1007/s12664-021-01232-1. Epub 2022 Jan 10. Indian J Gastroenterol. 2021. PMID: 35006489 Free PMC article.
-
Are non-constant rates and non-proportional treatment effects accounted for in the design and analysis of randomised controlled trials? A review of current practice.BMC Med Res Methodol. 2019 May 16;19(1):103. doi: 10.1186/s12874-019-0749-1. BMC Med Res Methodol. 2019. PMID: 31096924 Free PMC article. Review.
-
Empirical power comparison of statistical tests in contemporary phase III randomized controlled trials with time-to-event outcomes in oncology.Clin Trials. 2020 Dec;17(6):597-606. doi: 10.1177/1740774520940256. Epub 2020 Sep 15. Clin Trials. 2020. PMID: 32933339
-
Survival Analyses: A Statistical Review for Surgeons.Semin Thorac Cardiovasc Surg. 2022 Winter;34(4):1388-1394. doi: 10.1053/j.semtcvs.2022.01.001. Epub 2022 Jan 31. Semin Thorac Cardiovasc Surg. 2022. PMID: 35092846 Review.
Cited by
-
Prevalence of covid-19 among patients with chronic obstructive pulmonary disease and tuberculosis.Ann Med. 2023 Dec;55(1):285-291. doi: 10.1080/07853890.2022.2160491. Ann Med. 2023. PMID: 36594409 Free PMC article.
-
Survival analysis: part II - applied clinical data analysis.Korean J Anesthesiol. 2019 Oct;72(5):441-457. doi: 10.4097/kja.19183. Epub 2019 May 17. Korean J Anesthesiol. 2019. PMID: 31096731 Free PMC article. Review.
-
The principles of presenting statistical results using figures.Korean J Anesthesiol. 2022 Apr;75(2):139-150. doi: 10.4097/kja.21508. Epub 2022 Mar 3. Korean J Anesthesiol. 2022. PMID: 35016496 Free PMC article.
-
Decongestion Models and Metrics in Acute Heart Failure: ESCAPE Data in the Age of the Implantable Cardiac Pressure Monitor.Tex Heart Inst J. 2022 Jul 1;49(4):e217587. doi: 10.14503/THIJ-21-7587. Tex Heart Inst J. 2022. PMID: 36001949 Free PMC article.
-
Methods to Analyze Time-to-Event Data: The Cox Regression Analysis.Oxid Med Cell Longev. 2021 Nov 30;2021:1302811. doi: 10.1155/2021/1302811. eCollection 2021. Oxid Med Cell Longev. 2021. PMID: 34887996 Free PMC article.
References
-
- Kleinbaum DG, Klein M. Survival Analysis. A Self-Learnin Text. 2nd ed. New York: Springer Science+Business Median, Inc; 2005. pp. 4–5.
-
- Hancock MJ, Maher CG, Costa Lda C, Williams CM. A guide to survival analysis for manual therapy clinicians and researchers. Man Ther. 2014;19:511–6. - PubMed
LinkOut - more resources
Full Text Sources
Other Literature Sources