. 2019 Jan 1;36(1):25-42.
doi: 10.1089/neu.2017.5579. Epub 2018 Jul 25.

Brain Phospholipid Precursors Administered Post-Injury Reduce Tissue Damage and Improve Neurological Outcome in Experimental Traumatic Brain Injury

Affiliations

Brain Phospholipid Precursors Administered Post-Injury Reduce Tissue Damage and Improve Neurological Outcome in Experimental Traumatic Brain Injury

Orli Thau-Zuchman et al. J Neurotrauma. .

Abstract

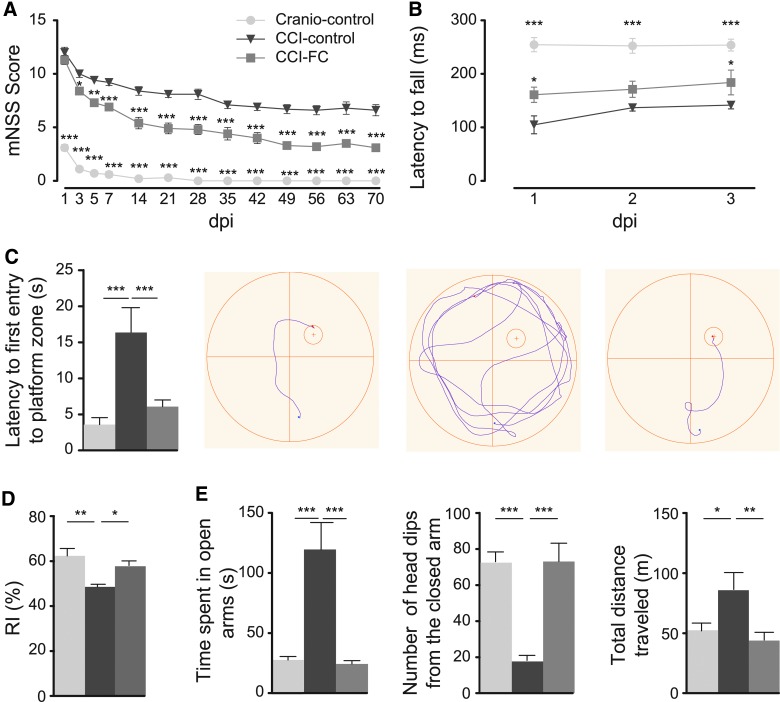
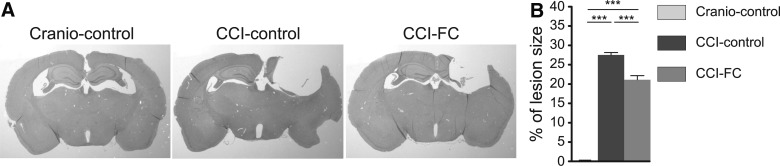
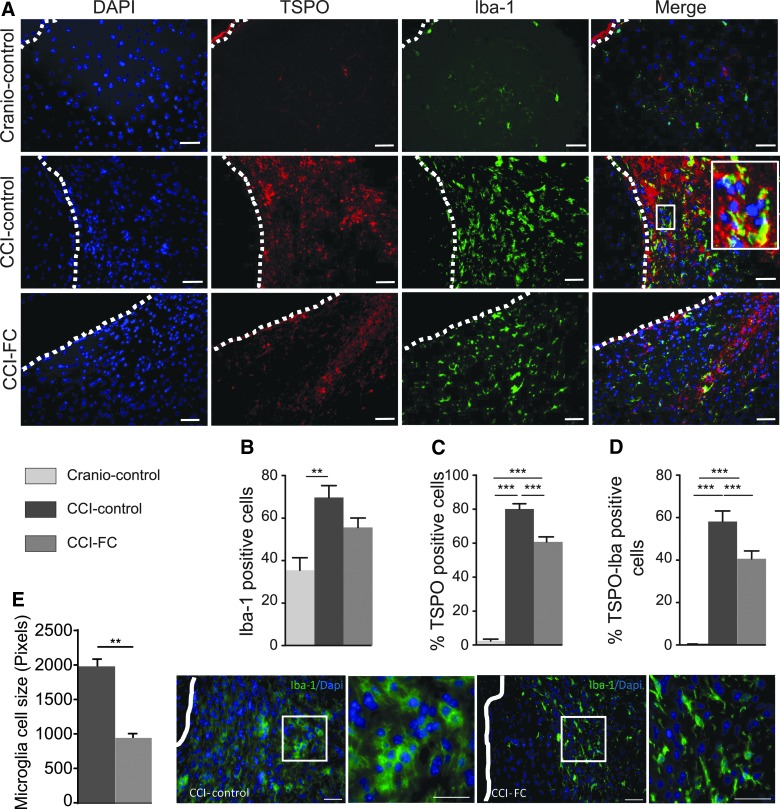
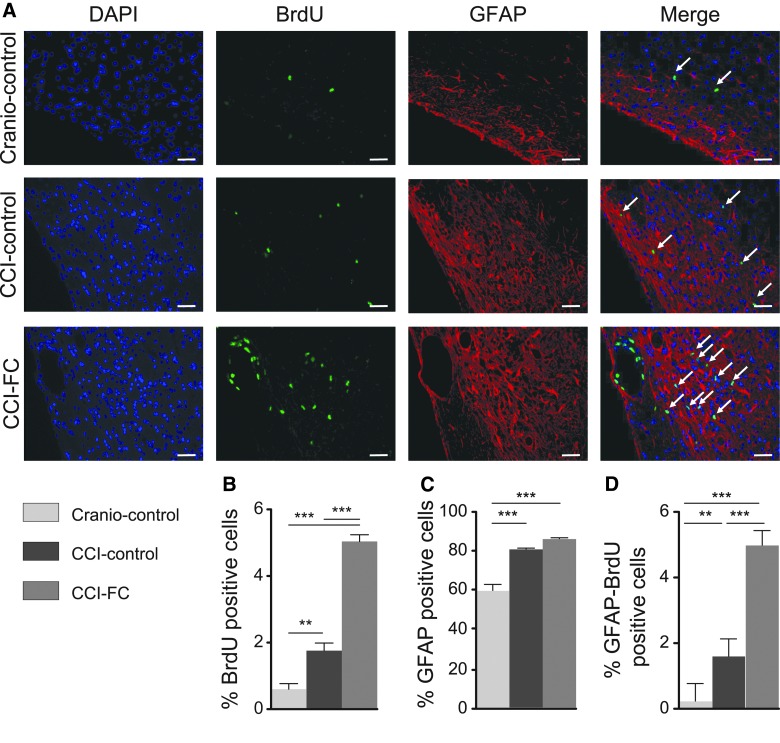
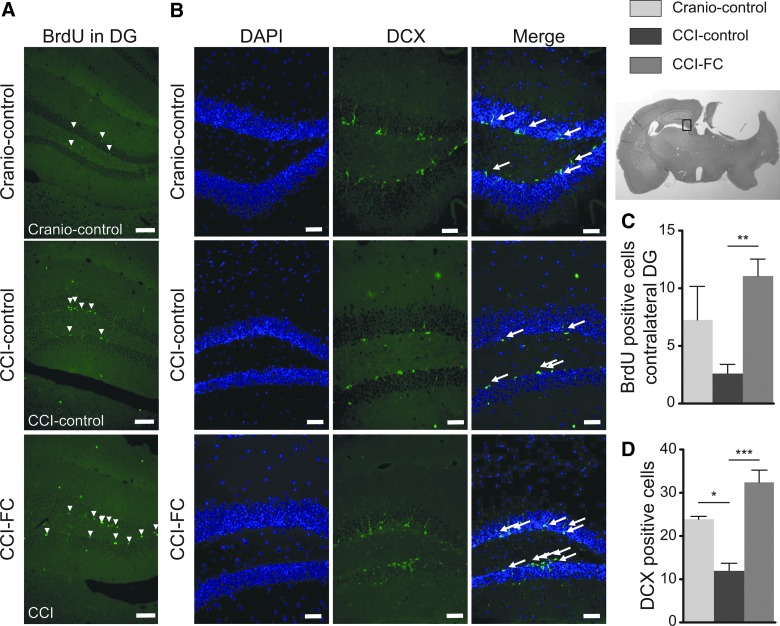
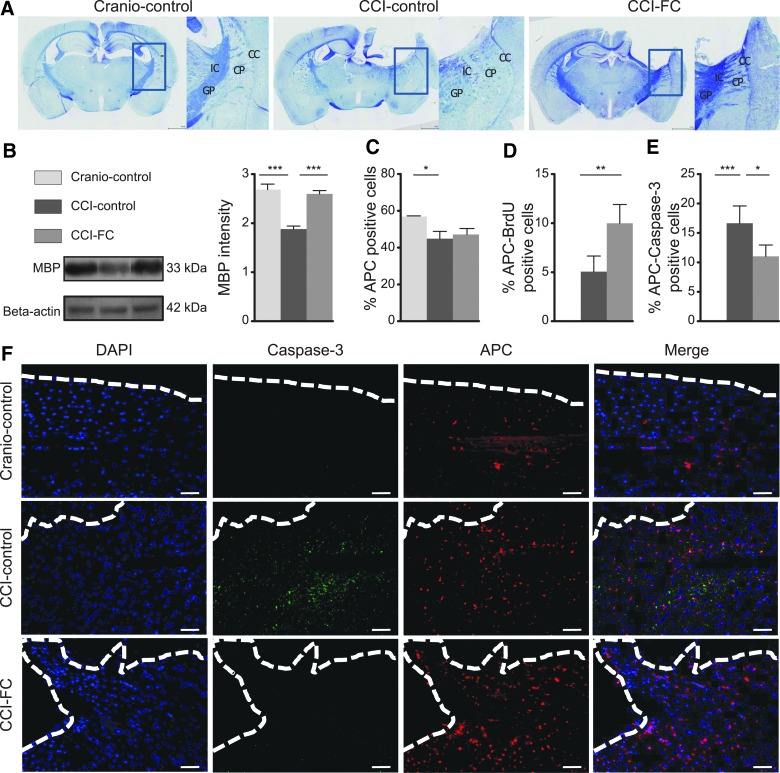
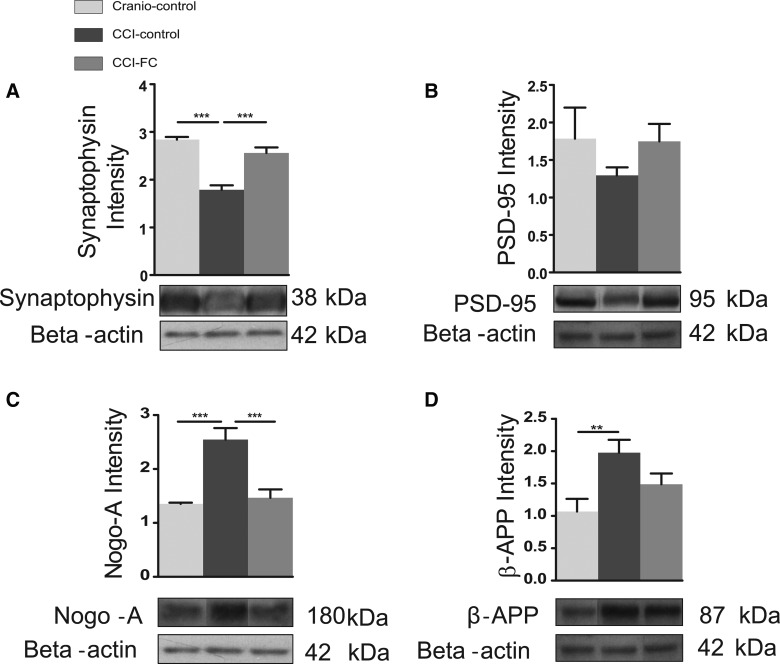
Traumatic brain injury (TBI) leads to cellular loss, destabilization of membranes, disruption of synapses and altered brain connectivity, and increased risk of neurodegenerative disease. A significant and long-lasting decrease in phospholipids (PLs), essential membrane constituents, has recently been reported in plasma and brain tissue, in human and experimental TBI. We hypothesized that supporting PL synthesis post-injury could improve outcome post-TBI. We tested this hypothesis using a multi-nutrient combination designed to support the biosynthesis of PLs and available for clinical use. The multi-nutrient, Fortasyn® Connect (FC), contains polyunsaturated omega-3 fatty acids, choline, uridine, vitamins, cofactors required for PL biosynthesis, and has been shown to have significant beneficial effects in early Alzheimer's disease. Male C57BL/6 mice received a controlled cortical impact injury and then were fed a control diet or a diet enriched with FC for 70 days. FC led to a significantly improved sensorimotor outcome and cognition, reduced lesion size and oligodendrocyte loss, and it restored myelin. It reversed the loss of the synaptic protein synaptophysin and decreased levels of the axon growth inhibitor, Nogo-A, thus creating a permissive environment. It decreased microglia activation and the rise in ß-amyloid precursor protein and restored the depressed neurogenesis. The effects of this medical multi-nutrient suggest that support of PL biosynthesis post-TBI, a new treatment paradigm, has significant therapeutic potential in this neurological condition for which there is no satisfactory treatment. The multi-nutrient tested has been used in dementia patients and is safe and well tolerated, which would enable rapid clinical exploration in TBI.

Keywords: brain phospholipids; functional improvement; medical multi-nutrient; neuroplasticity; neuroprotection; traumatic brain injury.


Conflict of interest statement

No competing financial interests exist.

Figures

<b>FIG. 1.</b>
FIG. 1.
Experimental design. Behavioral testing was performed for 70 days post-injury (dpi). A controlled cortical impact (CCI) or a control craniotomy (sham injury) were induced in adult male mice. Animals were divided into three experimental groups (craniotomy-control, CCI-Control, and CCI-FC). All mice were tested for motor and cognitive impairments on all behavioral tests. Mice were trained for 3 consecutive days for the Rotarod test pre-injury. Throughout the study (1–70 dpi), mice were tested for mNSS every other day on the first week and once a week thereafter, Rotarod (1–3 dpi), CatWalk (2 dpi), MWM (13–18 dpi), novel object recognition (NOR; 22–26 dpi), and elevated zero maze (EZM; 45 dpi). A week before the end of the study mice were injected twice a day with BrdU. Mice were monitored daily for weight and food consumption. On 70 dpi, mice underwent perfusion for immunohistochemistry (IHC) analysis or were decapitated and brains were quickly removed and snap frozen for western blot (WB) analysis. Seventy-day plasma and cerebellar tissue samples were used for lipid analysis. BrdU, bromodeoxyuridine; FC, Fortasyn® Connect; MWM, Morris water maze; mNSS, Modified Neurological Severity Score; TBI, traumatic brain injury.
<b>FIG. 2.</b>
FIG. 2.
Integrated neurological function and motor assessments. mNSS (A) and Rotarod (B). (A) From 5 dpi and thereafter, CCI-FC animals showed a significant improvement compared to the CCI-control group (two-way ANOVA, p < 0.0001; F(2,27) = 320.8; Bonferroni's post-hoc test, **p < 0.01; ***p < 0.001); the craniotomy-control group showed significant improvement from 1 dpi and nearly no deficits after 14 dpi (***p < .001 compared to CCI-control). (B) On 1 and 3 dpi, CCI-FC and craniotomy-control mice showed marked improvement compared to CCI-control mice (one-way ANOVA, p < 0.0001; F(2,26) = 42.31; Bonferroni's post-hoc test, *p < 0.05; ***p < 0.001, respectively). Data are means ± SEM of 10 animals/group. Cognitive performance assessments. MWM (C) and NOR (D). (C) A significant reduction in latency to the first entry to the platform-quadrant was observed in CCI-FC and craniotomy control animals in the probe test (one-way ANOVA, p = 0.0005; F(2,27) = 10.17; Bonferroni's post-hoc test, **p < 0.01; ***p < 0.001, respectively) compared to CCI-control animals. Underneath, an illustration of the track of an animal, from release into the water until it first entered the platform quadrant. (D) A significant increase in the time spent exploring a novel object, compared to the familiar one, was observed in both CCI-FC and craniotomy control mice compared to CCI-control mice (one-way ANOVA, p < 0.003; F(3,36) = 5.596; Bonferroni's post-hoc test, *p < 0.05; **p < 0.01, respectively). Results expressed as the recognition index (RI) %: the time spent investigating the novel object relative to the total time of object investigation. Data are means ± SEM of 10 animals per group. Anxiety assessment. Elevated zero maze (EZM; E). CCI-FC and craniotomy-control mice showed limited exploration of the unfamiliar environment, shown by i) reduced preference for open zones, as reflected in total time spent in the open zone (one-way ANOVA, p = 0.0004; F(2,12) = 16.52; Bonferroni's post-hoc test, ***p < 0.001) compared to CCI-control animals; ii) a lower number of head dips (one-way ANOVA, p = 0.0001; F(2,12) = 21.92; Bonferroni's post-hoc test, ***p < 0.001); and iii) a reduced total distance traveled during the 5-min trial (one-way ANOVA, p = 0.0068; F(2,12) = 7.799; Bonferroni's post-hoc test, **p < 0.01; *p < 0.05, respectively). Data are means ± SEM of 10 animals/group. ANOVA, analysis of variance; CCI, controlled cortical impact; dpi, days post-injury; FC, Fortasyn® Connect; MWM, Morris water maze; mNSS, Modified Neurological Severity Score; NOR, novel object recognition; SEM, standard error of the mean.
<b>FIG. 3.</b>
FIG. 3.
Lesion size (A and B). (A) Sections stained with H&E showing differences in lesion size. (B) Graph showing a significant reduction in lesion size in CCI-FC mice compared to CCI-control versus craniotomy-control mice, at 70 days post-TBI (one-way ANOVA, p < 0.0001; F(2,33) = 382.5; Bonferroni's post-hoc test, ***p < 0.001). Data are means ± SEM of 5 animals/group. Data are means ± SEM of 5 animals/group. ANOVA, analysis of variance; CCI, controlled cortical impact; dpi, days post-injury; FC, Fortasyn® Connect; H&E, hematoxylin and eosin; SEM, standard error of the mean; TBI, traumatic brain injury.
<b>FIG. 4.</b>
FIG. 4.
Neuroinflammatory response. (A) Images of DAPI, TSPO, Iba-1, and double-labeled TSPO/Iba-1 cells. Note the different microglia morphology (activation): amoeboid versus ramified. Scale bars = 100 μm. To show colocalization, we enlarged the area marked with a rectangle. Scale bars = 100 μm. Immunohistochemistry quantification, around the lesion border, of (B) %Iba-1–positive cells (one-way ANOVA, p = 0.0032; F(2,11) = 10.1; Bonferroni's post-hoc test, **p < 0.01), (C) %TSPO-positive cells (one-way ANOVA, p < 0.0001; F(2,11) = 273.7; Bonferroni's post-hoc test, ***p < 0.001), and (D) colocalized TSPO- and Iba-1–positive cells (one-way ANOVA, p < 0.0001; F(2,11) = 77.97; Bonferroni's post-hoc test, ***p < 0.001). (E) Microglia cell-size analysis (Mann-Whitney U test, **p = 0.0079) and corresponding images, showing the differences in cell size. Insets show the clear morphological differences. Scale bars = 100 μm. Data are means ± SEM of 5 animals/group. ANOVA, analysis of variance; CCI, controlled cortical impact; DAPI, 4’,6-diamidino-2-phenylindole; FC, Fortasyn® Connect; Iba-1, ionized calcium binding adaptor molecule 1; SEM, standard error of the mean; TSPO, translocator protein.
<b>FIG. 5.</b>
FIG. 5.
Astrocyte response post-injury. (A) Images of DAPI, BrdU, GFAP, and double-labeled GFAP/BrdU cells. Arrows show colocalization. Scale bars = 100 μm. Immunohistochemistry quantification, around the lesion border, of (B) %BrdU-positive cells (one-way ANOVA, p < 0.0001; F(2,12) = 131.5; Bonferroni's post-hoc test, **p < 0.01; ***p < 0.001). (C) %GFAP-positive cells (one-way ANOVA, p < 0.0001; F(2,12) = 40.37; Bonferroni's post-hoc test, ***p < 0.0001) and (D) colocalised %GFAP- and BrdU-positive cells (one-way ANOVA, p < 0.0001; F(2,12) = 119.4; Bonferroni's post-hoc test, ***p < 0.0001). Data are means ± SEM of 5 animals per group. ANOVA, analysis of variance; BrdU, bromodeoxyuridine; CCI, controlled cortical impact; DAPI, 4’,6-diamidino-2-phenylindole; FC, Fortasyn® Connect; GFAP, glial fibrillary acidic protein; SEM, standard error of the mean.
<b>FIG. 6.</b>
FIG. 6.
Cell proliferation and neurogenesis. (A) Images of BrdU in the contralateral dentate gyrus (DG). Scale bars = 25μm. (C) Immunohistochemistry quantification of BrdU-positive cells in the contralateral DG (one-way ANOVA, p = 0.0098; F(2,9) = 8.069; Bonferroni's post-hoc test, **p < 0.01). Data are means ± SEM of 5 animals/group. Number of positive doublecortin (DCX) cells in the contralateral DG. (B) Images of DCX in the contralateral DG. Scale bars = 25μm. (D) Quantification of DCX-positive cells in the contralateral DG (one-way ANOVA, p = 0.0009; F(2,6) = 27.64; Bonferroni's post-hoc test, *p < 0.05; ***p < 0.001). Data are means ± SEM of 5 animals/group. ANOVA, analysis of variance; BrdU, bromodeoxyuridine; CCI, controlled cortical impact; DAPI, 4’,6-diamidino-2-phenylindole; FC, Fortasyn® Connect; SEM, standard error of the mean.
<b>FIG. 7.</b>
FIG. 7.
Myelin. (A) Coronal brain sections stained with Luxol fast blue (LFB). Note differences in the internal capsule (IC), globus pallidus (GP)-external segment, caudate-putamen (CP), and corpus callosum (CC) regions (areas marked with rectangles and enlarged). In the CCI-FC and craniotomy control groups, myelin-stained tracts look continuous, in contrast with a dotted pattern seen in the CCI-control group, both ipsilateral and contralateral to the injury site. (B) Myelin basic protein (MBP) levels by western blot. MBP 20kDa was significantly increased in the CCI-FC and craniotomy-control groups (one-way ANOVA, p < 0.0001; F(2,12) = 27.81; Bonferroni's post-hoc test, ***p < 0.001) compared to CCI-control mice. Oligodendrocytes. (C) Quantification of oligodendrocytes (%APC-positive cells; one-way ANOVA, p = 0.0417; F(2,9) = 4.619; Bonferroni's post-hoc test, *p < 0.05). (D) Dual-staining APC and BrdU (one-way ANOVA, p = 0.0028; F(2,9) = 12.09; Bonferroni's post-hoc test, **P < 0.01). (E) Dual-staining APC with caspase-3 (one-way ANOVA, p = 0.0009; F(2,9) = 16.9; Bonferroni's post-hoc test, *p < 0.05; ***p < 0.001) and (F) images of oligodendrocytes, caspase-3, and DAPI around the lesion border. Scale bar = 100 μm. Data are means ± SEM of 5 animals/group. ANOVA, analysis of variance; APC, adenomatous polyposis coli; BrdU, bromodeoxyuridine; CCI, controlled cortical impact; DAPI, 4’,6-diamidino-2-phenylindole; FC, Fortasyn® Connect; SEM, standard error of the mean.
<b>FIG. 8.</b>
FIG. 8.
Synaptic markers. Graph and cropped gels of western blot analysis of protein levels of (A) synaptophysin; 38 kDa (one-way ANOVA, p < 0.0001; F(2,12) = 35.5; Bonferroni's post-hoc test, ***p < 0.001) and (B) PSD-95; 95kDa (one-way ANOVA, p = 0.4188; F(2,12) = 0.9365; Bonferroni's post-hoc test, #p < 0.06) were analyzed by western blot. Data are means ± SEM of 5 animals/group. Neurite outgrowth inhibitor and amyloid load. (C) Graph and cropped gels of western blot analysis of protein levels of Nogo-A; 180 kD (one-way ANOVA, p = 0.0002; F(2,12) = 18.68; Bonferroni's post-hoc test, ***p < 0.001) and (D) β-APP; 87 kDa (one-way ANOVA, p = 0.0163; F(2,12) = 5.915; Bonferroni's post-hoc test, **p < 0.01) were analyzed in both the CCI-FC and craniotomy control mice compared to CCI-control mice. Data are mean ± SEM of 5 animals/group. β-actin was used as loading control. ANOVA, analysis of variance; β-APP, beta-amyloid precursor protein; CCI, controlled cortical impact; FC, Fortasyn® Connect; PSD-95, post-synaptic density 95; SEM, standard error of the mean.
<b>FIG. 9.</b>
FIG. 9.
Phospholipid fatty acid composition in plasma and tissue phospholipids. In plasma (A), a significant reduction in AA and increases in EPA and DHA in CCI-FC mice compared to CCI-control and craniotomy-control at 70 days post-TBI (one-way ANOVA, p < 0.0001; F(2,93) = 20.45; Bonferroni's post-hoc test, ***p < 0.001). Data are means ± SEM of 5 animals/group. In cerebellum (B), a reduction in tissue PC levels by 20% in injured animals on the control diet versus craniotomy controls, reduced to 11% in the FC supplementation group compared to craniotomy controls (one-way ANOVA, p < 0.0001; F(2, 3) = 26.99; Bonferroni's post-hoc test, ***p < 0.001). Data are means ± SEM of 5 animals/group. PE levels decreased by 21% in the injured animals on the control diet versus craniotomy-only, whereas after FC supplementation the difference versus craniotomy controls was only 8% (one-way ANOVA, p < 0.0001; F(2, 3) = 20.82; Bonferroni's post-hoc test, ***p < 0.001). Data are means ± SEM of 5 animals/group. AA, arachidonic acid; ANOVA, analysis of variance; CCI, controlled cortical impact; DHA, docosahexaenoic acid; EPA, eicosapentaenoic acid; FC, Fortasyn® Connect; PC, phosphatidylcholine; PE, phosphatidylethanolamine; SEM, standard error of the mean; TBI, traumatic brain injury.

References

    1. Roebuck-Spencer T., and Cernich A. (2014). Epidemiology and societal impact of traumatic brain injury, in Handbook on the Neuropsychology of Traumatic Brain Injury. Sherer M., and Sander M.A., M.A. (eds). Springer New York: New York, NY, pps. 3–23
    1. Maas A.I., Stocchetti N., and Bullock R. (2008). Moderate and severe traumatic brain injury in adults. Lancet Neurol. 7, 728–741 - PubMed
    1. Rutland-Brown W., Langlois J.A., Thomas K.E., and Xi Y.L. (2006). Incidence of traumatic brain injury in the United States, 2003. J. Head Trauma Rehabil. 21, 544–548 - PubMed
    1. Balu R. (2014). Inflammation and immune system activation after traumatic brain injury. Curr. Neurol. Neurosci. Rep. 14, 484. - PubMed
    1. Johnson V.E., Stewart W., and Smith D.H. (2013). Axonal pathology in traumatic brain injury. Exp. Neurol. 246, 35–43 - PMC - PubMed

Publication types

LinkOut - more resources