. 2018 Jul 15;78(14):3769-3782.
doi: 10.1158/0008-5472.CAN-17-1076. Epub 2018 May 16.

Cancer-Associated Fibroblasts Drive Glycolysis in a Targetable Signaling Loop Implicated in Head and Neck Squamous Cell Carcinoma Progression

Affiliations

Cancer-Associated Fibroblasts Drive Glycolysis in a Targetable Signaling Loop Implicated in Head and Neck Squamous Cell Carcinoma Progression

Dhruv Kumar et al. Cancer Res. .

Abstract

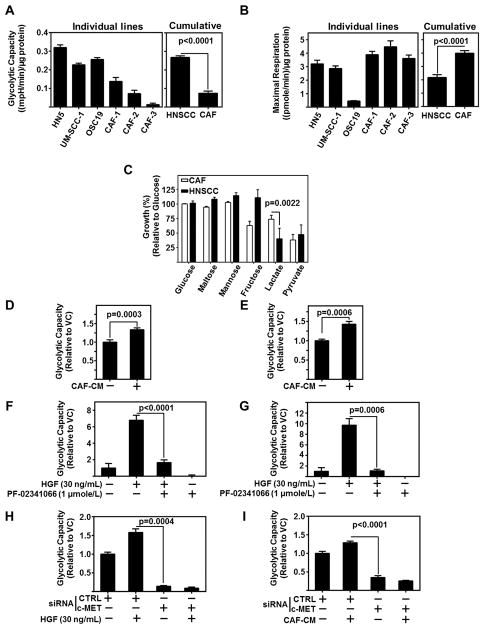
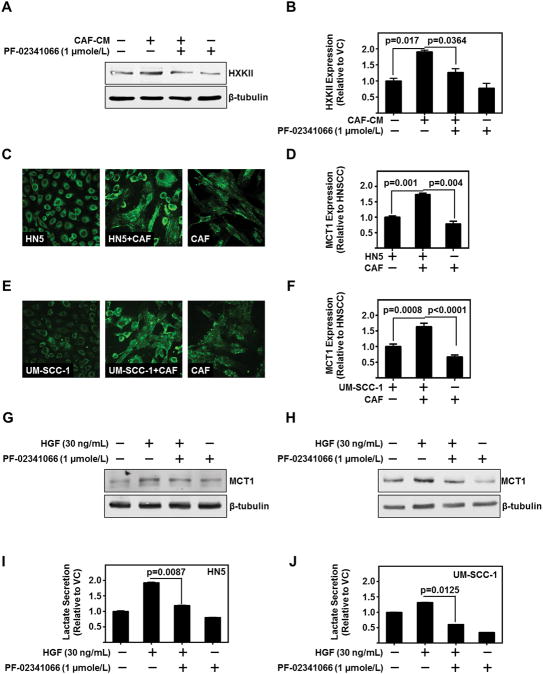
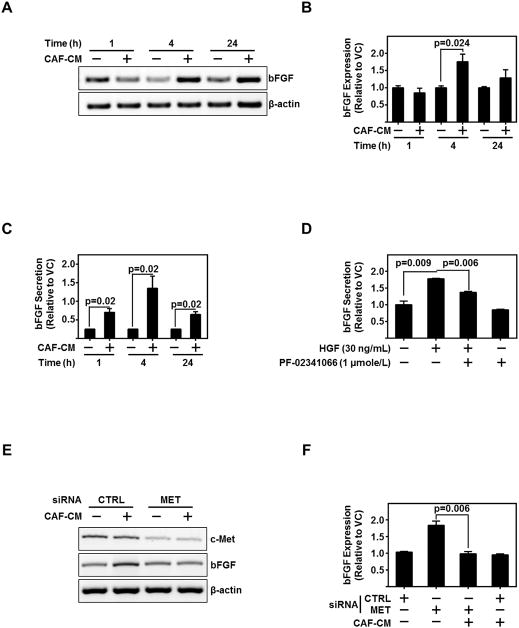
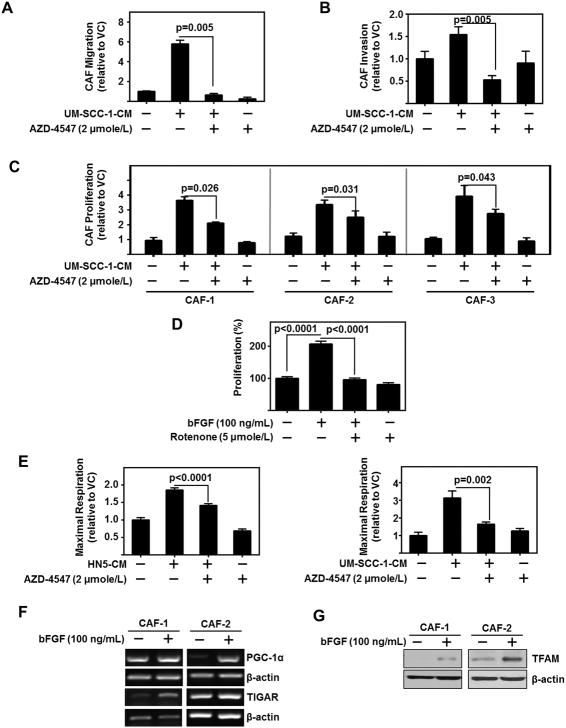
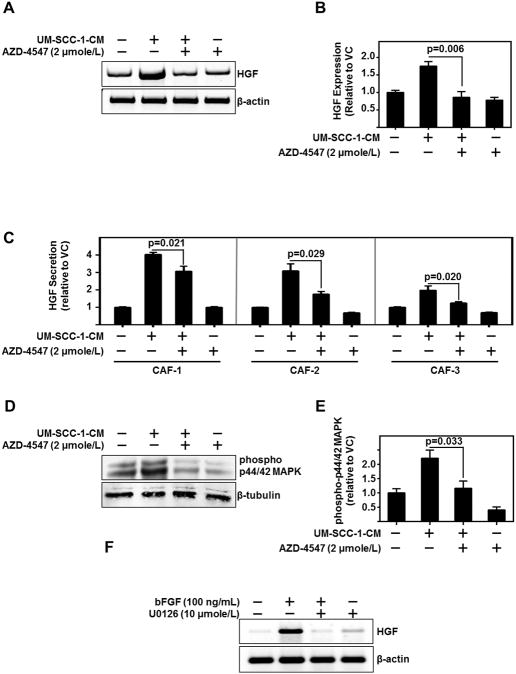
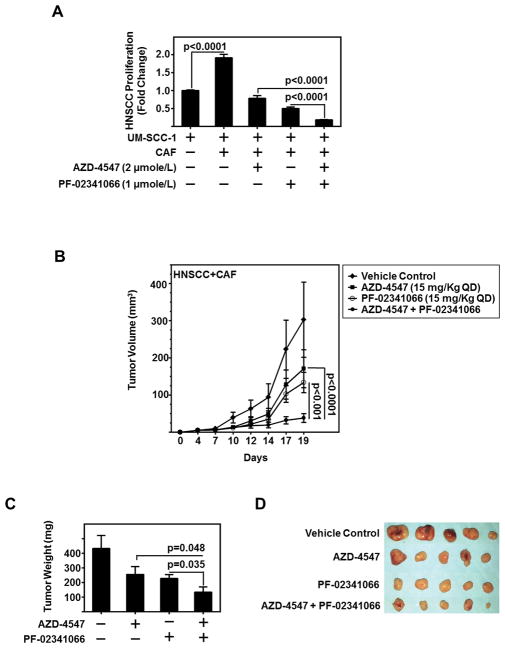
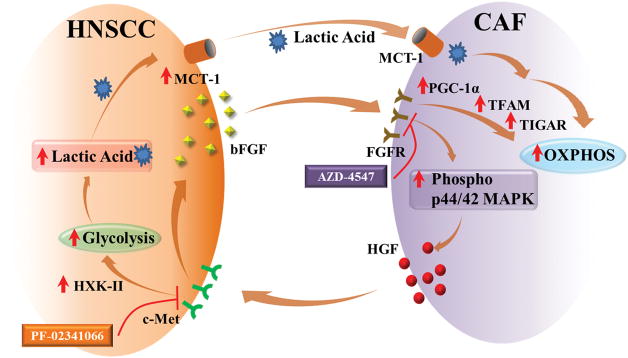
Despite aggressive therapies, head and neck squamous cell carcinoma (HNSCC) is associated with a less than 50% 5-year survival rate. Late-stage HNSCC frequently consists of up to 80% cancer-associated fibroblasts (CAF). We previously reported that CAF-secreted HGF facilitates HNSCC progression; however, very little is known about the role of CAFs in HNSCC metabolism. Here, we demonstrate that CAF-secreted HGF increases extracellular lactate levels in HNSCC via upregulation of glycolysis. CAF-secreted HGF induced basic FGF (bFGF) secretion from HNSCC. CAFs were more efficient than HNSCC in using lactate as a carbon source. HNSCC-secreted bFGF increased mitochondrial oxidative phosphorylation and HGF secretion from CAFs. Combined inhibition of c-Met and FGFR significantly inhibited CAF-induced HNSCC growth in vitro and in vivo (P < 0.001). Our cumulative findings underscore reciprocal signaling between CAF and HNSCC involving bFGF and HGF. This contributes to metabolic symbiosis and a targetable therapeutic axis involving c-Met and FGFR.Significance: HNSCC cancer cells and CAFs have a metabolic relationship where CAFs secrete HGF to induce a glycolytic switch in HNSCC cells and HNSCC cells secrete bFGF to promote lactate consumption by CAFs. Cancer Res; 78(14); 3769-82. ©2018 AACR.


Conflict of interest statement

Disclosure Statement: The authors declare no conflicts of interest.

Figures

Figure 1
Figure 1. CAFs regulate HNSCC Glycolysis through c-Met
(A) Glycolytic capacity of HNSCC (HN5, UM-SCC-1, OSC19) and three patient derived CAF lines assessed by Seahorse flux analyzer. Graph represents cumulative results from three independent experiments. Combined graph represents mean of all three HNSCC lines and all three CAF lines. (B) Maximal Respiration of HNSCC (HN5, UM-SCC-1, OSC19) and three patient derived CAF lines assessed by Seahorse flux analyzer. Graph represents cumulative results from three independent experiments. Combined graph represents mean of all three HNSCC lines and all three CAF lines. (C) Differential growth of CAFs v HNSCC in single carbon sources over 72 h. Data represent cumulative results from four CAF lines and three HNSCC Cell lines. (D) Cumulative results of glycolytic capacity of HN5 exposed to two CAF-CMs. (E) Cumulative results of glycolytic capacity of UM-SCC-1 exposed to two CAF-CMs. All error bars in figure represent ± SEM. (F) HN5 treated with recombinant HGF (30 ng/mL) and/or c-MET inhibitor, PF-02341066 (1 μmole/L). ECAR normalized to protein content per well. Cumulative results of glycolytic capacity graphed across treatment arms. (G) UM-SCC-1 treated with recombinant HGF (30 ng/mL) and/or c-MET inhibitor, PF-02341066 (1 μmole/L). ECAR normalized to protein content per well. Cumulative results of glycolytic capacity graphed across treatment arms. (H) UM-SCC-1 treated with recombinant HGF (30 ng/mL) and either control siRNA (CTRL) or c-MET siRNA. ECAR normalized to protein content per well. Cumulative results of glycolytic capacity graphed across treatment arms. (I) UM-SCC-1 treated with CAF-CM and and either control siRNA (CTRL) or c-MET siRNA. ECAR normalized to protein content per well. Cumulative results of glycolytic capacity graphed across treatment arms.
Figure 2
Figure 2. CAF-Secreted HGF Regulates HNSCC Glycolytic Enzymes and Lactate Production
(A,B) Representative immunoblot of hexokinase-II (HK-II) protein levels of HN5 treated with CAF-CM and/or c-MET inhibitor, PF-02341066 (1 μmole/L). β-tubulin serves as loading control. Cumulative densitometric analysis of HKII/β-tubulin normalized to vehicle control treated lane. (C,D) Representative immunofluorescent image (Magnificaiton is 200X) of MCT1 (green) on HN5, CAF, or co-culture of HN5 and CAF. Number of cells kept constant between wells. MCT1 levels were assessed as total fluorescent intensity, and cumulative results. (E,F) Representative immunofluorescent image (Magnificaiton is 200X) of MCT1 (green) on UM-SCC-1, CAF, or co-culture of HN5 and CAF. Number of cells kept constant between wells. MCT1 levels were assessed as total fluorescent intensity, and cumulative results. (G) Representative immunoblot of MCT1 protein levels expressed in HN5 with treatment of recombinant HGF (30 ng/mL) and/or PF-02341066 (1 μmole/L). β-tubulin serves as loading control. (H) Representative immunoblot of MCT1 protein levels expressed in UM-SCC-1 with treatment of recombinant HGF (30 ng/mL) and/or PF-02341066 (1 μmole/L). β-tubulin serves as loading control. (I) Lactate secretion as assessed by enzymatic based absorbance assay of HN5 treated with HGF (30 ng/mL) and/or PF-02341066 (1 μmole/L). Data represent cumulative normalized to vehicle control treated cells. (J) Lactate secretion as assessed by enzymatic based absorbance assay of HN5 treated with HGF (30 ng/mL) and/or PF-02341066 (1 μmole/L). Data represent cumulative results normalized to vehicle control treated cells. Error bars on all graphs represent ± SEM.
Figure 3
Figure 3. c-Met Regulates bFGF Expression in HNSCC
(A,B) Representative PCR product of bFGF mRNA in UM-SCC-1 treated with CAF-CM for the indicated time points. β-actin serves as loading control. Graph depicts cumulative densitometric results of three independent experiments of bFGF/β-actin normalized to vehicle control treated cells at each timepoint. (C) Graph depicts ELISA protein assessment of bFGF secreted from HN5 exposed to three different CAF-CMs. Cumulative data from three independent experiments are normalized to vehicle treated cells at each timepoint. (D) Graph depicts ELISA protein assessment of bFGF secreted from UM-SCC-1 exposed to either HGF (30 ng/mL) and/or c-MET inhibitor, PF-02341066 (1 μmole/L). Cumulative data from three independent experiments are normalized to vehicle treated cells. (E,F) representative PCR product of c-MET, bFGF, or β-actin (as loading control) mRNA in UM-SCC-1 exposed to CAF-CM with either control siRNA (CTRL) or c-Met siRNA. Cumulative results from three independent experiments of bFGF/β-actin normalized to CTRL siRNA, vehicle treated UM-SCC-1. Error bars on all graphs representative ± SEM.
Figure 4
Figure 4. HNSCC regulates CAFs through bFGF induction of OXPHOS
(A) HNSCC-CM (UM-SCC-1) enhanced CAF migration is attenuated by AZD-4547 (2 μmole/L). Migration assessed using transwell assay. Data represent cumulative results from three independent experiments and are normalized to cell viability. (B) HNSCC-CM (UM-SCC-1) enhanced CAF invasion is attenuated by AZD-4547 (2 μmole/L). Invasion assessed using transwell assay. Data represent cumulative results from three independent experiments and are normalized to cell viability. Error bars on all graphs represent ± SEM. (C) HNSCC-CM enhanced CAF proliferation is attenuated by AZD-4547 (2 μmole/L). Three CAF lines were treated with UM-SCC-1-CM and/or AZD-4547. Graphs depict three independent experiments for each cell line. (D) HNSCC-induced CAF proliferation is dependent on OXPHOS. Proliferation of CAFs in presence of bFGF (100 ng/mL) and/or Rotenone (5 μmole/L). Graph depicts cumulative results of three experiments plated in triplicate, error bars represent ± SEM. (E) CAF were treated with HN5-CM or UM-SCC-1-CM and/or FGFR inhibitor, AZD-4547 (2 μmole/L). Data normalized to protein content per well. Graph depicts fold change in maximum respiration normalized to basal media control cells. (F) Representative PCR product of PGC-1α and TIGAR from two patient-derived CAF lines treated with bFGF (100 ng/mL); β-actin serves as loading control. (G) Representative immunoblot of TFAM from two patient-derived CAF lines treated with bFGF (100 ng/mL). β-actin serves as loading control.
Figure 5
Figure 5. HNSCC Cells Regulate HGF Levels in CAFs via FGFR and MAPK
(A,B) Representative PCR product of HGF and β-actin (used as loading control) in CAF treated with UM-SCC-1-CM and/or FGFR inhibitor, AZD-4547 (2 μmole/L). Graph depicts cumulative results of three independent experiments. (C) ELISA protein assessment of HGF secreted from 3 CAF lines treated with UM-SCC-1-CM and/or AZD4547 (2 μmole/L). Graph depicts cumulative results form three independent experiments normalized to vehicle control treated CAF. (D,E) Representative immunoblot of phospho- p44/42 MAPK and β-tubulin (used as loading control) in CAF treated with UM-SCC-1-CM and/or AZD4547 (2 μmole/L). Graph depicts cumulative results form three independent experiments of phospho p44/42 MAPK/β-tubulin normalized to vehicle control treated CAF. (F) Representative PCR product of HGF and β-actin (used as loading control) of CAF treated with either bFGF (100 ng/mL) and/or p44/42 MAPK inhibitor, U0126 (10 μmole/L).
Figure 6
Figure 6. Dual Inhibition of c-Met and FGFR Reduces HNSCC Tumor Growth In vitro and In vivo
(A) CAF-facilitated UM-SCC-1 proliferation attenuated in FGFR inhibitor, AZD-4547 (2 μmole/L), or c-Met inhibitor, PF-02341066 (1 μmole/L), or combination of AZD-4547 and PF-02341066. Graph depicts cumulative results of CFSE-sorted UM-SCC-1 counted by flow cytometry from three independent experiments and normalized to UM-SCC-1 alone with no CAFs. (B) CAF (0.5 × 10⁶ cells)-HNSCC (1 × 10⁶ cells) admixed tumor inoculated subcutaneously in athymic nude-Foxn1nu mice volume decreases with treatment of AZD-4547 (15 mg/kg QD) and/or PF-02341066 (15 mg/kg QD) (n=5/group). (C) Graph depicts mean tumor weight of each treatment group from admixed CAF-HNSCC xenograft experiment depicted in (B). Error bars on all graphs represent ± SEM. (D) gross images of tumors excised from CAF-HNSCC xenograft experiment depicted in (B).
Figure 7
Figure 7. Schematic Representation of Tumor-Stroma Metabolic Symbiosis
HNSCC-secreted bFGF (basic fibroblast growth factor) increases p44/42 MAPK (mitogen activated protein kinase) phosphorylation which induces secretion of HGF (hepatocyte growth factor) from CAFs which binds to the c-Met receptor on HNSCC cells inducing secretion of bFGF from HNSCC cells. Further, HGF regulates expression of HXK-II (hexokinase-II) and increases cellular glycolysis. Lactic acid produced through glycolysis is transported out of the cells by MCT-1 (monocarboxyl transporter-1). The lactic acid is used by CAFs as a source of energy through OXPHOS. OXPHOS in CAFs is induced by agonization of FGFR (fibroblast growth factor receptor) by bFGF. This induces increased expression of PGC-1α (peroxisome proliferator-activated receptor γ coactivator-1α) and TFAM (Transcription Factor A, mitochondria), which increase OXPHOS. Additionally bFGF induces the expression of TIGAR (p53-inducible regulator of glycolysis and apoptosis), which downregulates glycolysis and increases OXPHOS. All in all, CAFs and HNSCC metabolically couple to facilitate tumor progression, and targeting this symbiosis inhibits tumor growth.

References

    1. Matta A, Ralhan R. Overview of current and future biologically based targeted therapies in head and neck squamous cell carcinoma. Head & neck oncology. 2009;1:6. - PMC - PubMed
    1. Kim L, King T, Agulnik M. Head and neck cancer: changing epidemiology and public health implications. Oncology. 2010;24(10):915–9. 24. - PubMed
    1. Curry JM, Sprandio J, Cognetti D, Luginbuhl A, Bar-ad V, Pribitkin E, et al. Tumor microenvironment in head and neck squamous cell carcinoma. Seminars in oncology. 2014;41(2):217–34. - PubMed
    1. Knowles LM, Stabile LP, Egloff AM, Rothstein ME, Thomas SM, Gubish CT, et al. HGF and c-Met participate in paracrine tumorigenic pathways in head and neck squamous cell cancer. Clinical cancer research : an official journal of the American Association for Cancer Research. 2009;15(11):3740–50. - PMC - PubMed
    1. Wheeler S, Shi H, Lin F, Dasari S, Bednash J, Thorne S, et al. Enhancement of head and neck squamous cell carcinoma proliferation, invasion, and metastasis by tumor-associated fibroblasts in preclinical models. Head & neck. 2014;36(3):385–92. - PMC - PubMed

Publication types

MeSH terms

Substances