. 2018 Jul 15;78(14):3755-3760.
doi: 10.1158/0008-5472.CAN-18-0221. Epub 2018 May 16.

Metabolic Imaging of the Human Brain with Hyperpolarized 13C Pyruvate Demonstrates 13C Lactate Production in Brain Tumor Patients

Affiliations

Metabolic Imaging of the Human Brain with Hyperpolarized 13C Pyruvate Demonstrates 13C Lactate Production in Brain Tumor Patients

Vesselin Z Miloushev et al. Cancer Res. .

Abstract

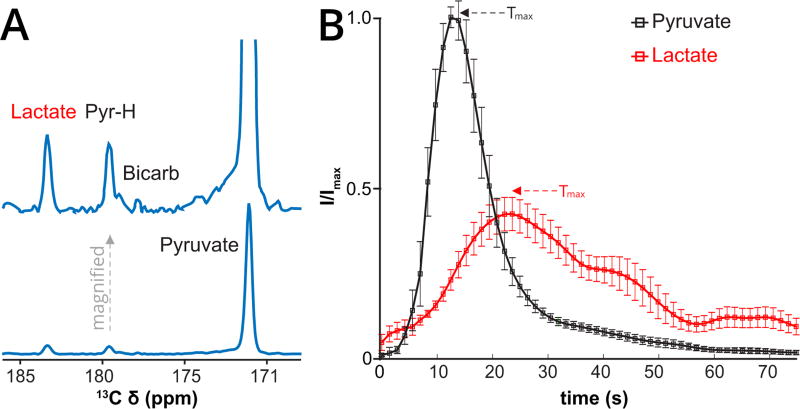
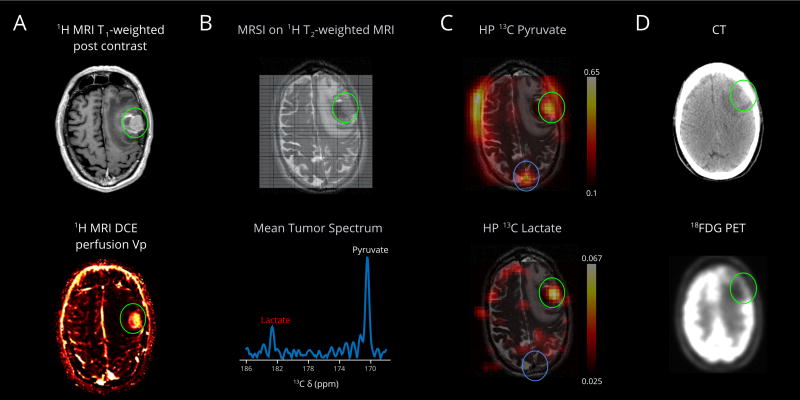
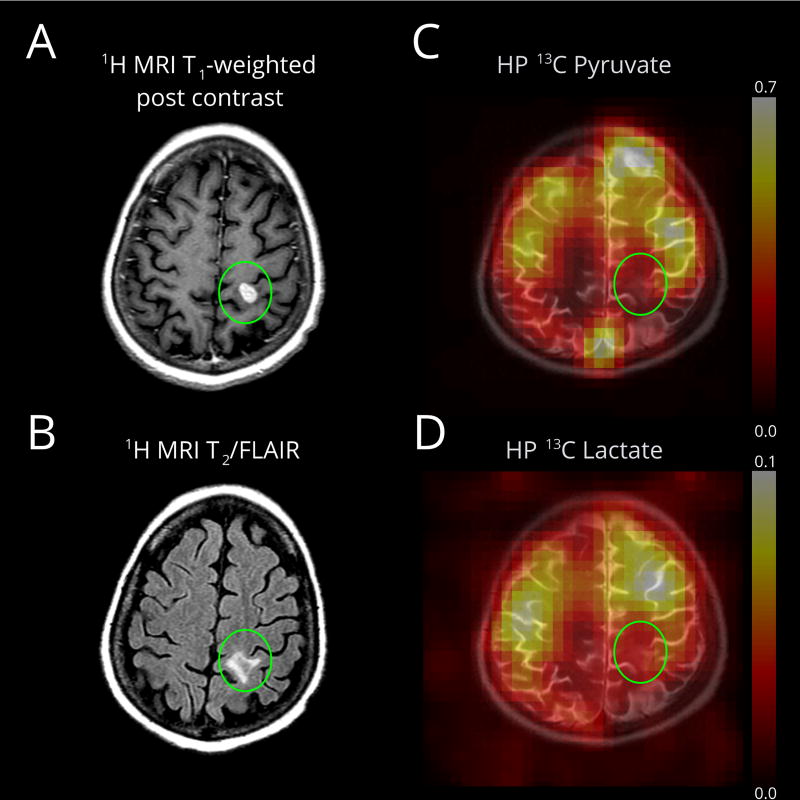
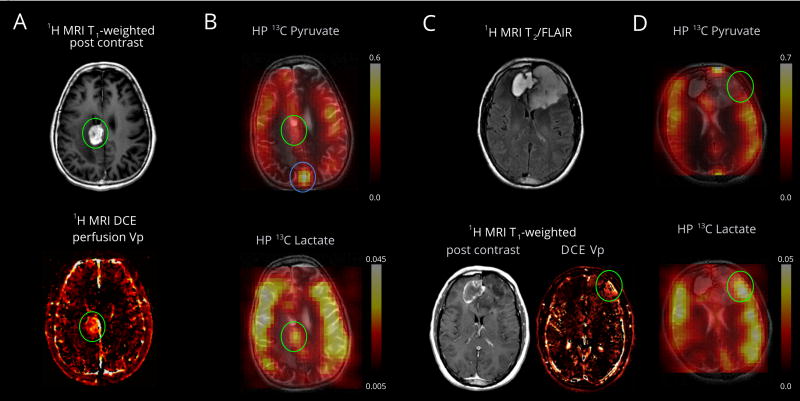
Hyperpolarized (HP) MRI using [1-13C] pyruvate is a novel method that can characterize energy metabolism in the human brain and brain tumors. Here, we present the first dynamically acquired human brain HP 13C metabolic spectra and spatial metabolite maps in cases of both untreated and recurrent tumors. In vivo production of HP lactate from HP pyruvate by tumors was indicative of altered cancer metabolism, whereas production of HP lactate in the entire brain was likely due to baseline metabolism. We correlated our results with standard clinical brain MRI, MRI DCE perfusion, and in one case FDG PET/CT. Our results suggest that HP 13C pyruvate-to-lactate conversion may be a viable metabolic biomarker for assessing tumor response.Significance: Hyperpolarized pyruvate MRI enables metabolic imaging in the brain and can be a quantitative biomarker for active tumors.Graphical Abstract: http://cancerres.aacrjournals.org/content/canres/78/14/3755/F1.large.jpg Cancer Res; 78(14); 3755-60. ©2018 AACR.


Conflict of interest statement

Conflicts of Interest: A.I. Holodny has a major compensated employment/leadership position in fMRI Consultants, LLC. The authors declare no additional conflicts of interest.

Figures

Figure 1
Figure 1
First-in-human Brain HP Pyruvate to Lactate metabolism. (A) Mean spectrum, weighted in time, summed over the entire brain slice with accompanying scaled increased spectrum, for the first patient (Patient 1) imaged with HP pyruvate demonstrating metabolic conversion to lactate, the pyruvate hydrate (PyrH), and putative bicarbonate (Bicarb). The top spectrum is a magnified version. (B) Average dynamics of HP pyruvate delivery (green curve) and lactate (red curve, scaled ×5) buildup over the entire brain slice (tumor and normal brain) in four patients (five injections). The mean time to maximum (Tmax) of pyruvate (11.7 ± 1.9 s) and lactate (23.0 ± 1.3 s) signals are indicated by arrows. The relative delay in the lactate Tmax is consistent with metabolic conversion. Curves are interpolated 3-fold for smoothing. Actual time resolution is 4.3 s. Error bars are standard errors in the mean (SEM), without scaling for lactate. Vertical scale is in arbitrary units.
Figure 2
Figure 2
First-in-human HP pyruvate imaging of a metastasis (Patient 3). (A) The left middle frontal gyrus melanoma metastasis (green circle) has solid components laterally and hemorrhagic components medially. MRI DCE perfusion demonstrates correlate elevated plasma volume. (B) The 13C MRSI imaging grid is superimposed on a base T2-weighted 1H image, showing the left middle frontal gyrus hemorrhagic metastasis (green circle), left frontal mass effect and edema. The interpolated grid corresponds to a native 1-cm in-plane resolution over a 16-cm field-of-view, and 2.0-cm slice thickness. Mean tumor spectrum shows pyruvate and its metabolic product lactate. (C) The HP pyruvate map shows high signal corresponding to the metastasis, likely due to perfusion. The volume normalized pyruvate signal in the lesion is 2.8 fold higher than the entire brain. The HP lactate map shows significantly high intensity corresponding to the solid component of the metastasis, absent from the medial perilesional hemorrhagic component (B, T2-weighted image, dark signal, medially). The volume normalized lactate signal in the lesion is 6.7 fold higher than the entire brain. Importantly, lactate signal in the superior sagittal sinus is low, consistent with the detected lactate being made locally in the brain, not due to delivery from outside the brain. (D) FDG PET/CT obtained 31 days prior; the mass increased slightly between the PET/CT (~2.1×1.3 cm) and the brain MR (~2.5×1.8 cm); the brain MR also demonstrates increased hemorrhage medial to the mass and increased left frontal edema. The mass is relatively hypo-metabolic compared to the high cortical metabolism, which is expected to be predominantly oxidative, relative to the tumor. Lactate scale is relative to pyruvate.
Figure 3
Figure 3
Pyruvate metabolism in a small ovarian cancer metastasis (Patient 4), after systemic chemotherapy. (A) An enhancing metastasis is located in the left post-central gyrus (green oval). (B) The T2/FLAIR image demonstrates minimal surrounding edema. DCE MRI was not available for this lesion. (C) The HP pyruvate map shows high signal corresponding to the cortex/juxtacortical regions and superior sagittal sinus. (D) The HP lactate map similarly shows high signal in the cortex/juxtacortical regions without conspicuity in the lesion. Lactate scale is relative to pyruvate.
Figure 4
Figure 4
Pyruvate metabolism in a recurrent glioblastoma and treatment related changes (Patient 2, panels A and B) and anaplastic oligodendroglioma (Patient 1, panels C and D). (A) An enhancing mass is located in the right cingulate gyrus (green oval). MRI DCE perfusion demonstrates elevated plasma volume. The resected pathological specimen demonstrated 60% viable tumor and 40% necrosis (see Appendix Table 1). (B) The HP pyruvate map shows high signal corresponding to the cortex/juxtacortical regions and superior sagittal sinus. The volume normalized pyruvate signal in the lesion is 1.3-fold higher than the entire brain. The HP lactate map shows mildly elevated signal corresponding to the lesion, similar to background lactate production by the brain. The volume normalized lactate signal in the lesion is 1.0 fold of the lactate over the entire brain (cortex and white matter). (C) The T2/FLAIR images shows an expansile left frontal mass and contracting right frontal hematoma. The left frontal mass has minimal, patchy enhancement and a small component of elevated plasma volume (green oval) visualized by DCE MRI. The resected pathological specimen demonstrated anaplastic oligodendroglioma in a background of lower grade tumor (see Appendix Table 1). (D) The HP pyruvate map shows high signal corresponding to the cortex/juxtacortical regions and superior sagittal sinus, but relatively lower signal corresponding to the small hyper-perfused component. The HP lactate map shows mildly elevated signal corresponding to the hyper-perfused component, similar to background lactate production by the brain. (B and D) Lactate scales are relative to respective pyruvate.

References

    1. Hu S, Balakrishnan A, Bok RA, Anderton B, Larson PEZ, Nelson SJ, et al. (13)C-Pyruvate Imaging Reveals Alterations in Glycolysis that Precede c-MYC Induced Tumor Formation and Regression. Cell Metabolism. 2011;14(1) doi: 10.1016/j.cmet.2011.04.012. - DOI - PMC - PubMed
    1. Wen PY, Chang SM, Van den Bent MJ, Vogelbaum MA, Macdonald DR, Lee EQ. Response Assessment in Neuro-Oncology Clinical Trials. Journal of clinical oncology : official journal of the American Society of Clinical Oncology. 2017;35(21):2439–49. - PMC - PubMed
    1. Huang RY, Neagu MR, Reardon DA, Wen PY. Pitfalls in the neuroimaging of glioblastoma in the era of antiangiogenic and immuno/targeted therapy - detecting illusive disease, defining response. Frontiers in neurology. 2015;6:33. - PMC - PubMed
    1. Bulik M, Jancalek R, Vanicek J, Skoch A, Mechl M. Potential of MR spectroscopy for assessment of glioma grading. Clinical neurology and neurosurgery. 2013;115(2):146–53. - PubMed
    1. Venneti S, Dunphy MP, Zhang H, Pitter KL, Zanzonico P, Campos C, et al. Glutamine-based PET imaging facilitates enhanced metabolic evaluation of gliomas in vivo. Sci Transl Med. 2015;7(274):274ra17. - PMC - PubMed

Publication types

MeSH terms