. 2018 Jul 26;56(8):e00354-18.
doi: 10.1128/JCM.00354-18. Print 2018 Aug.

Microbial Interactions in the Cystic Fibrosis Airway

Affiliations

Microbial Interactions in the Cystic Fibrosis Airway

Ann M Granchelli et al. J Clin Microbiol. .

Abstract

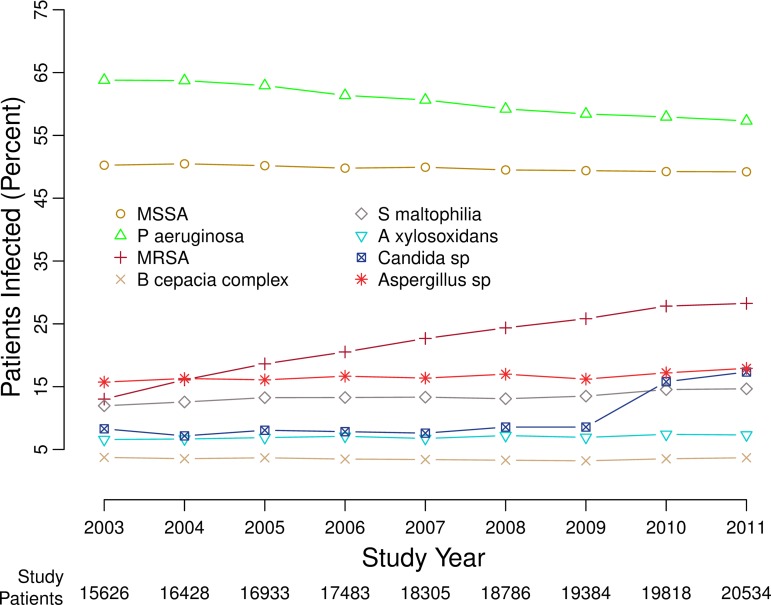
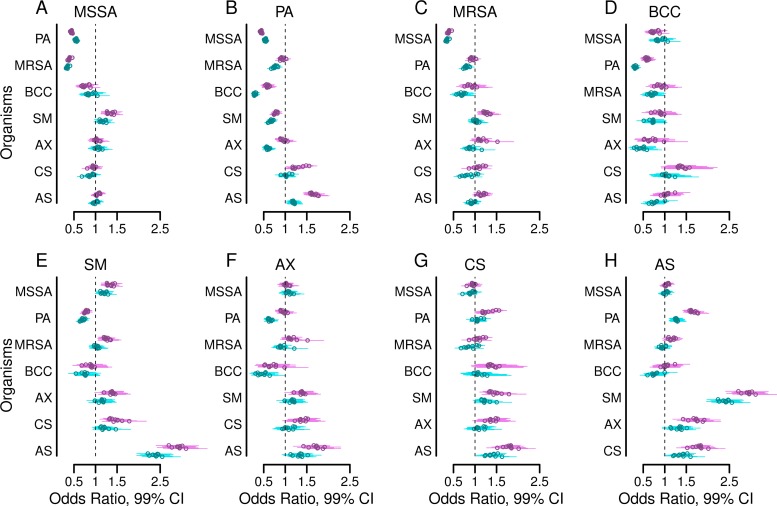
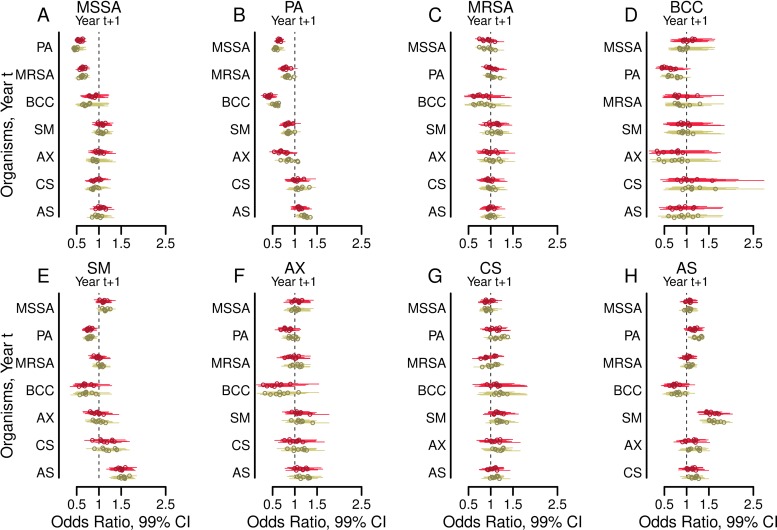
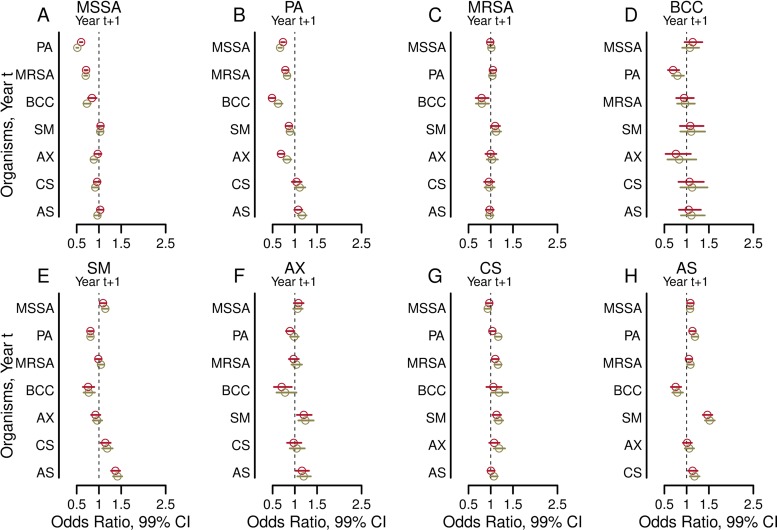
Interactions in the airway ecology of cystic fibrosis may alter organism persistence and clinical outcomes. Better understanding of such interactions could guide clinical decisions. We used generalized estimating equations to fit logistic regression models to longitudinal 2-year patient cohorts in the Cystic Fibrosis Foundation Patient Registry, 2003 to 2011, in order to study associations between the airway organisms present in each calendar year and their presence in the subsequent year. Models were adjusted for clinical characteristics and multiple observations per patient. Adjusted models were tested for sensitivity to cystic fibrosis-specific treatments. The study included 28,042 patients aged 6 years and older from 257 accredited U.S. care centers and affiliates. These patients had produced sputum specimens for at least two consecutive years that were cultured for methicillin-sensitive Staphylococcus aureus, methicillin-resistant S. aureus, Pseudomonas aeruginosa, Burkholderia cepacia complex, Stenotrophomonas maltophilia, Achromobacter xylosoxidans, and Candida and Aspergillus species. We analyzed 99.8% of 538,458 sputum cultures from the patients during the study period. Methicillin-sensitive S. aureus was negatively associated with subsequent Paeruginosa. Paeruginosa was negatively associated with subsequent B. cepacia complex, Axylosoxidans, and Smaltophilia. Bcepacia complex was negatively associated with the future presence of all bacteria studied, as well as with that of Aspergillus species. Paeruginosa, B. cepacia complex, and S. maltophilia were each reciprocally and positively associated with Aspergillus species. Independently of patient characteristics, the organisms studied interact and alter the outcomes of treatment decisions, sometimes in unexpected ways. By inhibiting P. aeruginosa, methicillin-sensitive S. aureus may delay lung disease progression. Paeruginosa and B. cepacia complex may inhibit other organisms by decreasing airway biodiversity, potentially worsening lung disease.

Keywords: Burkholderia; Pseudomonas aeruginosa; Staphylococcus aureus; airway infections; cystic fibrosis; logistic regression; microbial ecology.


Figures

FIG 1
FIG 1
Percentages of patients with positive cultures for the infections studied, 2003 to 2011. Eight curves show the changing percentages of cultures for the organisms studied, in each of the years from 2003 through 2011, for the patients in the CFFPR who were able to produce sputum samples for microbiologic cultures. The figure is similar to prior figures showing the data in somewhat different ways (59).
FIG 2
FIG 2
Adjusted cross-sectional associations between airway infections. Forest plots show the adjusted odds ratios (circles) and 99% confidence intervals (bars) of having a positive culture for each of the eight organisms studied within each study year, comparing the presence versus absence of a positive culture for each of the other seven organisms in the same year. The outcomes for methicillin-sensitive Staphylococcus aureus (MSSA) (A), Pseudomonas aeruginosa (B), methicillin-resistant S. aureus (MRSA) (C), Burkholderia cepacia complex (BCC) (D), Stenotrophomonas maltophilia (E), Achromobacter xylosoxidans (F), Candida species (G), and Aspergillus species (H) are shown. Results shown in purple are from models adjusted by the presence of the other six organisms. Results shown in turquoise are from models additionally adjusted for the following clinical characteristics: age, sex, late diagnosis of CF, best FEV1% in each year, annual number of APE, pancreatic sufficiency, diabetes status, and weight-for-age Z-score.
FIG 3
FIG 3
Adjusted associations between airway infections in the years from 2003 to 2010 (years t) and infections with other organisms in subsequent years 2004 to 2011 (years t + 1). Forest plots show the odds ratios (circles) and 99% confidence intervals (bars) of having a positive culture in year t+1 for each of the eight organisms studied when each of the other organisms was present in the preceding year t (where t is a particular year between 2003 and 2010). Outcomes from years t+1 are shown for methicillin-sensitive Staphylococcus aureus (MSSA) (A), Pseudomonas aeruginosa (B), methicillin-resistant S. aureus (MRSA) (C), Burkholderia cepacia complex (BCC) (D), Stenotrophomonas maltophilia (E), Achromobacter xylosoxidans (F), Candida species (G), and Aspergillus species (H). Results shown in red are from models adjusted by the presence of the remaining six organisms. Results shown in green are from models additionally adjusted for the following clinical characteristics in year t: age, sex, late diagnosis of CF, best FEV1% in each year, annual number of APE, pancreatic sufficiency, diabetes status, and weight-for-age Z-score.
FIG 4
FIG 4
Adjusted associations from the combined model between an organism seen in year t with a different organism in year t+1. Each forest plot shows the odds ratios (circles) and 99% confidence intervals (bars) from the combined model utilizing the entire 2003–2011 CFFPR data set for each of the eight organisms studied in year t+1 when each of the other organisms was present in the respective year t (where t is a particular year between 2003 and 2010). Outcomes from years t+1 are shown for methicillin-sensitive Staphylococcus aureus (MSSA) (A), Pseudomonas aeruginosa (B), methicillin-resistant S. aureus (MRSA) (C), Burkholderia cepacia complex (BCC) (D), Stenotrophomonas maltophilia (E), Achromobacter xylosoxidans (F), Candida species (G), and Aspergillus species (H). Results shown in red are from models adjusted by the presence of the remaining six organisms. Results shown in green are from models additionally adjusted for the following clinical characteristics in year t: age, sex, late diagnosis of CF, best FEV1% in each year, annual number of APE, pancreatic sufficiency, diabetes status, and weight-for-age Z-score.

References

    1. Cystic Fibrosis Foundation. 2016. Cystic Fibrosis Foundation Patient Registry 2015. Annual data report Cystic Fibrosis Foundation, Bethesda, MD.
    1. Lipuma JJ. 2010. The changing microbial epidemiology in cystic fibrosis. Clin Microbiol Rev 23:299–323. doi:10.1128/CMR.00068-09. - DOI - PMC - PubMed
    1. Amadori A, Antonelli A, Balteri I, Schreiber A, Bugiani M, De Rose V. 2009. Recurrent exacerbations affect FEV1 decline in adult patients with cystic fibrosis. Respir Med 103:407–413. doi:10.1016/j.rmed.2008.09.024. - DOI - PubMed
    1. Sanders DB, Bittner RCL, Rosenfeld M, Hoffman LR, Redding GJ, Goss CH. 2010. Failure to recover to baseline pulmonary function after cystic fibrosis pulmonary exacerbation. Am J Respir Crit Care Med 182:627–632. doi:10.1164/rccm.200909-1421OC. - DOI - PMC - PubMed
    1. Waters V, Stanojevic S, Atenafu EG, Lu A, Yau Y, Tullis E, Ratjen F. 2012. Effect of pulmonary exacerbations on long-term lung function decline in cystic fibrosis. Eur Respir J 40:61–66. doi:10.1183/09031936.00159111. - DOI - PubMed

Publication types