. 2018 May 16;10(441):eaap8307.
doi: 10.1126/scitranslmed.aap8307.

Metarrestin, a perinucleolar compartment inhibitor, effectively suppresses metastasis

Affiliations

Metarrestin, a perinucleolar compartment inhibitor, effectively suppresses metastasis

Kevin J Frankowski et al. Sci Transl Med. .

Abstract

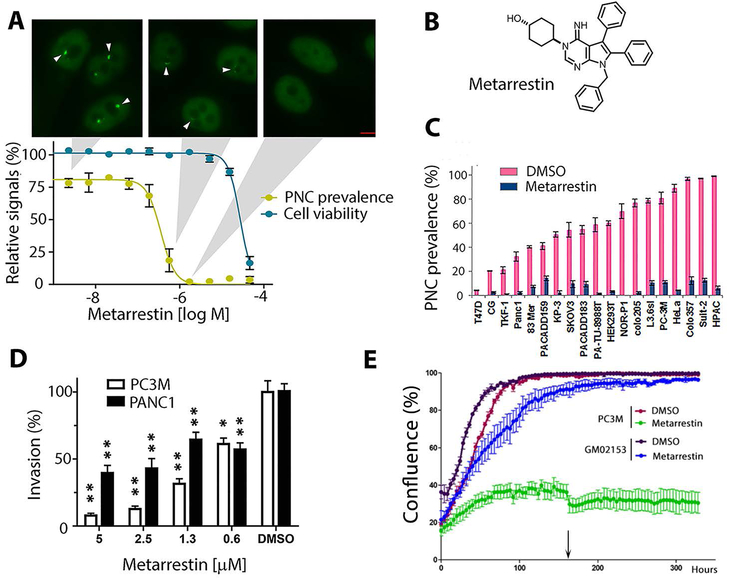
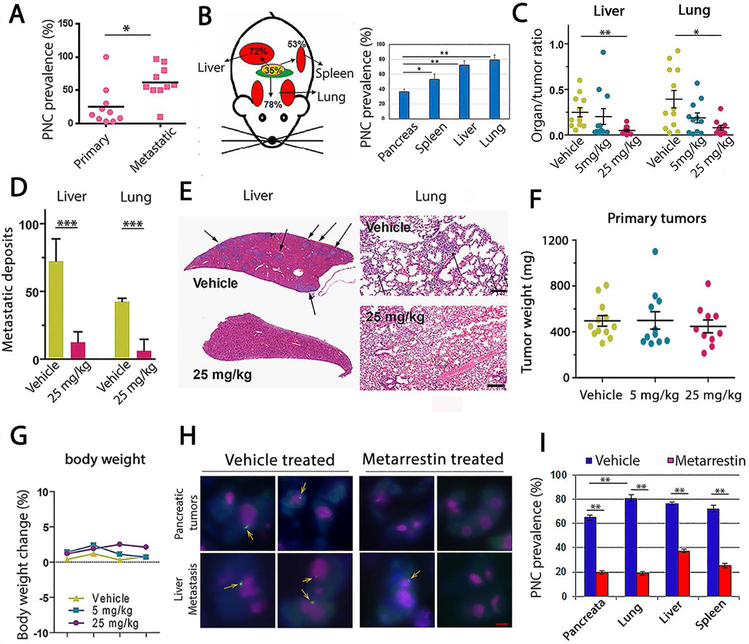
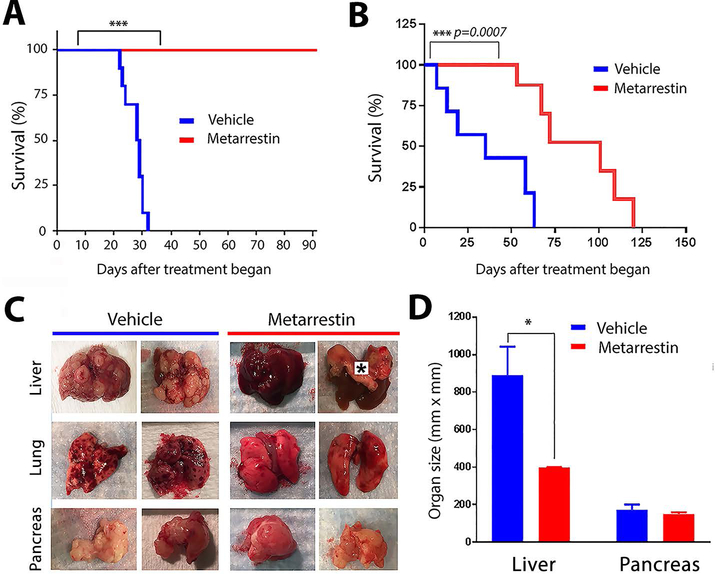
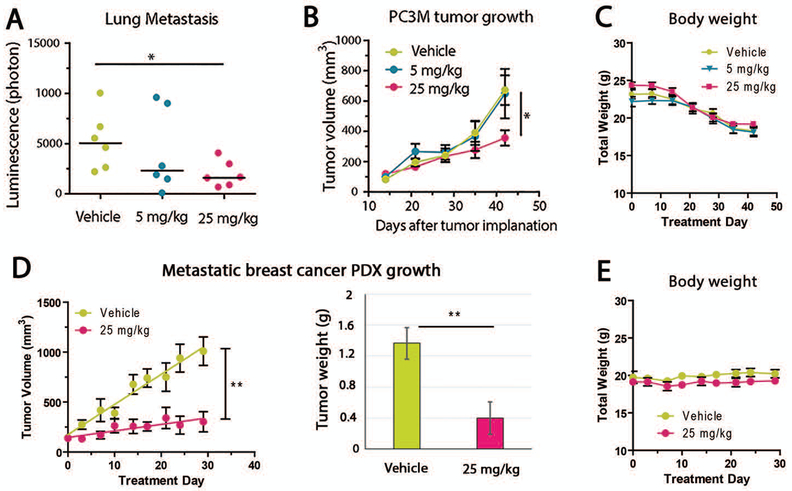
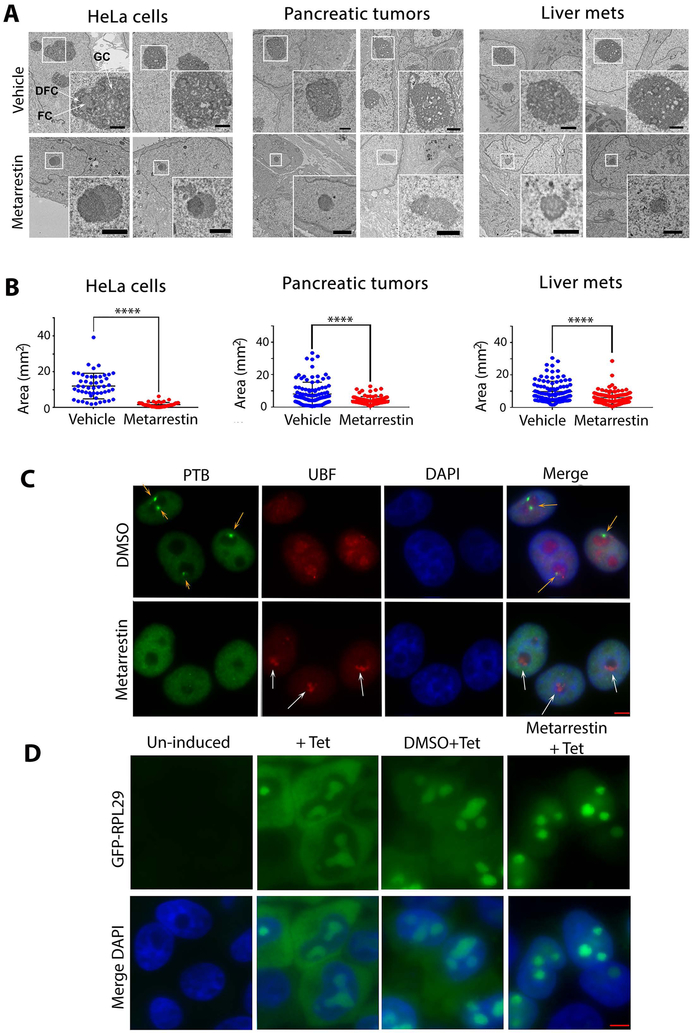
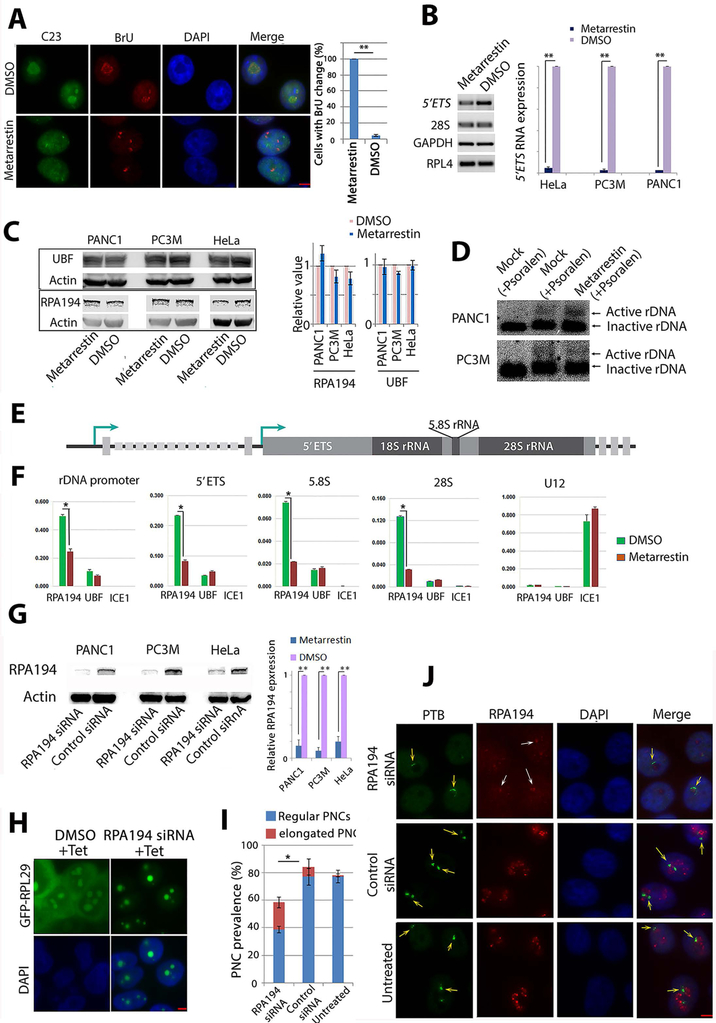
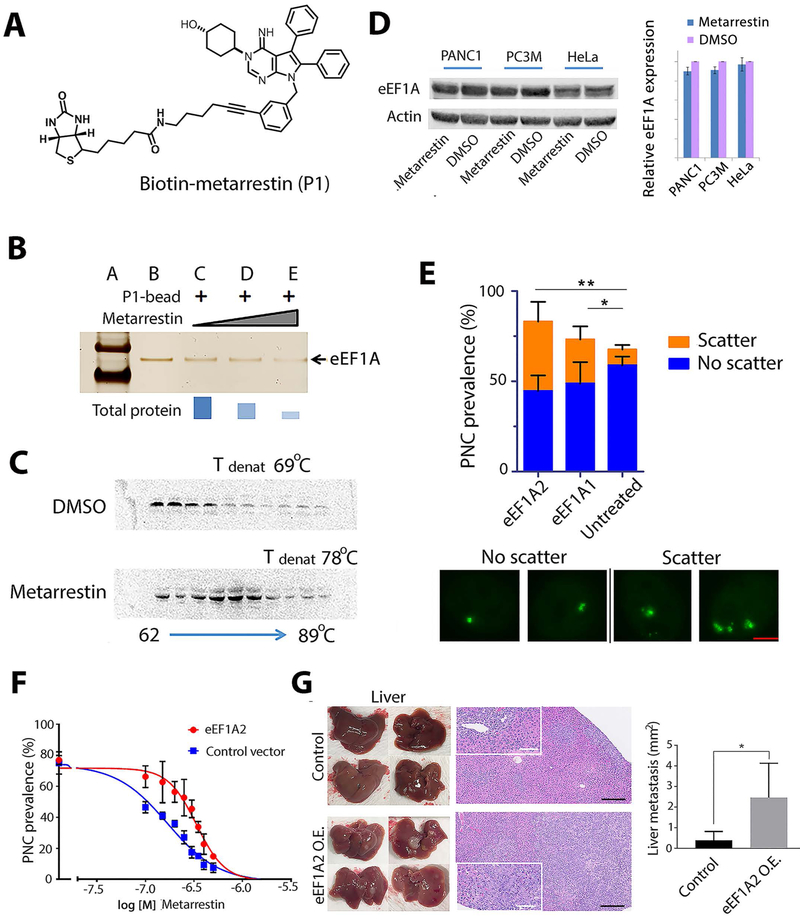
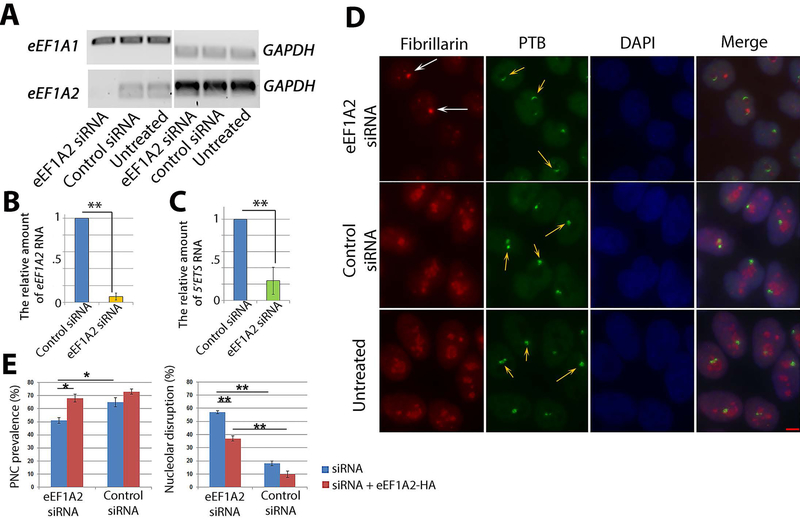
Metastasis remains a leading cause of cancer mortality due to the lack of specific inhibitors against this complex process. To identify compounds selectively targeting the metastatic state, we used the perinucleolar compartment (PNC), a complex nuclear structure associated with metastatic behaviors of cancer cells, as a phenotypic marker for a high-content screen of over 140,000 structurally diverse compounds. Metarrestin, obtained through optimization of a screening hit, disassembles PNCs in multiple cancer cell lines, inhibits invasion in vitro, suppresses metastatic development in three mouse models of human cancer, and extends survival of mice in a metastatic pancreatic cancer xenograft model with no organ toxicity or discernable adverse effects. Metarrestin disrupts the nucleolar structure and inhibits RNA polymerase (Pol) I transcription, at least in part by interacting with the translation elongation factor eEF1A2. Thus, metarrestin represents a potential therapeutic approach for the treatment of metastatic cancer.


Figures

Figure 1:
Figure 1:. Metarrestin reduces PNCs at a sub-micromolar concentration and inhibits invasion of cancer cells.
(A) Metarrestin concentration-response curve against PNC prevalence in PC3M-GFP-PTB cells (yellow, PC3M, has a PNC prevalence of 75-85% in the absence of treatment) and cytotoxicity as measured by cellular ATP (CellTiter Glo) (blue). Shown above are representative PTB-GFP images for cells at the indicated concentrations (arrowheads indicate PNCs) (scale bar = 5 μm). (B) The structure of metarrestin. (C) 1 μM metarrestin was effective at reducing PNCs in a range of cancer cell lines (p<0.05 for PNC reduction in all cell lines; the list of cell lines is in table S1). (D) Metarrestin inhibits Matrigel invasion at below micromolar concentrations (0.6 μM) within 24 hours of treatment (* p<0.05 and ** p<0.01 in comparison to DMSO). (E) Metarrestin at 1 μM impacts cell growth in cancer cell line PC3M but not in normal fibroblasts (GM02153) (arrow indicates the time of medium change). * P < 0.05, ** P < 0.01.
Figure 2:
Figure 2:. Metarrestin treatment reduces metastasis to the lungs and liver in NOD/IL2 gamma (null) PANC1 mice.
(A) A panel of pancreatic cancer cell lines derived from either primary pancreatic tumors or metastatic lesions showed a higher PNC prevalence in cells derived from metastasis than from primary tumors (cell line explanations in table S2). (B) PNC prevalence increased in metastatic tissues (red) from NOD/IL2 gamma (null) PANC1 mice over primary tumor tissues (yellow), harvested 8 weeks after implantation. PNC prevalence was determined on frozen tissue sections stained with SH54 antibodies. (C) After six weeks of treatment, metastatic deposits measured by organ/tumor ratio in liver and lungs decreased in mice treated once daily with 25 mg/kg of metarrestin compared to vehicle-treated animals (n=10 mice were randomized to each cohort). (D) Pathology and (E) histological examinations demonstrated that livers and lungs from metarrestin-treated animals have a reduced metastatic burden compared to those treated with vehicle (bar=250 μm; n=4 animals per group analyzed). (F) The primary tumors in treated animals were not changed. (G) Treatment was well tolerated, and there were no significant weight differences between treatment groups across the duration of the experiment. (H) Metarrestin disassembles PNCs in primary pancreatic tumors and metastases of NSG PANC1 mice. PNCs in tumors were visualized via immunofluorescence (PNCs labeled green and marked with arrows, nucleoli labeled pink, DAPI, blue) 12 weeks after inoculation. Images from the primary tumors and liver metastases are shown (scale bar = 5 μm). Vehicle-treated animals showed typical, easily detectable PNCs. PNC prevalence was reduced and remaining PNCs appeared smaller in metarrestin-treated animals (25 mg/kg IP daily for 6 weeks; n=4 animals per group analyzed). (I) Metarrestin effect on PNC prevalence in primary pancreatic tumors and sites of metastasis. PNC prevalence was reduced with metarrestin treatment (25 mg/kg IP daily for 6 weeks) in the primary tumor (pancreas) and in metastatic tumors in the lung, liver, and spleen. * P < 0.05, ** P < 0.01, *** P < 0.001.
Figure 3:
Figure 3:. Metarrestin treatment extends survival in the NSG PANC1 pancreatic cancer metastasis model.
(A) Metarrestin treatment through drug-infused chow (70 ppm designed to administer 10 mg/kg daily) starting 6 weeks after 3D PANC1 tumor cell inoculation, when animals generally do not show macrometastasis on organ surfaces, prevented mortality beyond 90 days of treatment. (B) Metarrestin treatment (10 mg/kg daily) in NSG mice starting after mice developed macrometastasis, including visible liver surface deposits, extends survival compared to vehicle-treated (NIH 31 Haslan diet) mice. (C) Full necropsy of mice on the survival study at time of death demonstrates decreased metastatic disease burden in the liver of metarrestin-treated animals without detectable impact on primary tumor size. Animals in the control group showed near complete or complete organ replacement with tumors, particularly in the liver (*indicates thick right hemidiaphragm) and to a lesser degree in the lung. Pancreatic tumors, in comparison, were similar in both groups. (D) Average sizes of livers (containing metastatic tumors) and of primary pancreatic tumors in vehicle and metarrestin-treated mice from the study in Fig. 3B. * P < 0.05, ** P < 0.01, *** P < 0.001.
Figure 4:
Figure 4:. Metarrestin treatment reduces metastasis of prostate cancer (PC3M) and growth of metastatic breast cancer PDX models.
(A) Daily treatment with metarrestin significantly reduced lung metastasis as measured by quantitative IVIS (n=6 for each group), (B) but only a small effect on the growth of PC3M primary tumors inoculated SC, as measured by tumor volume. (C) Weekly body weight evaluation did not show significant differences between treated and control groups. (D) Metarrestin treatment effectively inhibited the growth of a PDX consisting of metastatic cells from a patient’s pleural fluid (n=5 for each group), as measured by tumor volume and tumor weight at the end of the experiment. (E) The body weight of treated animals was not changed. Animals treated with metarrestin remained agile and well-groomed, in contrast to vehicle-treated animals. * P < 0.05, ** P < 0.01.
Figure 5.
Figure 5.. Metarrestin treatment induces nucleolar structure changes.
(A) Nucleoli lose their typical three substructures, as seen in untreated or DMSO-treated cells (arrows indicate DFC, dense fibrillary components, FC, fibrillar components, and GC, granular components), and develop nucleolar capping (enlarged inserts) upon treatment with metarrestin in HeLa cells and tumor tissues. Representative electron micrographs are shown for HeLa cells (treated at 1 μM for 24 hours), primary pancreatic tumors, and liver metastases from NSG PANC1 mice treated with vehicle (top) or 10 mg/kg metarrestin (bottom) for 7 days Mice were harvested 1 hour after last metarrestin dose (inset shows nucleoli). Scale bar = 1 μm. (B) Quantitative evaluation of the EM images demonstrated that average nucleolar area was reduced in metarrestin-treated cell lines and tissues compared to vehicle control (P<0.0001). 100 nucleoli were randomly selected and analyzed to calculate nucleolar area as ((largest+shortest diameter)/2)2×π). The comparison of mean nucleolar areas was performed using Mann Whitney U test, 2-tailed, n=4 animals per group. (C) The changes in nucleolar architecture induced by metarrestin treatment were reflected in the redistribution of Pol I transcription factor, UBF, into cap-like structures (capping) (white arrows), corresponding to the loss of PNCs (green panel, orange arrows). As shown in the merge panel, the capping of UBF reflects the segregation of the fibrillar components from the granular components, as seen in EM images in A. (D) Metarrestin interferes with ribosomal biogenesis. An inducible RPL29-GFP-expressing cell line synthesizes RPL29-GFP when treated with tetracyclin (2nd panels). When cells were treated with 1 μM metarrestin before tetracycline induction, the newly synthesized proteins accumulated in the nucleoli and nuclei (4th panels) compared to the DMSO control treated cells (3rd panels). Scale bars = 5 μm (C and D).
Figure 6:
Figure 6:. Metarrestin treatment reduces pre-RNA synthesis and Pol I occupancy at rDNA without changing rDNA chromatin states.
(A) Pol I transcription patterns are altered, as demonstrated by a redistribution of BrU incorporation signals from typical nucleolar labeling to pin-points at 5 min (red panel), corresponding to the changes in nucleolar structure shown as a loss of nucleolar labeling of C23/nucleolin (green panel). All cells treated with metarrestin show alterations of BrU labeling in the nucleoli compared to a small fraction of cells in DMSO treated cells (right panel). (B) RT-PCR (left panel) and qRT-PCR (right panel) show the reduction in 5’ETS of the pre-rRNA in metarrestin-treated cells. (C) Western blot analyses show no changes in protein expression of RPA194, the large subunit of Pol I, and UBF in metarrestin-treated cells. (D) Psoralen-crosslinking experiments show that the ratio of active to inactive rDNA chromatin appears unchanged upon exposure to metarrestin. (E) A diagram of rDNA structure. (F) Quantitative ChIP evaluations demonstrate that metarrestin treatment reduces the occupancy of RPA194, but not UBF, on rDNA through the promoter and the coding region. (G) Knockdown of pol I by siRNA showed reduction of RPA194 by Western blots, and the amount was quantified in relation to control siRNA treated cells (set as 1). (H) Correspondingly, ribosome synthesis was reduced in RPA194 knockdown cells, and induced GFP-RPL29 expression 72 hours after transfection of the siRNA showed the absence of cytoplasmic localization of the protein. (I) Knockdown of RPA194 by siRNA reduced PNC prevalence and increased the number of PNCs with a crescent shape (red portion). (J) RPA194 knockdown also disrupts the nucleolus (top red panel, white arrows) compared to untreated and control oligo treated cells (lower two panels). PNC structures were altered into crescent shapes (top green panel, orange arrows) compared to untreated or control oligo treated cells (lower two panels). Scale bars for all images = 5 μm. * p<0.05, ** p<0.01.
Figure 7:
Figure 7:. Metarrestin specifically binds eEF1A2, and increased eEF1A2 enhances PNCs and metastasis formation.
(A) The structure of metarrestin tagged with biotin. (B) Metarrestin effectively outcompeted recombinant eEFl A from binding to anchored biotinylated metarrestin-eEF1A complex. (C) Metarrestin treatment stabilized eEF1A in a thermal stability assay using PC3M cell lysate. (D) Western blot analyses do not show changes in the amount of eEF1A proteins upon metarrestin treatment at 1 μM for 24 hours. (E) Overexpression of HA-eEF1A2 enhanced PNC structures in cells (image panels, each containing a single nucleus). Although it did not significantly increase overall PNC prevalence (top), overexpression of HA-eEF1A2 increased the number of PNCs per nucleus (scattered PNC prevalence: the number of cells containing 2 or more PNCs); n = 300 cells (bar= 2 μm). (F) Overexpression of eEF1A2 in PC3M cells increased the IC50 of metarrestin for PNC disassembly. (G) 6×10⁴ PANC1 3D spheres transduced with empty vector (control) or eEF1A2 (eEF1A2 O.E.) were injected into the tail of the pancreas of NSG mice. Mice from both groups were harvested 6 weeks after implantation and subjected to necropsy. Macroscopic images of anterior (top) and posterior (bottom) liver surfaces showed higher metastatic burden in PANC eEF1A2 animals than in empty vector control (left, harvested livers). Histopathological images (H&E) of livers (black scale bar=250 μm, white scale bar=100 μm) are shown on the right. Insets depict representative metastatic lesions. Quantification of liver metastasis showed a higher metastatic burden in PANC1 eEF1A2 O.E. animals (n=4 animals analyzed per group). * P < 0.05, ** P < 0.01.
Figure 8:
Figure 8:. eEF1A2 reduction induces similar nucleolar and PNC disruption as metarrestin.
(A) Seventy-two hours after siRNA transfection into HeLa cells, eEF1A2 RNA, but not eEF1A1 RNA, was reduced, as measured by RT-PCR. (B) qRT-PCR showed a reduction of eEF1A2 RNA in siRNA-transfected cells. (C) Seventy-two hours after transfection with eEF1A2 siRNA, the amount of 5’ETS RNA was reduced, as measured by qRT-PCR. (D) Nucleolar and PNC disruption was detected using immunofluorescence in siRNA transfected cells. The PNCs in eEF1A2 knock-down cells generally showed crescent shapes (orange arrows), as well as segregated nucleoli (capping, white arrows) immunolabeled with an antibody recognizing a pre-RNA processing factor fibrillarin; n = 500 cells. Scale bar = 5 μm. (E) PNC prevalence was modestly reduced (left graph, blue bars), and the rate of nucleolar disruption was increased (right graph, blue bars). Transfection of HA-eEF1A2 (red bars) after siRNA for additional 24 hours partially rescued PNC prevalence (left graph, red bars) and nucleolar disruption (right graph, red bars). * p < 0.05, ** p < 0.01.

References

    1. Jiang WG, Sanders AJ, Katoh M, Ungefroren H, Gieseler F, Prince M, Thompson SK, Zollo M, Spano D, Dhawan P, Sliva D, Subbarayan PR, Sarkar M, Honoki K, Fujii H, Georgakilas AG, Amedei A, Niccolai E, Amin A, Ashraf SS, Ye L, Helferich WG, Yang X, Boosani CS, Guha G, Ciriolo MR, Aquilano K, Chen S, Azmi AS, Keith WN, Bilsland A, Bhakta D, Halicka D, Nowsheen S, Pantano F, Santini D, Tissue invasion and metastasis: Molecular, biological and clinical perspectives. Semin Cancer Biol 35 Suppl, S244–75 (2015). - PubMed
    1. Weber GF, Why does cancer therapy lack effective anti-metastasis drugs? Cancer Lett 328, 207–11 (2013). - PubMed
    1. Norton JT, Pollock CB, Wang C, Schink JC, Kim JJ, Huang S, Perinucleolar compartment prevalence is a phenotypic pancancer marker of malignancy. Cancer 113, 861–9 (2008a). - PMC - PubMed
    1. Matera AG, Frey MR, Margelot K, Wolin SL, A perinucleolar compartment contains several RNA polymerase III transcripts as well as the polypyrimidine tractbinding protein, hnRNP I. J Cell Biol 129, 1181–93 (1995). - PMC - PubMed
    1. Lee B, Matera AG, Ward DC, Craft J, Association of RNase mitochondrial RNA processing enzyme with ribonuclease P in higher ordered structures in the nucleolus: a possible coordinate role in ribosome biogenesis. Proc Natl Acad Sci U S A 93, 11471–6 (1996). - PMC - PubMed

Publication types

MeSH terms