. 2018 Jun 29;293(26):10245-10263.
doi: 10.1074/jbc.RA117.001290. Epub 2018 May 16.

Repeated exposure of epithelial cells to apoptotic cells induces the specific selection of an adaptive phenotype: Implications for tumorigenesis

Affiliations

Repeated exposure of epithelial cells to apoptotic cells induces the specific selection of an adaptive phenotype: Implications for tumorigenesis

Lanfei Feng et al. J Biol Chem. .

Abstract

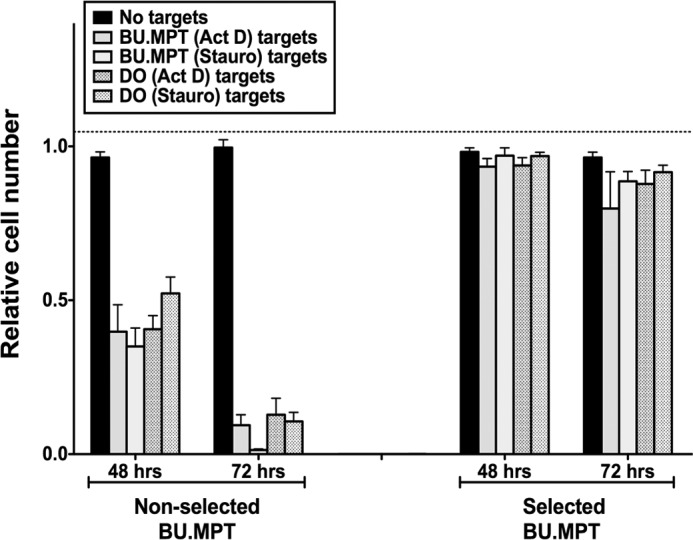
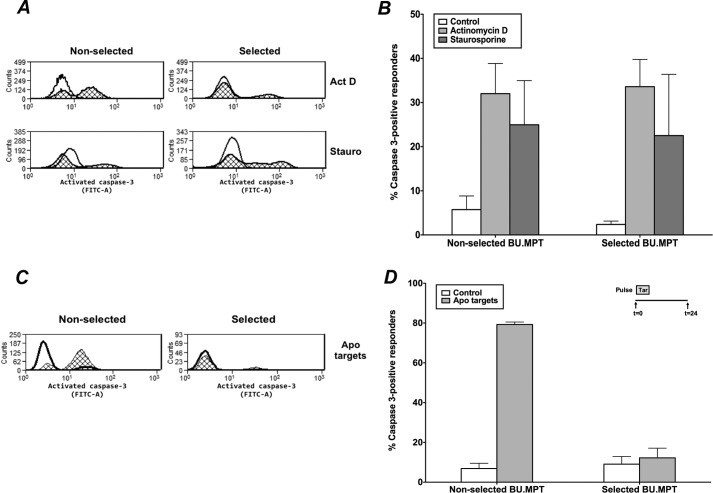
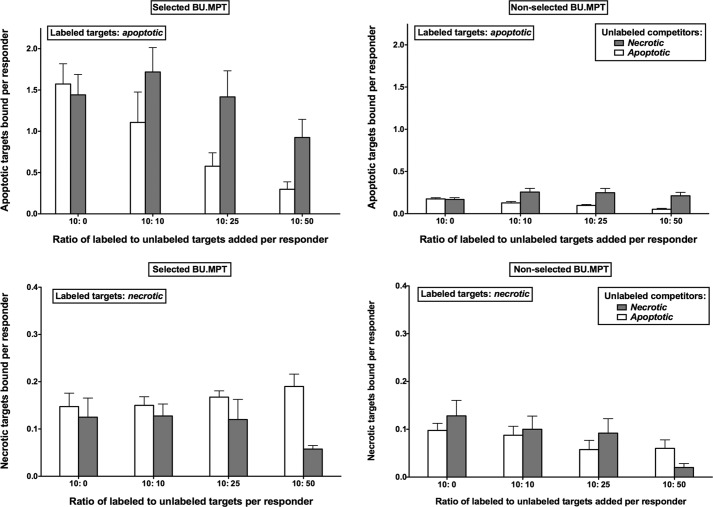
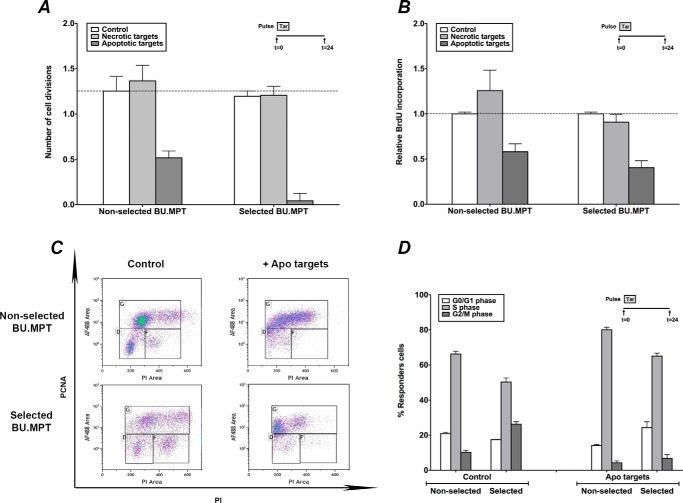
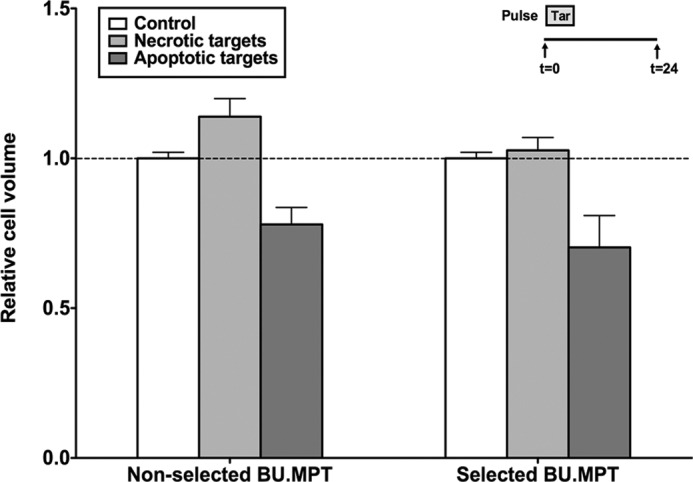
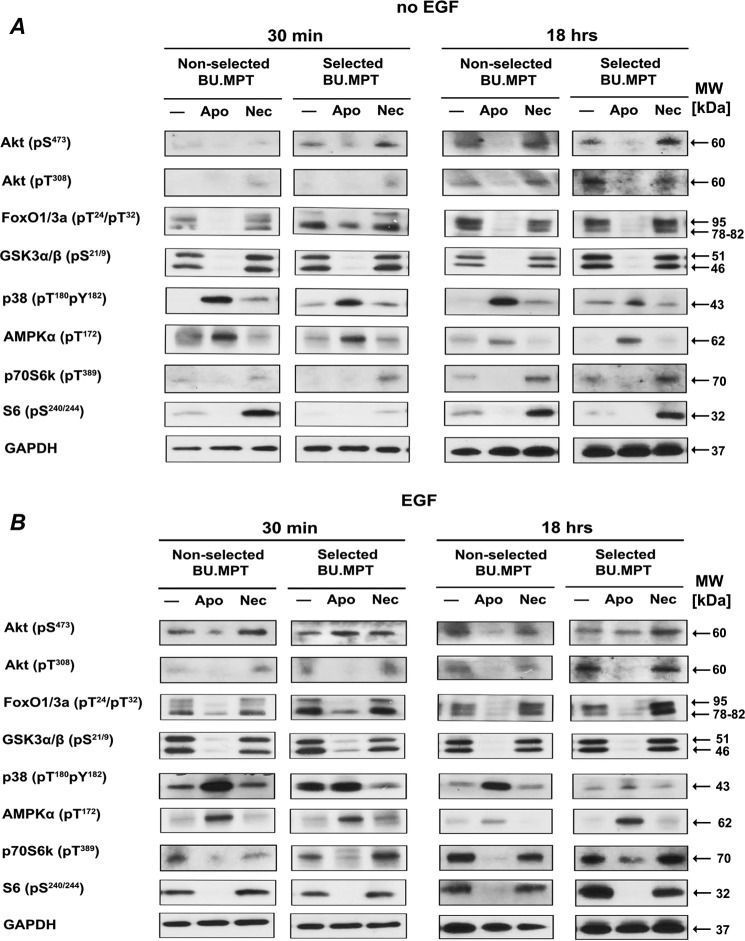
The consequences of apoptosis extend beyond the mere death of the cell. We have shown that receptor-mediated recognition of apoptotic target cells by viable kidney proximal tubular epithelial cells (PTECs) inhibits PTEC proliferation, growth, and survival. Here, we tested the hypothesis that continual exposure to apoptotic targets can induce a phenotypic change in responding PTECs, as in other instances of natural selection. In particular, we demonstrate that repeated exposure to apoptotic targets leads to emergence of a PTEC line (denoted BU.MPTSEL) resistant to apoptotic target-induced death. Resistance is exquisitely specific. Not only are BU.MPTSEL responders fully resistant to apoptotic target-induced death (∼85% survival versus <10% survival of nonselected cells) but do so while retaining sensitivity to all other target-induced responses, including inhibition of proliferation and growth. Moreover, the resistance of BU.MPTSEL responders is specific to target-induced apoptosis, as apoptosis in response to other suicidal stimuli occurs normally. Comparison of the signaling events induced by apoptotic target exposure in selected versus nonselected responders indicated that the acquired resistance of BU.MPTSEL cells lies in a regulatory step affecting the generation of the pro-apoptotic protein, truncated BH3 interacting-domain death agonist (tBID), most likely at the level of BID cleavage by caspase-8. This specific adaptation has especial relevance for cancer, in which the prominence and persistence of cell death entail magnification of the post-mortem effects of apoptotic cells. Just as cancer cells acquire specific resistance to chemotherapeutic agents, we propose that cancer cells may also adapt to their ongoing exposure to apoptotic targets.

Keywords: B-cell lymphoma 2 (Bcl-2) family; apoptosis; cancer biology; cell death; cell proliferation; cell signaling; directed evolution; epithelial cell; innate immunity; tumor microenvironment.


Conflict of interest statement

The authors declare that they have no conflicts of interest with the contents of this article

Figures

Figure 1.
Figure 1.
Repeated exposure to apoptotic targets leads to generation of a line of BU.MPT cells resistant to the apoptosis-inducing effects of apoptotic targets. A, BU.MPT cells were subjected to repeated cycles of selection, each cycle consisting of the exposure of a serum-starved confluent monolayer of BU.MPT responders to an excess of apoptotic targets (actinomycin D–induced DO cells) at a target/responder ratio of ∼10:1 for 72 h. After dead and floating cells were washed away, the remaining viable cells were cultured until confluence (later selections) or cessation of proliferation in the form of isolated colonies (earliest selections). Responders were then passaged and grown to confluence, and another cycle of selection was commenced. After each cycle, the viability of selected cells (designated BU.MPTSEL) following exposure to no targets (No targets) or apoptotic targets (Apo targets) for 6 h was determined by MTT assay and is expressed as the relative cell number surviving at 48 h (top graph) and 72 h (bottom graph). As a measure of the degree of selection, the relative survival of nonselected BU.MPT responders is shown on the left side of each graph. Absorbances (A570/650) were normalized against untreated BU.MPTSEL responder cells at 0 h, as shown by the dotted line (relative cell number equal to 1.0). All data points in the graphs represent the means of triplicate determinations. p < 0.003, BU.MPTSEL versus non-selected BU.MPT cells, 26th cycle, apoptotic targets, at 48 and 72 h; p = not significant, BU.MPTSEL responders, no targets versus apoptotic targets, at 48 and 72 h. Shown are representative data from three separate series of experiments involving repeated cycles of selection. In each instance, a resistant line of BU.MPT emerged after 5–10 selections. B, BU.MPTSEL responders underwent the indicated number of passages without exposure to apoptotic targets. At the indicated passage numbers, the viability of BU.MPTSEL responders was determined as in panel A. p = not significant, BU.MPTSEL versus non-selected BU.MPT cells at the 20th passage, 48 h after apoptotic target exposure, and at the 30th passage, 48 and 72 h after apoptotic target exposure. Error bars denote S.E.
Figure 2.
Figure 2.
Resistance of BU.MPTSEL cells extends to apoptotic targets of different lineages and suicidal stimuli. Serum-starved BU.MPTSEL or nonselected BU.MPT responder cells were exposed to apoptotic targets for 6 h. Apoptotic targets were DO or nonselected BU.MPT cells induced to undergo apoptosis by overnight treatment with actinomycin D (Act D) or staurosporine (Stauro). BU.MPT and DO targets were added at target/responder cell ratios of 1:1 or 10:1, respectively. Relative cell number surviving at 48 and 72 h was determined by MTT assay. Absorbances (A570/650) were normalized against untreated BU.MPTSEL or nonselected BU.MPT responder cells at 0 h, as shown by the dotted line (relative cell number equal to 1.0). Individual experiments represent the means of triplicate determinations, and all data points in the graph represent the mean (± S.E.) from at least three separate experiments. Absolute A570/650 values for untreated BU.MPTSEL or nonselected BU.MPT responders at 0 h were 0.925 ± 0.016 and 0.482 ± 0.009, respectively. p < 0.001, non-selected BU.MPT responders, targets of all lineages and suicidal stimuli versus no targets, at 48 and 72 h; p = not significant, BU.MPTSEL responders, targets of all lineages and suicidal stimuli versus no targets, at 48 and 72 h. Error bars denote S.E.
Figure 3.
Figure 3.
BU.MPTSEL cells are resistant to target-induced apoptosis but not to other suicidal stimuli. Serum-starved BU.MPTSEL or nonselected BU.MPT cells received no suicidal stimulus (Control) or were induced to undergo apoptosis with one of the following suicidal stimuli: A and B, treatment with actinomycin D (Act D) or staurosporine (Stauro); C and D, exposure to apoptotic targets (actinomycin D–treated DO cells) at a target/responder cell ratio of 10:1 for 2 h, followed by overnight culture (Apo targets). Following the suicidal stimulus, induction of apoptosis was assessed by cytofluorometric analysis of permeabilized cells for activated caspase-3 (FITC-A, x axis). A and C, shown are representative flow cytometric analyses of BU.MPTSEL and nonselected BU.MPT cells, either in the absence of a suicidal stimulus (open histograms) or following treatment with actinomycin D or staurosporine (cross-hatched histograms) (A) or exposure to apoptotic targets (cross-hatched histograms) (C). B and D, graphs depict the mean (± S.E.) from three separate cytofluorometric analyses of the percentage of BU.MPTSEL and nonselected BU.MPT cells positive for activated caspase-3 after receiving no stimulus or the indicated suicidal stimulus. B, p < 0.05, BU.MPTSEL cells, actinomycin D and staurosporine versus control; nonselected BU.MPT cells, actinomycin D and staurosporine versus control; p = not significant, BU.MPTSEL versus nonselected BU.MPT cells, for both actinomycin D and staurosporine. D, p < 0.01, BU.MPTSEL versus nonselected BU.MPT cells, apoptotic targets; p = not significant, BU.MPTSEL cells, control versus apoptotic targets. Error bars denote S.E.
Figure 4.
Figure 4.
Resistance of BU.MPTSEL cells to target-induced death is not due to loss of receptors for apoptotic targets. Serum-starved BU.MPTSEL or nonselected BU.MPT monolayers (∼105 cells/well) were assessed for recognition and binding of CFDA-SE–labeled apoptotic (apoptotic) and necrotic (necrotic) DO target cells, in the presence or absence of unlabeled dead target competitors, after incubation together for 6 h at 37 °C. Labeled targets (10 × 105 cells/well) were mixed with unlabeled apoptotic or necrotic competitors at the indicated ratios. The number of target cells bound was determined by quantifying CFDA-SE fluorescence (λEx = 490 nm; λEm = 525 nm), as described under “Experimental procedures.” Individual experiments represent the means of triplicate determinations, and all data points in the graphs represent the means (± S.E.) from at least three experiments. p < 0.00005, BU.MPTSEL versus non-selected BU.MPT cells, with labeled apoptotic targets and no competitor; p = not significant, BU.MPTSEL versus non-selected BU.MPT cells, with labeled necrotic targets and no competitor; p < 0.05, BU.MPTSEL and non-selected BU.MPT cells, with labeled apoptotic targets, one-way analysis of variance for dependence of binding on number of unlabeled apoptotic competitors. Error bars denote S.E.
Figure 5.
Figure 5.
Resistance of BU.MPTSEL cells to target-induced death is not due to impaired phagocytosis of apoptotic targets. A, serum-starved responder cells, either BU.MPTSEL or nonselected BU.MPT cells, were labeled with CMTMR (PE-h, y axis) and pre-incubated for 2 h in the absence (−) or presence (+) of cytochalasin D (2 μm). Apoptotic targets (DO cells induced to undergo apoptosis by treatment with actinomycin D) were pre-labeled with CFDA-SE (FITC-h, x axis) and added to responders at a target/responder cell ratio of 10:1. After incubation together for 2.5 h, cytofluorometric analysis was performed on the total cell population. Apoptotic targets that were bound to responder cells, but not yet engulfed, were detached by treatment with 0.4 mm EDTA and did not remain bound during analysis. CMTMR-positive CFDA-SE–positive double-labeled cells in the right upper quadrant indicate responders that have engulfed at least one apoptotic target. CMTMR-positive single-labeled cells in the left upper quadrant indicate responder cells that have not ingested an apoptotic target. The percentage of the total CMTMR-positive responder cells falling in each of these two quadrants is indicated. CFDA-SE–positive single-labeled cells in the right lower quadrant indicate nonengulfed apoptotic targets. Shown are representative flow cytometric analyses for nonselected BU.MPT (upper panels) and BU.MPTSEL (lower panels) responders. B, graph depicts the mean (± S.E.) from three separate flow cytometric analyses of the percentage of nonselected BU.MPT versus selected BU.MPT responder cells engulfing at least one apoptotic target in the absence (Control) or presence of cytochalasin D (Cytochalasin D). p < 0.02, BU.MPTSEL cells, absence versus presence of cytochalasin D; p < 0.05, BU.MPTSEL versus non-selected BU.MPT cells, absence of cytochalasin D; p = not significant, BU.MPTSEL versus non-selected BU.MPT cells, presence of cytochalasin D. Error bars (B) denote S.E.
Figure 6.
Figure 6.
Resistance of BU.MPTSEL cells is limited to target-induced death, without effect on target-induced inhibition of proliferation. Serum-starved BU.MPTSEL and nonselected BU.MPT responder cells were exposed to no targets (Control), or apoptotic (Apoptotic targets) or necrotic (Necrotic targets) targets at a target/responder cell ratio of 10:1 for 2 h. The source of apoptotic targets was actinomycin D–treated DO cells. Proliferation of responders was assessed at 24 h after target exposure by either cytofluorometric analysis of the reduction in CFDA-SE staining (A), immunoassay of BrdU incorporation (B), or cytofluorimetric analysis of PCNA abundance (C and D). A, graph depicts the mean (± S.E.) from three separate cytofluorometric analyses of the cumulative number of cell divisions within 24 h, as determined by Equation 1 shown under “Experimental procedures.” p < 0.05, non-selected BU.MPT cells, apoptotic targets versus no targets; p < 0.01, BU.MPTSEL cells, apoptotic targets versus no targets; p < 0.02, BU.MPTSEL versus non-selected BU.MPT cells, apoptotic targets. B, graph depicts BrdU incorporation during the 24 h after target exposure. Absorbances (A450) were normalized against BU.MPTSEL or nonselected BU.MPT responder cells exposed to no targets (Control), as shown by the dotted line (relative BrdU incorporation equal to 1.0). Individual experiments represent the means of duplicate determinations, and all data points in the graph represent the mean (± S.E.) from five separate experiments. C, shown are representative flow cytometric analyses for nonselected BU.MPT (upper panels) and BU.MPTSEL (lower panels) responders, exposed to no targets (Control), or apoptotic targets (Apo targets), and stained for PCNA and PI. PCNA-positive cells are indicated by the upper gate and correspond roughly to cells in S phase of the cell cycle, having DNA content between 2× and 4×. PCNA-negative cells having 2× DNA, as indicated by the lower left gate, correspond roughly to cells in the G0/G1 phase of the cell cycle, and PCNA-negative cells having 4× DNA, as indicated by the lower right gate, correspond roughly to cells in the G2/M phase of the cell cycle. D, graph depicts the mean (± S.E.) from three separate experiments of the percentage of responder cells in each of the phases of the cell cycle. p < 0.01, apoptotic targets versus no targets, for all phases of cell cycle and for both nonselected BU.MPT and BU.MPTSEL responders. Tar, target(s). Error bars (A, B, and D) denote S.E.
Figure 7.
Figure 7.
Resistance of BU.MPTSEL cells is limited to target-induced death, without effect on target-induced inhibition of growth. Serum-starved BU.MPTSEL and nonselected BU.MPT responder cells were exposed to no targets (Control) or apoptotic (Apoptotic targets) or necrotic (Necrotic targets) targets at a target/responder cell ratio of 10:1 for 2 h. The source of apoptotic targets was actinomycin D–treated DO cells. Relative cell size of BU.MPTSEL and nonselected BU.MPT responder cells was determined at 0 h prior to target exposure and at 24 h after exposure by flow cytometric analysis of the forward scatter of responder cells in G1 phase of the cell cycle. Within each analysis, experimental values at 24 h were normalized to the mean forward scatter of control responders at 0 h prior to target exposure. The graph depicts the mean (± S.E.) from three separate flow cytometric analyses of the relative cell size of responder cells in G1 phase of the cell cycle at 24 h following target exposure. p < 0.05, BU.MPTSEL cells and non-selected BU.MPT cells, apoptotic targets versus no targets; p = not significant, BU.MPTSEL versus non-selected BU.MPT cells, apoptotic targets. Tar, target(s). Error bars denote S.E.
Figure 8.
Figure 8.
BU.MPTSEL cells retain the immunohistochemical features of PTEC. Immunohistochemical analyses were performed on serum-starved BU.MPTSEL and nonselected BU.MPT cells grown as adherent monolayers on charged glass slides, followed by fixation with either ethanol or formalin. Representative images are shown for each of the following: specific PTEC markers CD10 (CD10) and CD13 (CD13); the mesenchymal marker vimentin (Vimentin); and epithelial cytokeratins (CKs), either CK8 plus CK18 (CK8/18) or a broad panel of CKs minus CK18 (pan-CK), including CK1–8, -10, -14–16, and -19. Specific detection was performed using 3,3′-diaminobenzidine as a chromogen. All slides were then counterstained with hematoxylin. Low power images are ×200 original magnification, and higher power insets are ×400.
Figure 9.
Figure 9.
Overall pattern of intracellular signaling events induced by exposure to apoptotic targets is unchanged in BU.MPTSEL cells. Serum-starved BU.MPTSEL or nonselected BU.MPT responder cells were stimulated with no targets (−) or apoptotic (Apo) or necrotic (Nec) targets at a target/responder cell ratio of 1:1 for 30 min and then washed. The source of apoptotic targets was staurosporine-treated nonselected BU.MPT cells. For studies without EGF (A), responders were cultured for an additional 15 min or 18 h after target stimulation before harvesting for lysates. For studies with EGF (B), before harvesting for lysates, responders received a 15-min stimulation with EGF (50 nm) either immediately after target stimulation or after an additional 18 h of culture in the absence of targets. In all cases, targets and nonadherent responder cells were removed by washing, and responder cell lysates were probed with anti-phosphorylated Akt, FoxO1/3a, GSK3α/β, p38, AMPK α-chain, p70S6K, and S6 antibodies as shown. Equal loading among whole-cell lysates for BU.MPTSEL or nonselected BU.MPT responder cells at each of the two time points was confirmed by probing for total GAPDH. Only the overall pattern of signaling events (i.e. increased or decreased phosphorylation as compared with an absence of targets) was contrasted for BU.MPTSEL versus nonselected BU.MPT responders and not differences in the magnitude of responses between the two cell lines, as these were in general minor and inconsistent. Shown is a representative set of blots from three separate experiments. Gaps between lanes exist for clarity of presentation or because lanes were noncontiguous on the original immunoblot.
Figure 10.
Figure 10.
Resistance of BU.MPTSEL cells to target-induced death is associated with a failure to activate BID. Serum-starved BU.MPTSEL or nonselected BU.MPT responder cells were stimulated with no targets (−) or apoptotic (Apo) or necrotic (Nec) targets at a target/responder cell ratio of 1:1 for 30 min and then washed. The source of apoptotic targets was staurosporine-treated nonselected BU.MPT cells. For studies without EGF (A), responders were cultured for an additional 15 min or 18 h after target stimulation before harvesting for lysates. For studies with EGF (B), before harvesting for lysates, responders received a 15-min stimulation with EGF (50 nm) either immediately after target stimulation or after an additional 18 h of culture in the absence of targets. In all cases, targets and nonadherent responder cells were removed by washing, and responder cell lysates were probed with antibodies detecting the p43 and p18 fragments of caspase-8, c-FLIP, BID, and tBID as shown. Equal loading among whole-cell lysates for BU.MPTSEL or nonselected BU.MPT responder cells at each of the two time points was confirmed by probing for total GAPDH. Only the overall pattern of signaling events (i.e. increased or decreased expression as compared with an absence of targets) was contrasted for BU.MPTSEL versus nonselected BU.MPT responders and not differences in the magnitude of expression between the two cell lines, as these were in general minor and inconsistent. Shown is a representative set of blots from three separate experiments. Gaps between lanes exist for clarity of presentation or because lanes were noncontiguous on the original immunoblot.
Figure 11.
Figure 11.
Expression level of a panel of mitochondrial proteins downstream of tBID is unchanged in BU.MPTSEL cells. Serum-starved BU.MPTSEL or nonselected BU.MPT responder cells were stimulated with no targets (−), or apoptotic (Apo) or necrotic (Nec) targets at a target/responder cell ratio of 1:1 for 30 min and then washed. The source of apoptotic targets was staurosporine-treated nonselected BU.MPT cells. For studies without EGF (left panels), responders were cultured for an additional 15 min or 18 h after target stimulation before harvesting for lysates. For studies with EGF (right panels), before harvesting for lysates, responders received a 15-min stimulation with EGF (50 nm) either immediately after target stimulation or after an additional 18 h of culture in the absence of targets. In all cases, targets and nonadherent responder cells were removed by washing, and responder cell lysates were probed with antibodies detecting BAX, BAK, Bcl-2, Bcl-xL, hexokinase I, hexokinase II, and VDAC, as shown. Equal loading among whole-cell lysates for BU.MPTSEL or nonselected BU.MPT responder cells was confirmed by probing for total cellular GAPDH and total mitochondrial COX IV. Only the overall pattern of signaling events (i.e. increased or decreased expression as compared with an absence of targets) was contrasted for BU.MPTSEL versus nonselected BU.MPT responders and not differences in the magnitude of expression between the two cell lines, as these were in general minor and inconsistent. Shown is a representative set of blots from three separate experiments. Gaps between lanes exist for clarity of presentation or because lanes were noncontiguous on the original immunoblot.
Figure 12.
Figure 12.
Resistance to BID cleavage is specific to apoptotic targets, as cleavage occurs normally in response to other inducers of apoptosis. Serum-starved BU.MPTSEL or nonselected BU.MPT responder cells received no suicidal stimulus (−) or were induced to undergo apoptosis by one of the following suicidal stimuli: exposure to apoptotic targets (staurosporine-treated nonselected BU.MPT cells) at a target/responder cell ratio of 1:1 for 2 h, followed by overnight culture (Apo); treatment with actinomycin D (ActD); treatment with staurosporine (Stauro); or UV-B irradiation (20–50 mJ/cm2) (UV). Following treatment with suicidal stimuli, nonadherent responder cells were removed by washing, and responder cell lysates were separated into cytosolic and mitochondrial fractions. Cytosolic fractions were probed with antibodies detecting the p43 fragment of caspase-8 and BID, and the mitochondrial fractions were probed for tBID. Equal loading among cytosolic and mitochondrial lysates was confirmed by probing for total GAPDH and total mitochondrial VDAC, respectively. Only the overall pattern of signaling events (i.e. increased or decreased expression as compared with an absence of targets) was contrasted for BU.MPTSEL versus nonselected BU.MPT responders and not differences in the magnitude of expression between the two cell lines, as these were in general minor and inconsistent. Shown is a representative set of blots from three separate experiments. Gaps between lanes exist for clarity of presentation or because lanes were noncontiguous on the original immunoblot.

Similar articles

References

    1. Peter C., Wesselborg S., Herrmann M., and Lauber K. (2010) Dangerous attraction: phagocyte recruitment and danger signals of apoptotic and necrotic cells. Apoptosis 15, 1007–1028 10.1007/s10495-010-0472-1 - DOI - PubMed
    1. Zitvogel L., Kepp O., and Kroemer G. (2010) Decoding cell death signals in inflammation and immunity. Cell 140, 798–804 10.1016/j.cell.2010.02.015 - DOI - PubMed
    1. Hochreiter-Hufford A., and Ravichandran K. S. (2013) Clearing the dead: apoptotic cell sensing, recognition, engulfment, and digestion. Cold Spring Harb. Perspect. Biol. 5, a008748 10.1101/cshperspect.a008748 - DOI - PMC - PubMed
    1. Medina C. B., and Ravichandran K. S. (2016) Do not let death do us part: ‘find-me’ signals in communication between dying cells and the phagocytes. Cell Death Differ. 23, 979–989 10.1038/cdd.2016.13 - DOI - PMC - PubMed
    1. Voll R. E., Herrmann M., Roth E. A., Stach C., Kalden J. R., and Girkontaite I. (1997) Immunosuppressive effects of apoptotic cells. Nature 390, 350–351 10.1038/37022 - DOI - PubMed

Publication types

LinkOut - more resources