. 2018 Jul 17;92(15):e02202-17.
doi: 10.1128/JVI.02202-17. Print 2018 Aug 1.

Differential Responses by Human Respiratory Epithelial Cell Lines to Respiratory Syncytial Virus Reflect Distinct Patterns of Infection Control

Affiliations

Differential Responses by Human Respiratory Epithelial Cell Lines to Respiratory Syncytial Virus Reflect Distinct Patterns of Infection Control

Philippa Hillyer et al. J Virol. .

Abstract

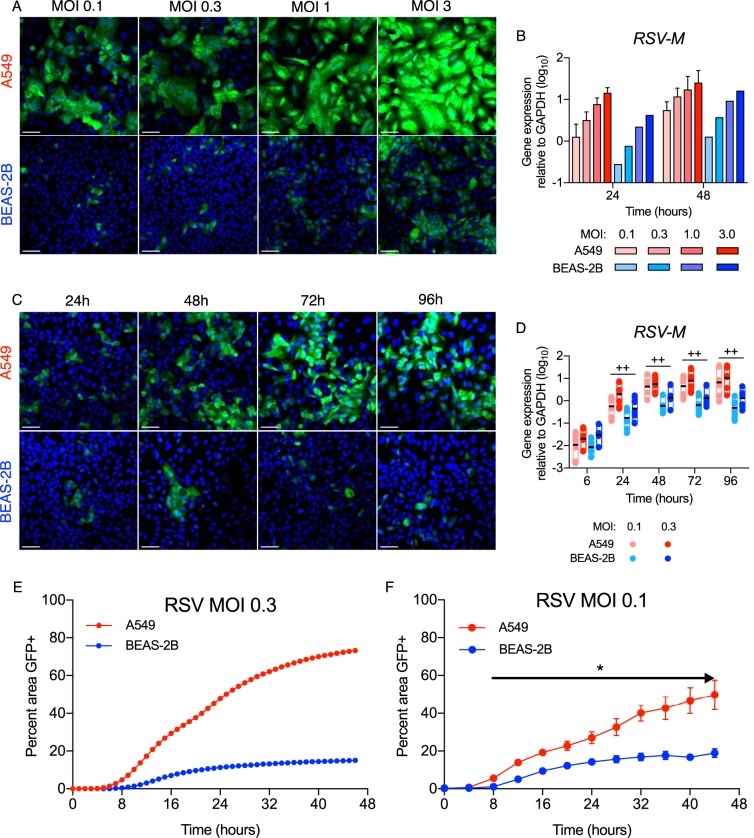
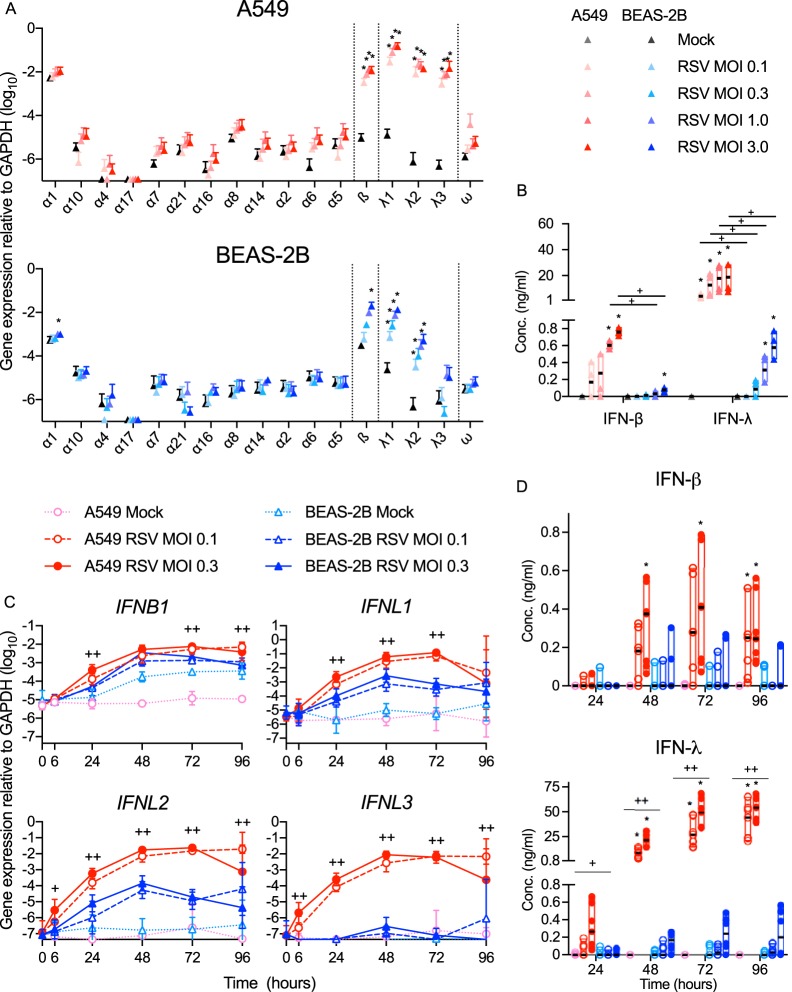
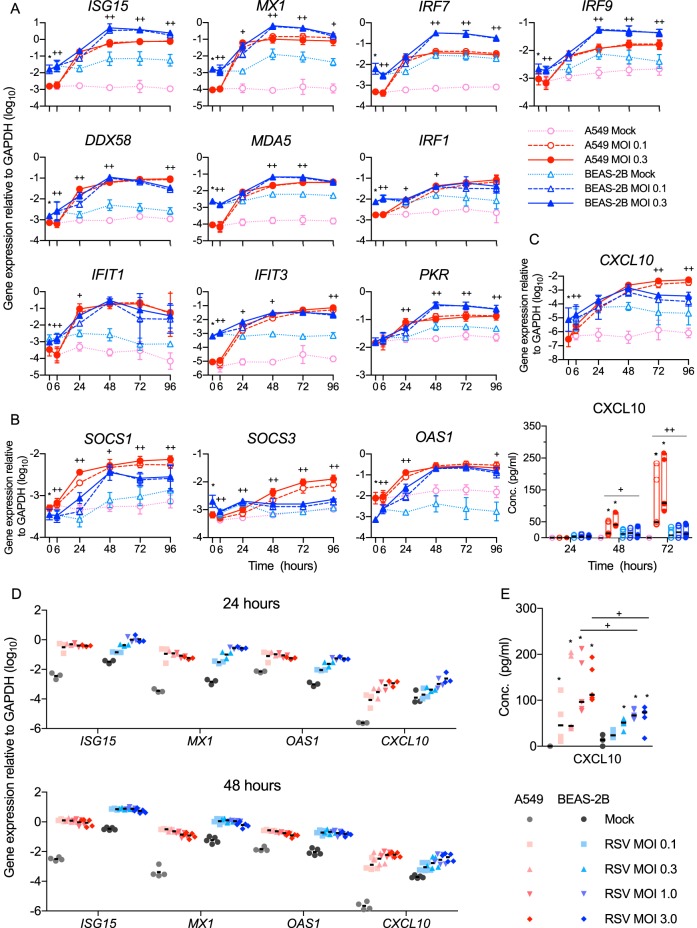
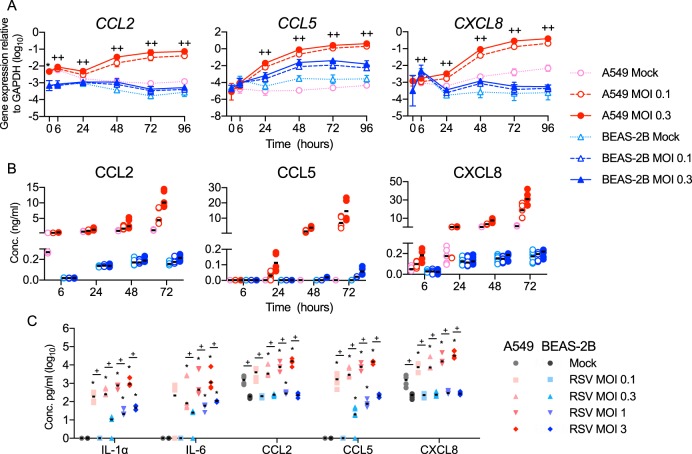
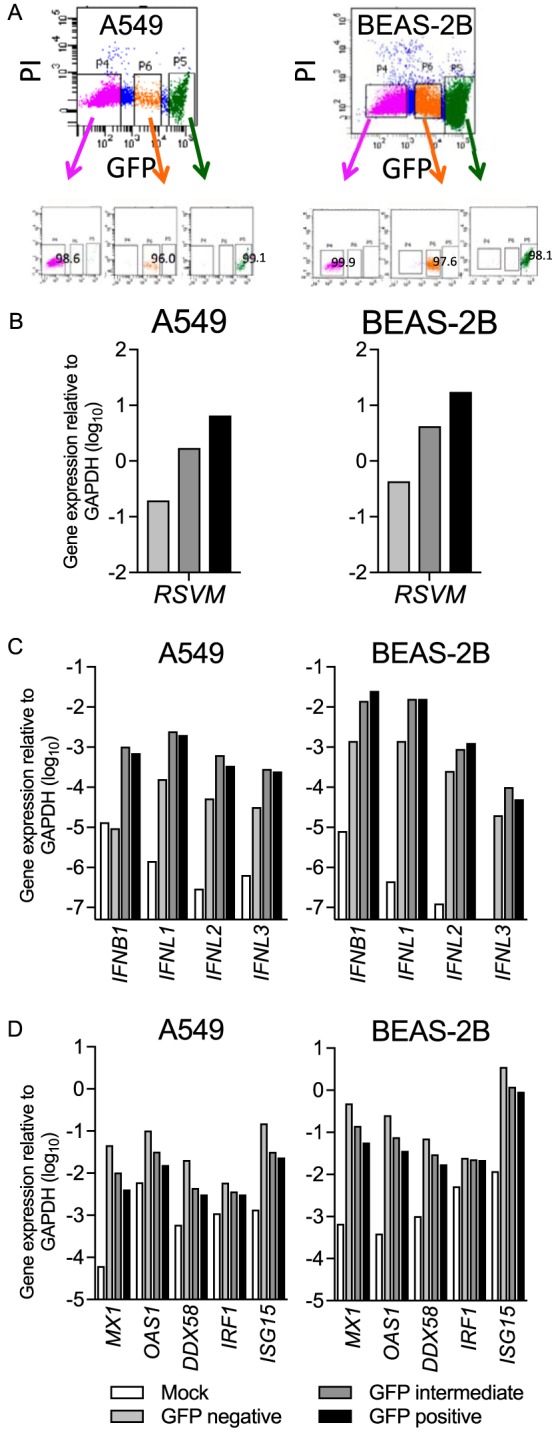
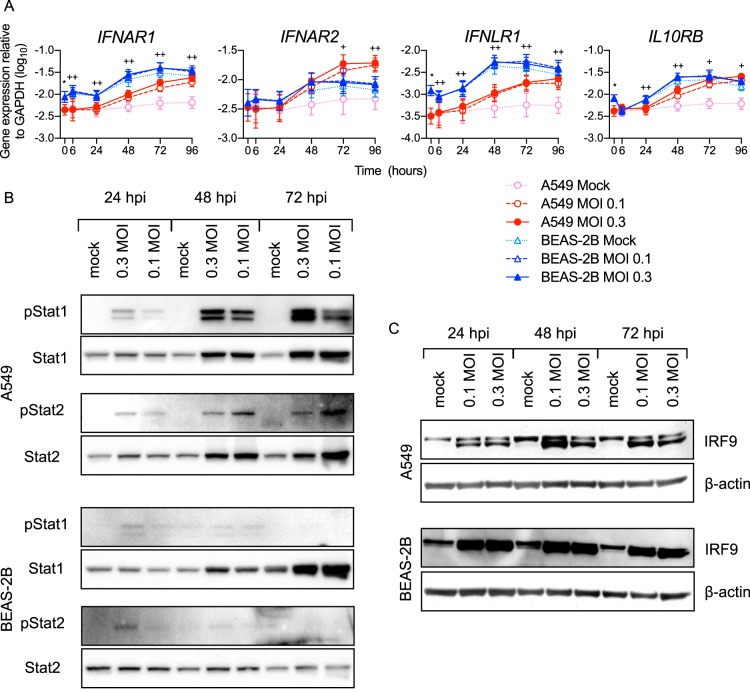
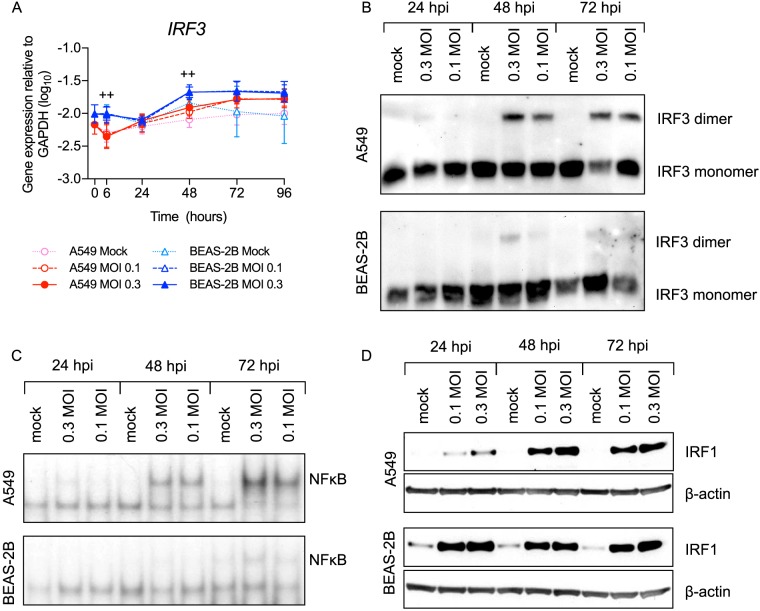
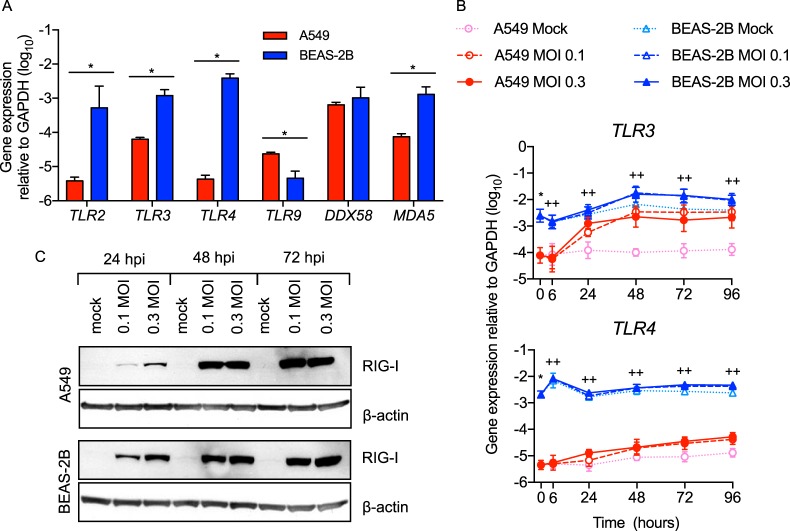
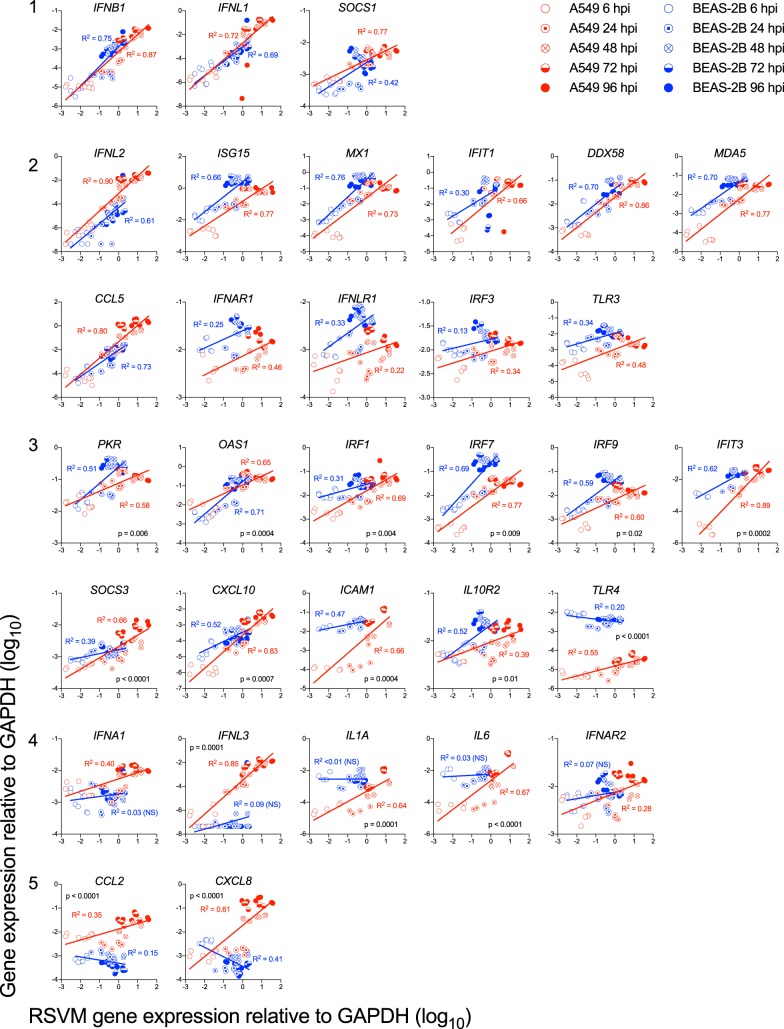
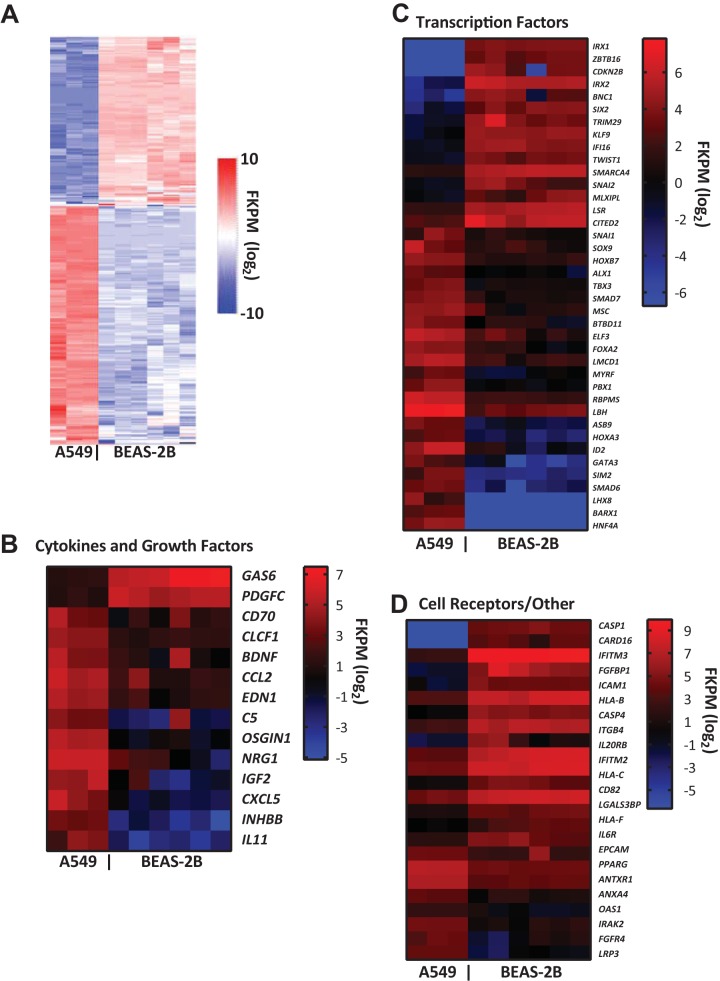
Respiratory syncytial virus (RSV) infects small foci of respiratory epithelial cells via infected droplets. Infection induces expression of type I and III interferons (IFNs) and proinflammatory cytokines, the balance of which may restrict viral replication and affect disease severity. We explored this balance by infecting two respiratory epithelial cell lines with low doses of recombinant RSV expressing green fluorescent protein (rgRSV). A549 cells were highly permissive, whereas BEAS-2B cells restricted infection to individual cells or small foci. After infection, A549 cells expressed higher levels of IFN-β-, IFN-λ-, and NF-κB-inducible proinflammatory cytokines. In contrast, BEAS-2B cells expressed higher levels of antiviral interferon-stimulated genes, pattern recognition receptors, and other signaling intermediaries constitutively and after infection. Transcriptome analysis revealed that constitutive expression of antiviral and proinflammatory genes predicted responses by each cell line. These two cell lines provide a model for elucidating critical mediators of local control of viral infection in respiratory epithelial cells.IMPORTANCE Airway epithelium is both the primary target of and the first defense against respiratory syncytial virus (RSV). Whether RSV replicates and spreads to adjacent epithelial cells depends on the quality of their innate immune responses. A549 and BEAS-2B are alveolar and bronchial epithelial cell lines, respectively, that are often used to study RSV infection. We show that A549 cells are permissive to RSV infection and express genes characteristic of a proinflammatory response. In contrast, BEAS-2B cells restrict infection and express genes characteristic of an antiviral response associated with expression of type I and III interferons. Transcriptome analysis of constitutive gene expression revealed patterns that may predict the response of each cell line to infection. This study suggests that restrictive and permissive cell lines may provide a model for identifying critical mediators of local control of infection and stresses the importance of the constitutive antiviral state for the response to viral challenge.

Keywords: cytokine; cytokines; interferon; interferon regulatory factor (IRF); interferon-stimulated genes; interferons; respiratory epithelial cells; respiratory syncytial virus.


Figures

FIG 1
FIG 1
rgRSV spreads in A549 cells, but not BEAS-2B cells. A549 and BEAS-2B cells were grown on coverslips and infected with rgRSV (mock infection was medium only), incubated for the indicated times, and stained with Hoechst 33258 for confocal imaging. RNA and supernatants were harvested from parallel cultures. (A and B) Dose response of rgRSV at 48 hpi. The confocal images represent the results of one of three experiments (A) and were supported by RT-qPCR of the RSV M gene at 24 (n = 3) and 48 (n = 5) hpi (B). (C and D) (C) Time course of rgRSV infection at an MOI of 0.1. The data represent the results of one of three experiments. (D) Differences between the cell lines were supported by RT-qPCR of the RSV M gene in A549 or BEAS-2B cells (n = 8) at MOIs of 0.1 and 0.3. The boxes and black line indicate the range and geometric mean. Statistical differences between infected cell lines at each time point were calculated using a one-way ANOVA model without adjustment for mock infection on log10-transformed values, as described in Materials and Methods. ++, P < 0.05 for A549 compared to BEAS-2B at MOIs of 0.1 and 0.3. (E and F) Confluent cultures of A549 and BEAS-2B cells were infected with RSV, and fluorescence images were captured each hour from 0 to 44 hpi to create time lapse videos (see Movies S1 and S2 in the supplemental material). (E) Hourly measurements of percentages of the area of the confluent culture infected at an MOI of 0.3 that were GFP+. (F) Summary data for BEAS-2B and A549 confluent cultures (n = 7 and 18, respectively) infected at an MOI of 0.1. Differences between the cell lines were analyzed for each time point by multiple t tests according to the Holm-Sidak method. *, P < 0.0001 (for each time point from 8 hpi through 44 hpi). The error bars indicate standard deviations (SD).
FIG 2
FIG 2
RSV-infected A549 cells express higher levels of IFN-β and IFN-λ than BEAS-2B cells. A549 and BEAS-2B cells were mock infected (medium only) or infected with rgRSV. Type I (IFN-α, -β, and -ω) and III (IFN-λs) IFN subtype gene expression was quantified using RT-qPCR, and IFNs in supernatants were measured by ELISA. (A) IFN subtype gene expression 48 h following RSV infection at the MOI indicated. The data are expressed as means and SD. Statistical differences between mock infection and each infection dose were calculated by t test on log10 values after Dunnett's correction for multiple comparisons. *, P < 0.05 compared to mock infection. (B) Dose effect of RSV MOI on IFN-β and IFN-λ in supernatants 48 hpi (the legend is the same for panels A and B). The black horizontal lines indicate the medians. Statistical differences were calculated by the Mann-Whitney test. *, P < 0.05 compared to mock infection; +, P < 0.05 compared to BEAS-2B cells infected with the same dose. A549 and BEAS-2B cells were mock infected (medium only) or infected for the indicated times at an MOI of 0.1 or 0.3. (C) IFN gene expression over time. The data are expressed as means and SD. Statistical differences between infected cell lines at each time point were calculated using a one-way ANOVA model without adjustment for mock infection on log10-transformed values as described in Materials and Methods. ++, P < 0.05 for A549 compared to BEAS-2B at MOIs of 0.1 and 0.3; +, P < 0.05 at an MOI of either 0.1 or 0.3. (D) IFN protein expression over time (the legends are the same for panels C and D). The medians are indicated by black horizontal lines. Statistical differences were calculated by the Mann-Whitney test. *, P < 0.05 compared to mock infection; ++, P < 0.05 for A549 compared to BEAS-2B at MOIs of 0.1 and 0.3; +, P < 0.05 at an MOI of either 0.1 or 0.3. The data shown are from three (A and B) or four (C and D) experiments performed in duplicate (n = 6 and 8, respectively).
FIG 3
FIG 3
BEAS-2B cells express higher levels of antiviral ISGs than A549 cells after RSV infection. A549 or BEAS-2B cells were mock infected (medium only) or infected for the indicated times at an MOI of 0.1 or 0.3 (A to C) or infected for 24 or 48 h at the indicated MOI (D and E). Gene expression was quantified using RT-qPCR (A to D), and concentrations of CXCL10 in supernatants were measured by bead array (C and E). (A) ISGs expressed at higher levels by BEAS-2B cells constitutively (i.e., 0 hpi) or after RSV infection. (B) ISGs expressed at higher levels by A549 cells either constitutively or after RSV infection. (C) Expression of CXCL10 transcript (top) and protein (bottom). (A to C) The data shown are from four experiments, each performed in duplicate. (D and E) Expression of ISGs (D) and CXCL10 protein (E) in response to increasing doses of RSV at 24 (n = 3) and 48 (n = 5) hpi. (A to D) Gene expression data are shown as means ± SD. (A to C) Statistical differences between cell lines at each time point were calculated using a one-way ANOVA model without adjustment for mock infection on log10-transformed values as described in Materials and Methods. *, P < 0.05 for A549 compared to BEAS-2B mock infection at 0 hpi; ++, P < 0.05 for A549 compared to BEAS-2B at MOIs of 0.1 and 0.3; +, P < 0.05 at an MOI of either 0.1 or 0.3. (C and E) The median protein concentrations are indicated by black horizontal lines. Statistical differences were calculated by the Mann-Whitney test. (C) *, P < 0.05 compared to mock infection; ++, P < 0.05 for A549 compared to BEAS-2B at MOIs of 0.1 and 0.3; +, P < 0.05 at an MOI of 0.1 or 0.3. (E) *, P < 0.05 compared to mock infection; +, P < 0.05 when A549 and BEAS-2B cells were compared at the same infective dose.
FIG 4
FIG 4
BEAS-2B cells express lower levels of proinflammatory cytokines and chemokines than A549 cells after RSV infection. A549 and BEAS-2B cells were mock infected (medium only) or infected for the indicated times at an MOI of 0.1 or 0.3 (A and B) or infected for 48 h at the indicated MOI (C). Gene expression was quantified using RT-qPCR (A), and concentrations of mediators in supernatants were measured by bead array (B and C). (A) Gene expression of proinflammatory chemokines. The data are shown as means ± SD. Statistical differences between cell lines at each time point were calculated using a one-way ANOVA model without adjustment for mock infection on log10-transformed values as described in Materials and Methods. *, P < 0.05 for A549 compared to BEAS-2B mock infection at 0 hpi; ++, P < 0.05 for A549 compared to BEAS-2B at MOIs of 0.1 and 0.3; +, P < 0.05 at an MOI of either 0.1 or 0.3. (B and C) Median protein concentrations are indicated by black horizontal lines. Statistical differences were calculated by the Mann-Whitney test. (C) *, P < 0.05 compared to mock infection; +, P < 0.05 when A549 and BEAS-2B cells were compared at the same infective dose. (B) All differences between the two cell lines at an RSV MOI of 0.3 were statistically significant. The data shown are from three (C) or four (A and B) experiments, each performed in duplicate.
FIG 5
FIG 5
Gene expression of RSV M, IFNs, and ISGs in separate populations of rgRSV-infected A549 and BEAS-2B cells. A549 and BEAS-2B cells were mock infected or infected with rgRSV at an MOI of 1 for 24 or 48 h, respectively. Infected cultures of each cell type were sorted into three populations, GFP negative, GFP intermediate, and GFP high. RNAs from uninfected cultures (Mock) and each of the three sorted populations were harvested immediately. (A) Gating strategy for the sort and postsort purity of each population. PI, propidium iodide. (B to D) Gene expression of RSV M (B), IFNs (C), and ISGs (D) was quantified using RT-qPCR. One representative experiment of three is shown.
FIG 6
FIG 6
Components of the IFN signaling pathway differ between RSV-infected A549 and BEAS-2B cells. A549 or BEAS-2B cells were mock infected (medium only) or infected with rgRSV at an MOI of 0.1 or 0.3 for the indicated times. (A) Interferon receptor gene expression was measured by RT-qPCR. The data shown are means ± SD from the results of four experiments performed in duplicate. Statistical differences between cell lines at each time point were calculated using a one-way ANOVA model without adjustment for mock infection on log10-transformed values as described in Materials and Methods. *, P < 0.05 for A549 compared to BEAS-2B mock infection at 0 h; ++, P < 0.05 for A549 compared to BEAS-2B at MOIs of 0.1 and 0.3; +, P < 0.05 at an MOI of either 0.1 or 0.3. (B and C) Phosphorylated and total STAT1 and STAT2 expression (B) and total IRF9 expression (C) were measured by Western blotting. The data represent the results of experiments on two separate cultures.
FIG 7
FIG 7
RSV-infected BEAS-2B cells express more IRF-1 but activate less IRF-3 and NF-κB than A549 cells. A549 or BEAS-2B cells were mock infected (medium only) or infected with rgRSV at an MOI of 0.1 or 0.3 for the indicated times. (A) Transcription factor gene expression was measured by RT-qPCR. The data shown are means ± SD from the results of four experiments performed in duplicate. Statistical differences between cell lines at each time point were calculated using a one-way ANOVA model without adjustment for mock infection on log10-transformed values as described in Materials and Methods. *, P < 0.05 for A549 compared to BEAS-2B mock infection at 0 h; ++, P < 0.05 for A549 compared to BEAS-2B at MOIs of 0.1 and 0.3; +, P < 0.05 at an MOI of either 0.1 or 0.3. (B and D) IRF3 dimerization (B) and IRF1 protein expression (D) were measured by Western blotting. The data represent the results of experiments on two separate cultures. (C) EMSA was performed to determine NF-κB activation.
FIG 8
FIG 8
Uninfected and RSV-infected BEAS-2B cells express higher levels of critical pattern recognition receptors than A549 cells. (A) TLR and RIG-I-like receptor (RLR) gene expression was measured by RT-qPCR in uninfected A549 or BEAS-2B cells. The data shown are means and SD. Statistical differences were calculated by t test on log10 values after Bonferroni's correction for multiple comparisons. *, P < 0.05 by t test on log10 data. (B) A549 and BEAS-2B cells were mock infected (medium only) or infected with rgRSV at an MOI of 0.1 or 0.3 for 0, 6, 24, 48, 72, or 96 h. The data shown are means ± SD from four experiments performed in duplicate. Statistical differences between cell lines at each time point were calculated using a one-way ANOVA model without adjustment for mock infection on log10-transformed values as described in Materials and Methods. *, P < 0.05 for A549 compared to BEAS-2B mock infection at 0 hpi; ++, P < 0.05 for A549 compared to BEAS-2B at MOIs of 0.1 and 0.3; +, P < 0.05 at an MOI of either 0.1 or 0.3. (C) RIG-I protein expression following infection at an MOI of 0.1 or 0.3 for 24, 48, and 72 h was determined by Western blotting. The data shown are from one of two biological replicates.
FIG 9
FIG 9
Correlations of RSV M gene with host innate immune genes. A549 or BEAS-2B cells were infected at an MOI of 0.1 for the indicated times. Gene expression was quantified by RT-qPCR. Linear regression was used to calculate and compare the slopes and intercepts. The graphs are grouped according to patterns of correlations as described in the text.
FIG 10
FIG 10
Differential constitutive gene expression by BEAS-2B and A549 cells. Differentially expressed genes were determined according to the following criteria: FKPM of >10 for either cell line, P value adjusted for FDR of <0.001, and BEAS-2B/A549 of >∣23∣. (A) Top 354 differentially expressed genes. (B to D) Genes of interest are shown according to category in Ingenuity Pathway Analysis. The data shown are from 3 and 6 biological replicates for A549 and BEAS-2B cells, respectively.

References

    1. Nair H, Nokes DJ, Gessner BD, Dherani M, Madhi SA, Singleton RJ, O'Brien KL, Roca A, Wright PF, Bruce N, Chandran A, Theodoratou E, Sutanto A, Sedyaningsih ER, Ngama M, Munywoki PK, Kartasasmita C, Simoes EA, Rudan I, Weber MW, Campbell H. 2010. Global burden of acute lower respiratory infections due to respiratory syncytial virus in young children: a systematic review and meta-analysis. Lancet 375:1545–1555. doi:10.1016/S0140-6736(10)60206-1. - DOI - PMC - PubMed
    1. Wu P, Dupont WD, Griffin MR, Carroll KN, Mitchel EF, Gebretsadik T, Hartert TV. 2008. Evidence of a causal role of winter virus infection during infancy in early childhood asthma. Am J Respir Crit Care Med 178:1123–1129. doi:10.1164/rccm.200804-579OC. - DOI - PMC - PubMed
    1. Blanken MO, Rovers MM, Bont L, Dutch RSVNN. 2013. Respiratory syncytial virus and recurrent wheeze. N Engl J Med 369:782–783. doi:10.1056/NEJMc1307429. - DOI - PubMed
    1. Johnson JE, Gonzales RA, Olson SJ, Wright PF, Graham BS. 2007. The histopathology of fatal untreated human respiratory syncytial virus infection. Mod Pathol 20:108–119. doi:10.1038/modpathol.3800725. - DOI - PubMed
    1. Liu P, Jamaluddin M, Li K, Garofalo RP, Casola A, Brasier AR. 2007. Retinoic acid-inducible gene I mediates early antiviral response and Toll-like receptor 3 expression in respiratory syncytial virus-infected airway epithelial cells. J Virol 81:1401–1411. doi:10.1128/JVI.01740-06. - DOI - PMC - PubMed

Publication types

MeSH terms

LinkOut - more resources