. 2018 Jul 17;92(15):e00433-18.
doi: 10.1128/JVI.00433-18. Print 2018 Aug 1.

Avian Influenza Viruses in Wild Birds: Virus Evolution in a Multihost Ecosystem

Affiliations

Avian Influenza Viruses in Wild Birds: Virus Evolution in a Multihost Ecosystem

Divya Venkatesh et al. J Virol. .

Abstract

Wild ducks and gulls are the major reservoirs for avian influenza A viruses (AIVs). The mechanisms that drive AIV evolution are complex at sites where various duck and gull species from multiple flyways breed, winter, or stage. The Republic of Georgia is located at the intersection of three migratory flyways: the Central Asian flyway, the East Africa/West Asia flyway, and the Black Sea/Mediterranean flyway. For six complete study years (2010 to 2016), we collected AIV samples from various duck and gull species that breed, migrate, and overwinter in Georgia. We found a substantial subtype diversity of viruses that varied in prevalence from year to year. Low-pathogenic AIV (LPAIV) subtypes included H1N1, H2N3, H2N5, H2N7, H3N8, H4N2, H6N2, H7N3, H7N7, H9N1, H9N3, H10N4, H10N7, H11N1, H13N2, H13N6, H13N8, and H16N3, and two highly pathogenic AIVs (HPAIVs) belonging to clade 2.3.4.4, H5N5 and H5N8, were found. Whole-genome phylogenetic trees showed significant host species lineage restriction for nearly all gene segments and significant differences in observed reassortment rates, as defined by quantification of phylogenetic incongruence, and in nucleotide sequence diversity for LPAIVs among different host species. Hemagglutinin clade 2.3.4.4 H5N8 viruses, which circulated in Eurasia during 2014 and 2015, did not reassort, but analysis after their subsequent dissemination during 2016 and 2017 revealed reassortment in all gene segments except NP and NS. Some virus lineages appeared to be unrelated to AIVs in wild bird populations in other regions, with maintenance of local AIVs in Georgia, whereas other lineages showed considerable genetic interrelationships with viruses circulating in other parts of Eurasia and Africa, despite relative undersampling in the area.IMPORTANCE Waterbirds (e.g., gulls and ducks) are natural reservoirs of avian influenza viruses (AIVs) and have been shown to mediate the dispersal of AIVs at intercontinental scales during seasonal migration. The segmented genome of influenza viruses enables viral RNA from different lineages to mix or reassort when two viruses infect the same host. Such reassortant viruses have been identified in most major human influenza pandemics and several poultry outbreaks. Despite their importance, we have only recently begun to understand AIV evolution and reassortment in their natural host reservoirs. This comprehensive study illustrates AIV evolutionary dynamics within a multihost ecosystem at a stopover site where three major migratory flyways intersect. Our analysis of this ecosystem over a 6-year period provides a snapshot of how these viruses are linked to global AIV populations. Understanding the evolution of AIVs in the natural host is imperative to mitigating both the risk of incursion into domestic poultry and the potential risk to mammalian hosts, including humans.

Keywords: avian influenza; ecology; evolution; influenza; phylogenetics; viruses.


Figures

FIG 1
FIG 1
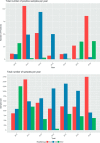
Bar chart showing the total number of positive samples (top) and the total number of samples (bottom) collected each year. The bars are colored according to the host from which samples were isolated.
FIG 2
FIG 2
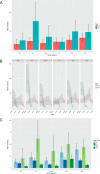
Yearly prevalence of viruses in Georgia from 2010 to 2016 overall (A), seasonally (B), by HA subtype (C), and by region (D). (A) Prevalence of virus ± standard deviation. Bars are colored according to the host from which the virus was isolated. (B and D) Prevalence of virus, with the upper and lower bounds being the 95% confidence intervals. (C) Heat map of the HA subtypes of the viruses isolated. The squares are colored according to the number of isolates of each type identified.
FIG 3
FIG 3
Maximum likelihood trees for all internal genes (PB2, PB1, MP, NS, NP, and PA) from equivalent strains connected across the trees. Tips and connecting lines are colored according to host type: black-headed and Mediterranean gulls (BMG), yellow-legged and Armenian gulls (YAG), mallards (MD), and other ducks (OD).
FIG 4
FIG 4
Maximum-likelihood trees for each gene segment of AIVs isolated in Georgia from 2010 to 2016. Branch supports are indicated by the approximate likelihood ratio test (aLRT) values. Tip labels are colored according to the type of bird that the strain was isolated from: black-headed and Mediterranean gulls (BMG), yellow-legged and Armenian gulls (YAG), mallards (MD), and other ducks (OD).
FIG 5
FIG 5
Overall per-site nucleotide sequence diversity, defined as the average number of nucleotide differences per site between two sequences in all possible pairs in the sample population normalized to the number of sequences in each population. (A) Comparison between gulls and ducks; (B) comparison between host types (black-headed and Mediterranean gulls [BMG], yellow-legged and Armenian gulls [YAG], mallards [MD], and other ducks [OD]); (C) comparison between HA types.
FIG 6
FIG 6
Root-to-tip regression for ML trees generated from each internal gene of viruses (MP, NP, NS [NS-A and NS-B], the NS-B allele only, PA, PB1, and PB2) isolated from Georgia from 2010 to 2016, determined using Tempest (v1.5) and plotted in R (v3.2).
FIG 7
FIG 7
(A and B) Overall/summary (A) and overtime/skyline (B) mean diversity for each segment from gulls and ducks determined by PACT (posterior analysis of coalescent trees). Here, diversity is defined as the average time to coalescence for pairs of lineages belonging to each host. (C) Overall/summary mean diversity values for ducks, divided into mallards (MD) and other ducks (OD), and gulls, divided into black-headed and Mediterranean gulls (BMG) and yellow-legged and Armenian gulls (YAG).
FIG 8
FIG 8
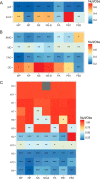
Summaries of expected/observed (Obs) ratios from Bayesian tip-association significance testing (BaTS) for all internal genes. Higher values indicate less phylogenetic clustering by trait and, hence, higher rates of mixed ancestry. Comparisons between gulls and ducks (A), host types (BMG, black-headed and Mediterranean gulls; YAG, yellow-legged and Armenian gulls; MD, mallards, OD, other ducks) (B), and HA types (C) are shown. Asterisks indicate P values (***, P < 0.001; **, P < 0.01; *, P < 0.05; no asterisk, P > 0.05).
FIG 9
FIG 9
Maximum clade credibility (MCC) trees for five of six internal gene segments of AIVs isolated in Georgia from 2010 to 2016. Node icons are colored according to the host type state inferred by BEAST (v1.8.4) software. BMG, black-headed and Mediterranean gulls (red); YAG, yellow-legged and Armenian gulls (purple); MD, mallards (blue); OD, other ducks (green).
FIG 10
FIG 10
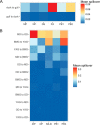
Summary of mean migration events between hosts in the direction from duck to gull and gull to duck (A) and between different host types (BMG, black-headed and Mediterranean gulls; YAG, yellow-legged and Armenian gulls; MD, mallards; OD, other ducks) (B) derived from the genealogy.
FIG 11
FIG 11
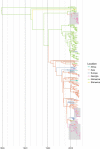
BEAST maximum clade credibility (MCC) trees from viral NP gene sequences isolated worldwide from avian hosts between 2005 and 2016. Branches are colored according to the location observed at the tips and estimated at internal nodes by ancestral reconstruction of the discrete trait. Nodes with a posterior probability of >0.85 are annotated with a diamond icon in the same color as the branch. NAmerica, North America; SAmerica, South America.
FIG 12
FIG 12
The circularized graph shows the overall rates of migration, defined as the rate at which labels (locations) change over the course of the genealogy, between Georgia and other locations. Arrowheads indicate the direction of migration; rates are measured as the number of migration events per lineage per year (indicated by the width of the arrow). GE, Georgia.

References

    1. Olsen B, Munster VJ, Wallensten A, Waldenstrom J, Osterhaus AD, Fouchier RA. 2006. Global patterns of influenza A virus in wild birds. Science 312:384–388. doi:10.1126/science.1122438. - DOI - PubMed
    1. Webster RG, Bean WJ, Gorman OT, Chambers TM, Kawaoka Y. 1992. Evolution and ecology of influenza A viruses. Microbiol Rev 56:152–179. - PMC - PubMed
    1. Gunnarsson G, Jourdain E, Waldenstrom J, Helander B, Lindberg P, Elmberg J, Latorre-Margalef N, Olsen B. 2010. Zero prevalence of influenza A virus in two raptor species by standard screening. Vector Borne Zoonotic Dis 10:387–390. doi:10.1089/vbz.2009.0032. - DOI - PubMed
    1. Latorre-Margalef N, Gunnarsson G, Munster VJ, Fouchier RA, Osterhaus AD, Elmberg J, Olsen B, Wallensten A, Haemig PD, Fransson T, Brudin L, Waldenstrom J. 2009. Effects of influenza A virus infection on migrating mallard ducks. Proc Biol Sci 276:1029–1036. doi:10.1098/rspb.2008.1501. - DOI - PMC - PubMed
    1. Bengtsson D, Safi K, Avril A, Fiedler W, Wikelski M, Gunnarsson G, Elmberg J, Tolf C, Olsen B, Waldenstrom J. 2016 Does influenza A virus infection affect movement behaviour during stopover in its wild reservoir host?. R Soc Open Sci 3:150633. doi:10.1098/rsos.150633. - DOI - PMC - PubMed

Publication types