. 2018 May 17;3(10):e120692.
doi: 10.1172/jci.insight.120692.

TLR-adjuvanted nanoparticle vaccines differentially influence the quality and longevity of responses to malaria antigen Pfs25

Affiliations

TLR-adjuvanted nanoparticle vaccines differentially influence the quality and longevity of responses to malaria antigen Pfs25

Elizabeth A Thompson et al. JCI Insight. .

Abstract

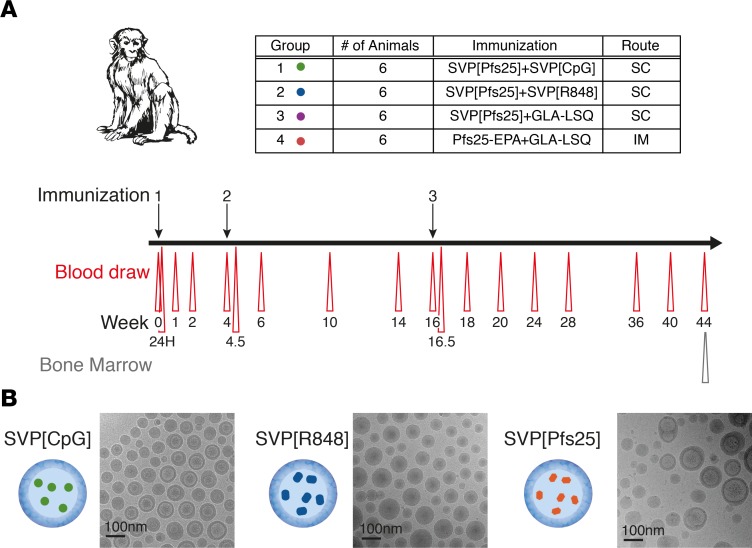
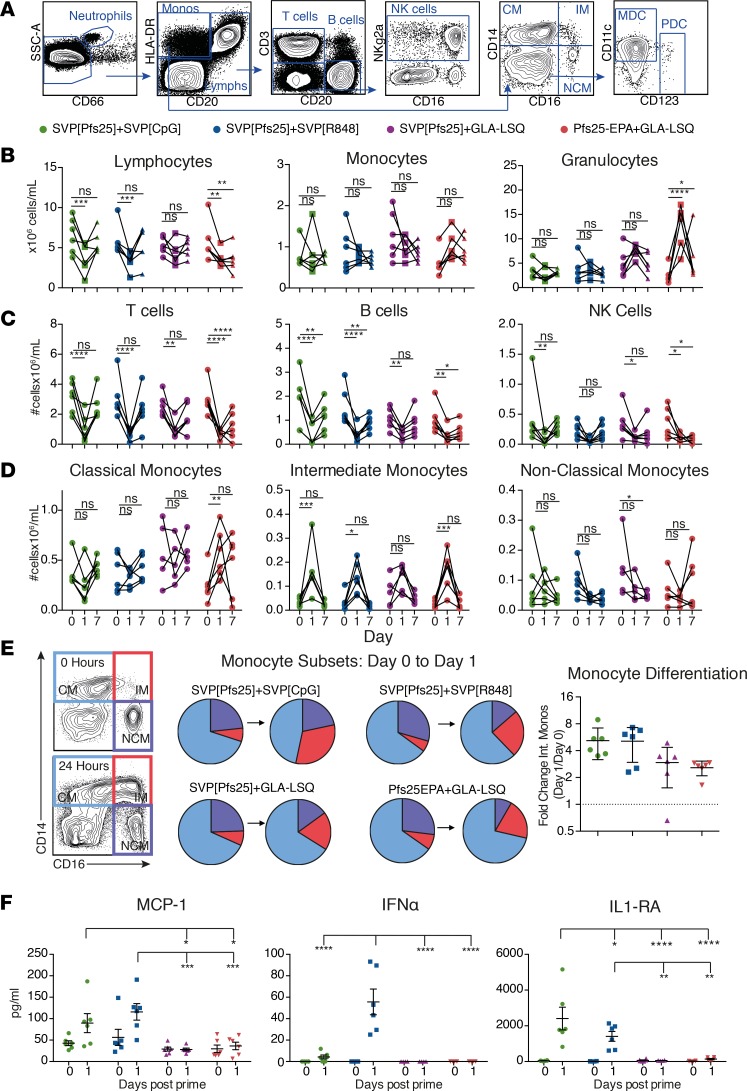
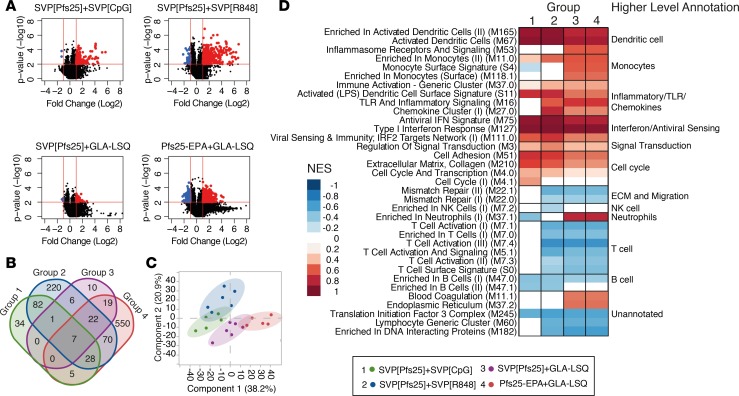
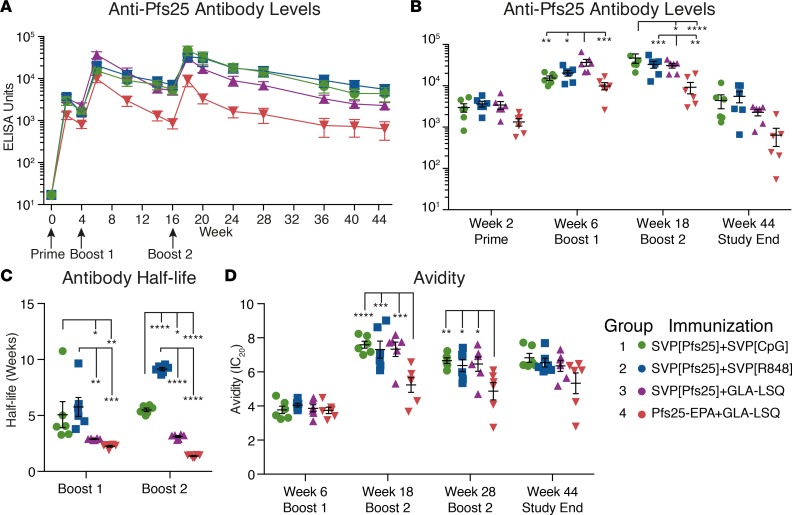
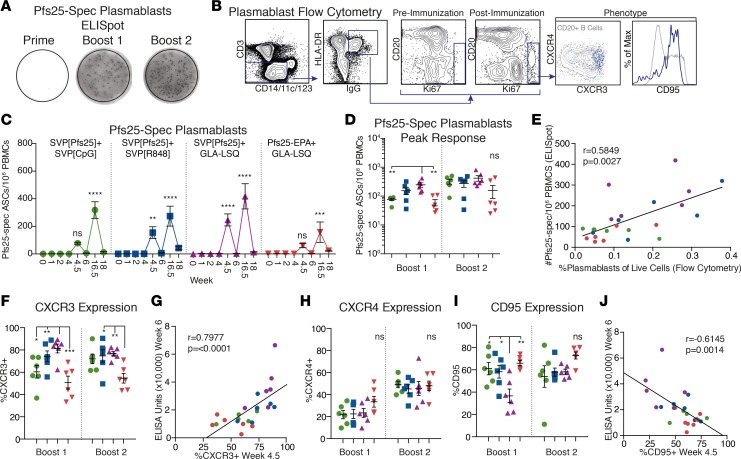
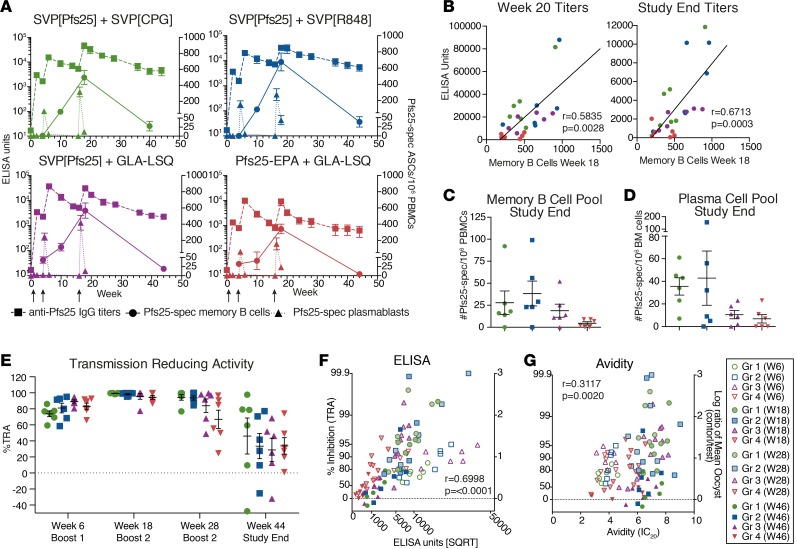
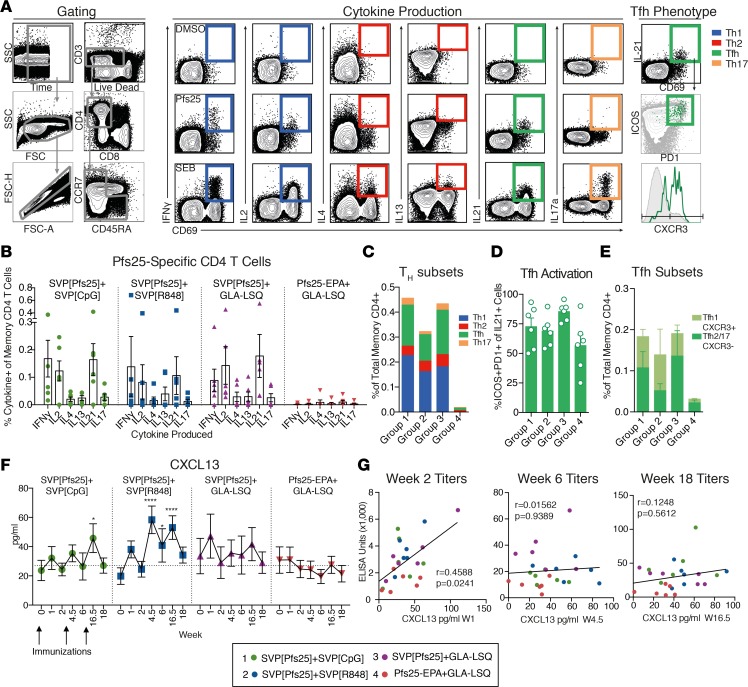
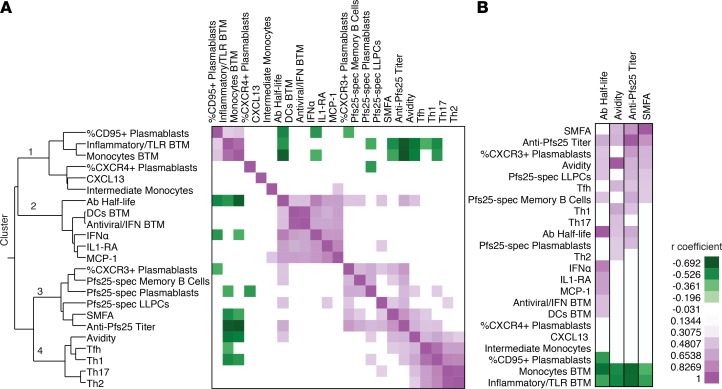
Transmission-blocking vaccines (TBVs) are considered an integral element of malaria eradication efforts. Despite promising evaluations of Plasmodium falciparum Pfs25-based TBVs in mice, clinical trials have failed to induce robust and long-lived Ab titers, in part due to the poorly immunogenic nature of Pfs25. Using nonhuman primates, we demonstrate that multiple aspects of Pfs25 immunity were enhanced by antigen encapsulation in poly(lactic-co-glycolic acid)-based [(PLGA)-based] synthetic vaccine particles (SVP[Pfs25]) and potent TLR-based adjuvants. SVP[Pfs25] increased Ab titers, Pfs25-specific plasmablasts, circulating memory B cells, and plasma cells in the bone marrow when benchmarked against the clinically tested multimeric form Pfs25-EPA given with GLA-LSQ. SVP[Pfs25] also induced the first reported Pfs25-specific circulating Th1 and Tfh cells to our knowledge. Multivariate correlative analysis indicated several mechanisms for the improved Ab responses. While Pfs25-specific B cells were responsible for increasing Ab titers, T cell responses stimulated increased Ab avidity. The innate immune activation differentially stimulated by the adjuvants revealed a strong correlation between type I IFN polarization, induced by R848 and CpG, and increased Ab half-life and longevity. Collectively, the data identify ways to improve vaccine-induced immunity to poorly immunogenic proteins, both by the choice of antigen and adjuvant formulation, and highlight underlying immunological mechanisms.

Keywords: Adaptive immunity; Immunology; Innate immunity; Malaria; Vaccines.


Conflict of interest statement

Conflict of interest: CPO and LJ are full-time employees and have equity in Selecta Biosciences Inc. CPO is named as an inventor on patent WO2013019669A2, and LJ is an inventor on patent WO2011150240A1 describing the synthetic vaccine particles. RFH has equity in Amgen, Bristol-Myer Squibb, Johnson & Johnson, and Merck.

Figures

Figure 1
Figure 1. Study design.
(A) Study design. Four groups of rhesus macaques (n = 6/group) were immunized 3 times at week 0, 4, and 16, according to the chart. Blood draws were taken throughout study according to schedule, and bone marrow was collected at study end. (B) Transmission electron microscopy images of representative synthetic vaccine particles (SVPs). Scale bar: 100 nm.
Figure 2
Figure 2. Immunization induces alteration of cellular populations and cytokine production during innate response.
(A) Representative gating of peripheral blood immune subsets monitored for innate activity by flow cytometry. (B) Complete blood counts. (C and D) Cell subset frequencies normalized to lymphocyte (C) or monocyte (D) complete blood counts. (E) Differentiation of monocyte populations; classical monocytes (CM), intermediate monocyte (IM), or nonclassical monocytes (NCM) are shown as the percentage of total monocytes (pie charts) or fold change of intermediate monocytes from day 0 to 1 (mean ± SEM). (F) Plasma cytokines increased on day 1 after immunization (mean ± SEM). Groups were compared using 2-way ANOVA. *P ≤ 0.05; **P ≤ 0.01; ***P ≤ 0.001; and ****P ≤ 0.0001.
Figure 3
Figure 3. Modulation of gene expression following immunization.
(A) Differentially expressed genes displayed as volcano plots. Criteria used are raw P < 0.01, calculated using a paired 2-tailed Student’s t test, and fold change (FC) > 2 from day 0 to day 1. (B and C) Genes showing P < 0.01 and FC > 2 in any of the groups were selected for further analysis (1,103 genes). (B) Venn diagram depicting the number of overlapping genes between each group for selected genes. (C) Principal component analysis using individual FC values for selected genes. (D) Each box represents a blood transcript module (BTM) and colors represent the normalized enrichment score (NES) after gene set enrichment analysis using all genes. BTMs are grouped into higher level annotation as indicated on the right.
Figure 4
Figure 4. Robust and sustained Ab titers.
(A) Ab titers against Pfs25 were measured using a standardized ELISA. (B) Ab titers at peak immunogenicity after immunizations and study end. (C) Ab titer half-life was calculated following boost 1 (week 6 to week 16) and boost 2 (week 18 to week 44). (D) Ab avidity was calculated using a modified urea ELISA. Urea concentration that dissociated 20% of bound anti-Pfs25 IgG is shown (IC20 values). All data are represented as mean ± SEM. Groups were compared using 2-way ANOVA. *P ≤ 0.05; **P ≤ 0.01; ***P ≤ 0.001; and ****P ≤ 0.0001.
Figure 5
Figure 5. Induction of plasmablasts following boost immunizations with distinct phenotypes.
(A) Representative examples of ELISpot results from wells coated with Pfs25 protein for enumeration of Pfs25-specific Ab-secreting cells (ASCs; plasmablasts). (B) Gating scheme to evaluate kinetics and phenotype of plasmablasts over time using flow cytometry. (C) The magnitude of Pfs25-specific plasmablasts evaluated by ELISpot over time. (D) Summary of peak responses, 5 days after boost 1 (week 4.5) and 4 days after boost 2 (week 16.5), evaluated by ELISpot. (E) Correlation of plasmablasts, as determined by ELISpot (y axis) and flow cytometry (x axis). (F–J) Phenotype of plasmablasts determined by flow cytometry. (F) Percentage of plasmablasts expressing CXCR3. (G) Correlation of the percentage of CXCR3+ plasmablasts at week 4.5 with Ab titers at week 6. (H) Percentage of plasmablasts expressing CXCR4. (I) Percentage of plasmablasts expressing CD95. (J) Correlation of the percentage of CD95+ plasmablasts at week 4.5 with Ab titers at week 6. All data represent mean ± SEM, unless otherwise noted. Groups were compared using 2-way ANOVA. Correlation analysis performed using nonparametric Spearman’s test with 2-tailed P value. *P ≤ 0.05; **P ≤ 0.01; ***P ≤ 0.001; and ****P ≤ 0.0001.
Figure 6
Figure 6. Maintenance of B cell memory and Ab functionality.
(A) Overview of B cell kinetics throughout the study, including induction of Ab titers (left, x axis) and Pfs25-specific plasmablasts and memory B cells (right, y axis) determined by ELISA or ELISpot. (B) Correlation of memory B cells determined by ELISpot at week 18 with Ab titers at week 20 and study end. (C) Peripheral memory B cell pool at study end determined by ELISpot. (D) Bone marrow (BM) plasma cell pool at study end determined by ELISpot. (E) Ab functionality, as determined by standard membrane feeding assay (SMFA). Shown is the percentage inhibition of oocyst development in the mosquito midgut. TRA, transmission reducing activity. (F) Ab titer (ELISA Units, square root) correlated with transmission-reducing activity. (G) Ab avidity (inhibitory concentration 20% [IC20]) values correlated with transmission-reducing activity. All data represent mean ± SEM, unless otherwise noted. Groups were compared using 2-way ANOVA. Correlation analysis performed using nonparametric Spearman’s test with 2-tailed P value.
Figure 7
Figure 7. Induction of Pfs25-specific CD4 T cells and germinal center activation.
(A) Representative gating (live/CD3+, CD4+/CD8, CD45RA+, and CCR7+ naive cells gated out), cytokine production, and peripheral Tfh phenotype following overnight stimulation with DMSO, Pfs25 overlapping peptides (15-mers overlapping by 11 peptides)), or staphylococcal enterotoxin B in the presence of brefeldin A. (B) Quantification of CD4 memory T cells following boost 2 (week 18) producing IFN-γ, IL-2, IL-4, IL-13, IL-21, or IL-17 following Pfs25 peptide stimulation, with negative control (DMSO) values subtracted. (C) Induction of Th subsets based on cytokine production; see representative gating. (D) Percentage of peripheral Tfh cells with activated phenotype that are ICOS+, and PD1+. (E) Tfh subsets based on CXCR3 expression. (F) CXCL13 was measured in plasma following immunization as a biomarker for germinal center activity. Significance was calculated using 2-way ANOVA compared with baseline. (G) Correlation of CXCL13 levels with anti-Pfs25 titers. All data represent mean ± SEM, unless otherwise noted. Correlation analysis performed using nonparametric Spearman’s test with 2-tailed P value. *P ≤ 0.05 and ****P ≤ 0.0001.
Figure 8
Figure 8. Clustering of significantly correlated values.
(A) Twenty-three parameters measured in the study at peak immunogenicity (Supplemental Table 1) were analyzed using a multivariate nonparametric Spearman’s test and 2-tailed P value. Correlations with a nonsignificant P value (>0.05) had Spearman’s coefficient changed to 0, and remaining values underwent 2-way hierarchical clustering. Heatmap showing correlation coefficient with clusters denoted. (B) Isolation of correlation values of indicated parameters that correlate with Ab half-life, avidity, titer, and standard membrane feeding assay (SMFA) activity.

Similar articles

Cited by

References

    1. Kasturi SP, et al. Programming the magnitude and persistence of antibody responses with innate immunity. Nature. 2011;470(7335):543–547. doi: 10.1038/nature09737. - DOI - PMC - PubMed
    1. Ilyinskii PO, et al. Adjuvant-carrying synthetic vaccine particles augment the immune response to encapsulated antigen and exhibit strong local immune activation without inducing systemic cytokine release. Vaccine. 2014;32(24):2882–2895. doi: 10.1016/j.vaccine.2014.02.027. - DOI - PMC - PubMed
    1. Demento SL, et al. TLR9-targeted biodegradable nanoparticles as immunization vectors protect against West Nile encephalitis. J Immunol. 2010;185(5):2989–2997. doi: 10.4049/jimmunol.1000768. - DOI - PMC - PubMed
    1. Moon JJ, Suh H, Li AV, Ockenhouse CF, Yadava A, Irvine DJ. Enhancing humoral responses to a malaria antigen with nanoparticle vaccines that expand Tfh cells and promote germinal center induction. Proc Natl Acad Sci USA. 2012;109(4):1080–1085. doi: 10.1073/pnas.1112648109. - DOI - PMC - PubMed
    1. Moyer TJ, Zmolek AC, Irvine DJ. Beyond antigens and adjuvants: formulating future vaccines. J Clin Invest. 2016;126(3):799–808. doi: 10.1172/JCI81083. - DOI - PMC - PubMed

Publication types