. 2018 Nov 1;67(4):431-440.
doi: 10.1538/expanim.18-0023. Epub 2018 May 16.

The kinematic recovery process of rhesus monkeys after spinal cord injury

Affiliations

The kinematic recovery process of rhesus monkeys after spinal cord injury

Rui-Han Wei et al. Exp Anim. .

Abstract

After incomplete spinal cord injury (SCI), neural circuits may be plastically reconstructed to some degree, resulting in extensive functional locomotor recovery. The present study aimed to observe the post-SCI locomotor recovery of rhesus monkey hindlimbs and compare the recovery degrees of different hindlimb parts, thus revealing the recovery process of locomotor function. Four rhesus monkeys were chosen for thoracic hemisection injury. The hindlimb locomotor performance of these animals was recorded before surgery, as well as 6 and 12 weeks post-lesion. Via principal component analysis, the relevant parameters of the limb endpoint, pelvis, hindlimb segments, and joints were processed and analyzed. Twelve weeks after surgery, partial kinematic recovery was observed at the limb endpoint, shank, foot, and knee joints, and the locomotor performance of the ankle joint even recovered to the pre-lesion level; the elevation angle of the thigh and hip joints showed no obvious recovery. Generally, different parts of a monkey hindlimb had different spontaneous recovery processes; specifically, the closer the part was to the distal end, the more extensive was the locomotor function recovery. Therefore, we speculate that locomotor recovery may be attributed to plastic reconstruction of the motor circuits that are mainly composed of corticospinal tract. This would help to further understand the plasticity of motor circuits after spinal cord injury.

Keywords: locomotion; monkey; spinal cord injury; spontaneous recovery.


Figures

Fig. 1.
Fig. 1.
Measurement of kinematics. A: Definitions of joint angles. Hip, knee, and ankle joint angles were defined as decreasing during flexion. B: Definitions of elevation angles. Elevation angles were defined as decreasing during clockwise rotation of the segments with respect to the vertical axis.
Fig. 2.
Fig. 2.
Recovery of the limb endpoint. A: Representative stick decompositions of lesion-side hindlimb movements at the swing phase during stepping on the treadmill at 0.222 m/s before and 6 and 12 weeks after the lesion. The trajectories (n=10 steps; grey, normal gait; black, drag) of the limb endpoint are shown together with the intensity and direction of the limb endpoint velocities (arrows) at swing onset. B: Bar graph of average scores on PC1 of the limb endpoint. C: Mean values of the parameters with high factor loadings on PC1 of the limb endpoint. *P<0.05 (ANOVA), **P<0.01 (ANOVA), ***P<0.001 (ANOVA). Data are means ± SEM. Pre, before surgery; w, weeks.
Fig. 3.
Fig. 3.
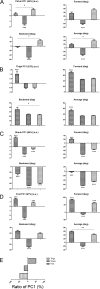
Recovery of hindlimb segments. A: Bar graph of average scores on PC1 of the pelvis (A), thigh (B), shank (C), and foot (D). Mean values of the representative parameters with high factor loadings on PC1 of the pelvis (A), thigh (B), shank (C), and foot (D). E: Comparison of recovery status of each segment at 12 weeks post-lesion. Each value was the ratio of PC1 at 12 weeks post-lesion to pre-surgery PC1. *P<0.05 (ANOVA), **P<0.01 (ANOVA), ***P<0.001 (ANOVA). Data are means ± SEM. Deg, degrees; a.u., arbitrary units.
Fig. 4.
Fig. 4.
Recovery of hindlimb joints. A: Bar graph of average scores on PC1 of the hip (A), knee (B), and ankle joint (C). Mean values of the representative parameters with high factor loadings on PC1 of the hip (A), knee (B), and ankle (C). D: Comparison of the recovery status of each segment at 12 weeks post-lesion. *P<0.05 (ANOVA), **P<0.01 (ANOVA), ***P<0.001 (ANOVA). Data are means ± SEM. Deg, degrees; a.u., arbitrary units.
Fig. 5.
Fig. 5.
Linear regression plots that demonstrate the correlation between PC1 scores of the limb endpoint and thigh (A), shank (B), and foot (C) at 12 weeks post-lesion. Each circle represents a gait cycle (300 cycles in total).

References

    1. Awai L., Bolliger M., Ferguson A.R., Courtine G., Curt A.2016. Influence of spinal cord integrity on gait control in human spinal cord injury. Neurorehabil. Neural Repair 30: 562–572. doi: 10.1177/1545968315600524 - DOI - PMC - PubMed
    1. Awai L., Curt A.2016. Locomotor recovery in spinal cord injury − insights beyond walking speed and distance. J. Neurotrauma 33: 1428–1435. doi: 10.1089/neu.2015.4154 - DOI - PubMed
    1. Babu R.S., Namasivayam A.2008. Recovery of bipedal locomotion in bonnet macaques after spinal cord injury: footprint analysis. Synapse 62: 432–447. doi: 10.1002/syn.20513 - DOI - PubMed
    1. Bachmann L.C., Matis A., Lindau N.T., Felder P., Gullo M., Schwab M.E.2013. Deep brain stimulation of the midbrain locomotor region improves paretic hindlimb function after spinal cord injury in rats. Sci. Transl. Med. 5: 208ra146. doi: 10.1126/scitranslmed.3005972 - DOI - PubMed
    1. Ballermann M., Fouad K.2006. Spontaneous locomotor recovery in spinal cord injured rats is accompanied by anatomical plasticity of reticulospinal fibers. Eur. J. Neurosci. 23: 1988–1996. doi: 10.1111/j.1460-9568.2006.04726.x - DOI - PubMed