. 2018 May;557(7706):570-574.
doi: 10.1038/s41586-018-0121-3. Epub 2018 May 16.

Mxra8 is a receptor for multiple arthritogenic alphaviruses

Affiliations

Mxra8 is a receptor for multiple arthritogenic alphaviruses

Rong Zhang et al. Nature. 2018 May.

Abstract

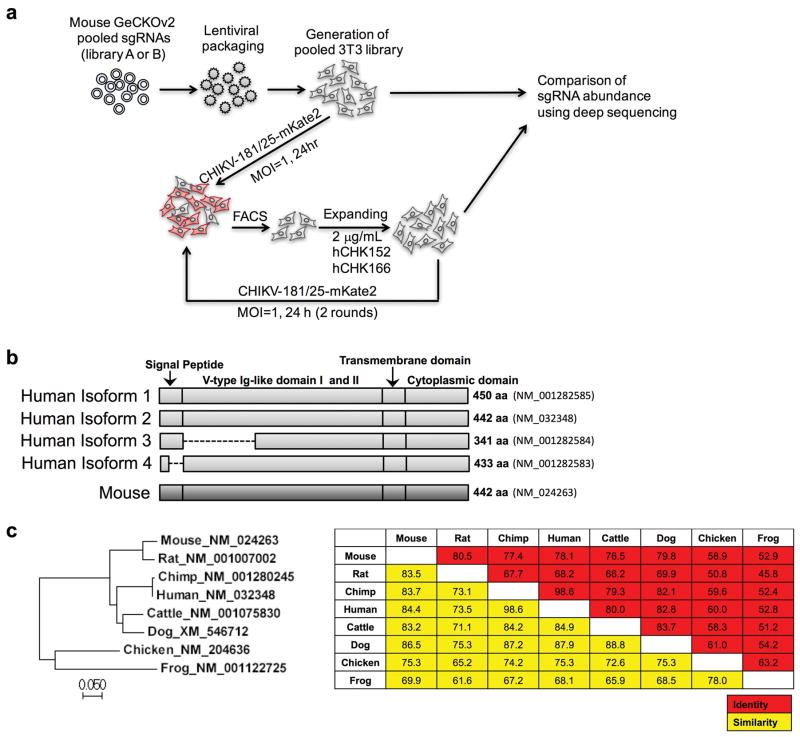
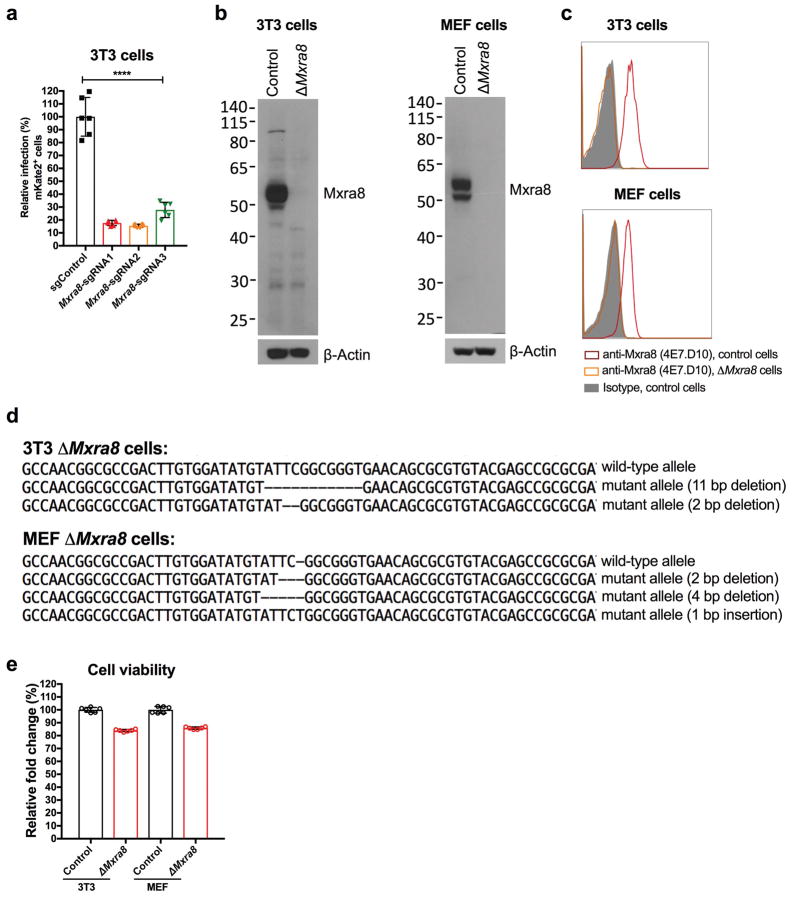
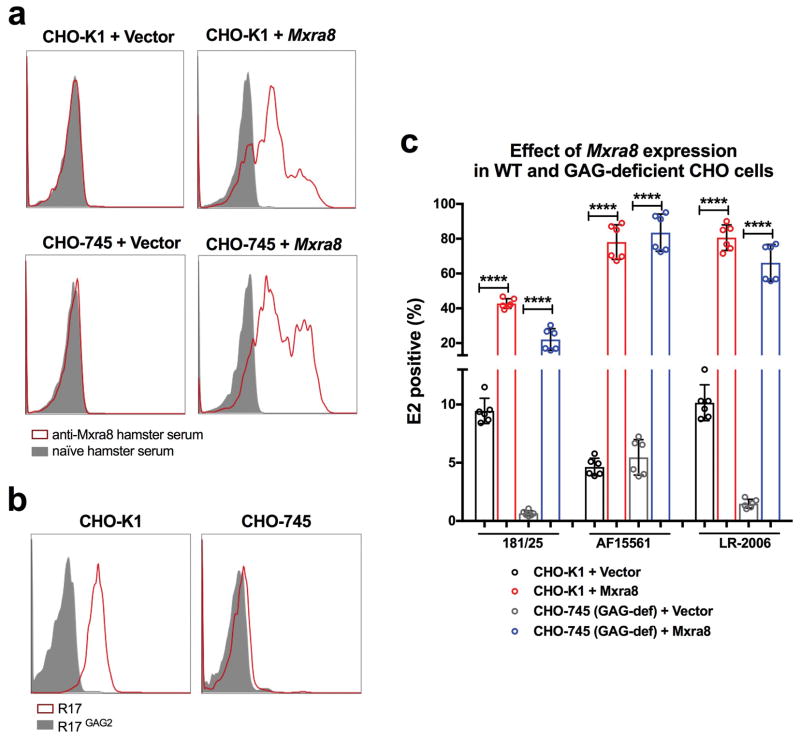
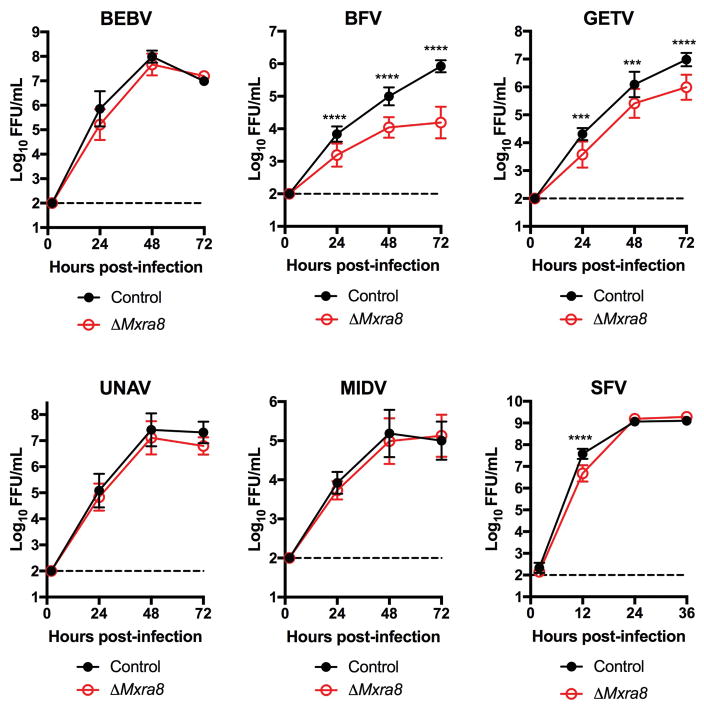
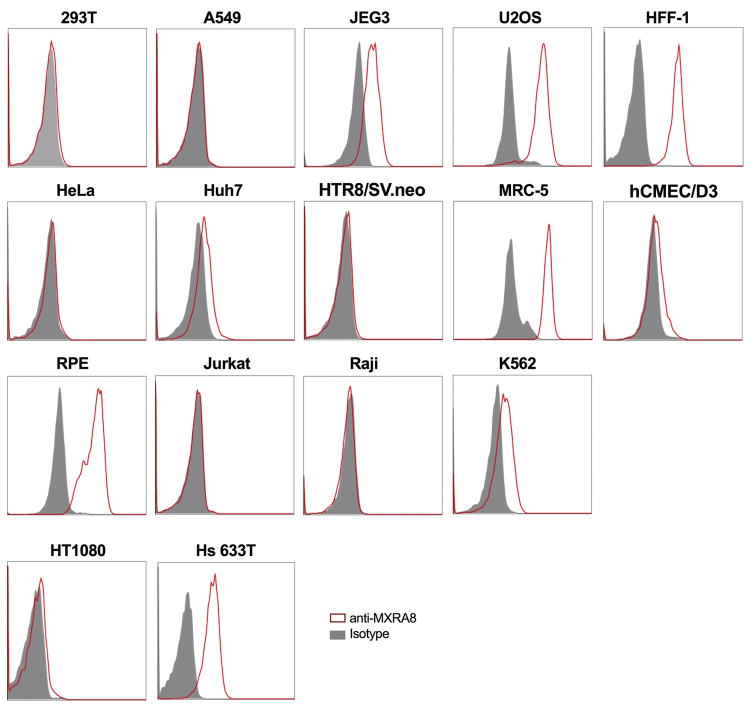
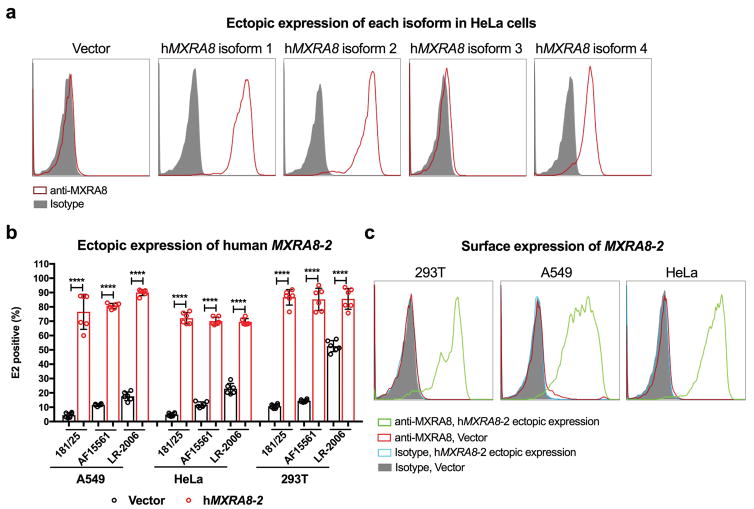
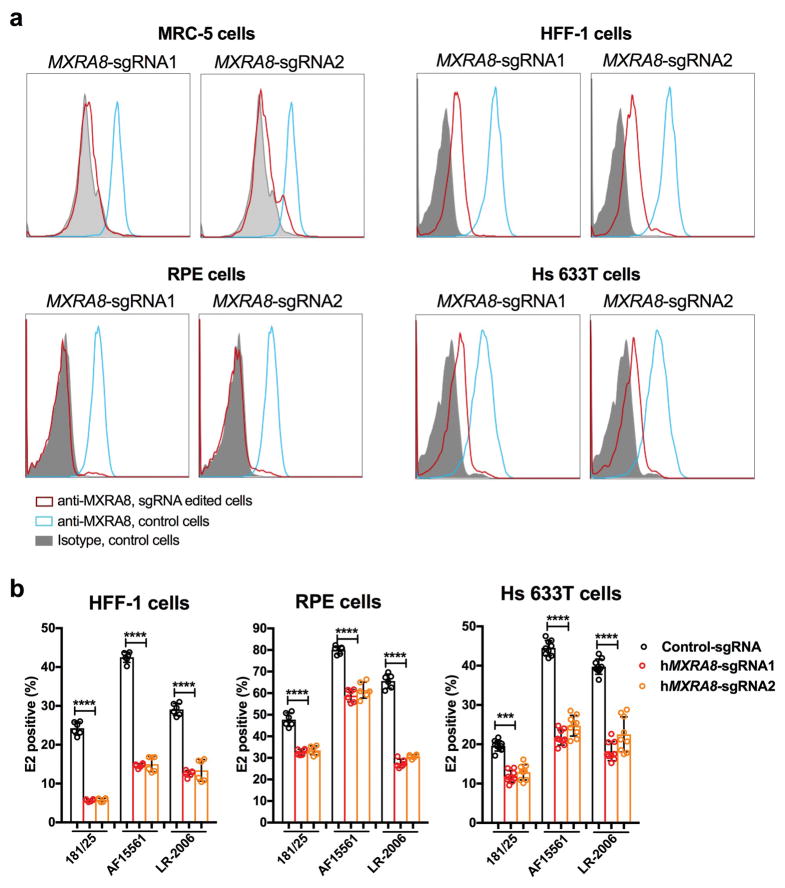
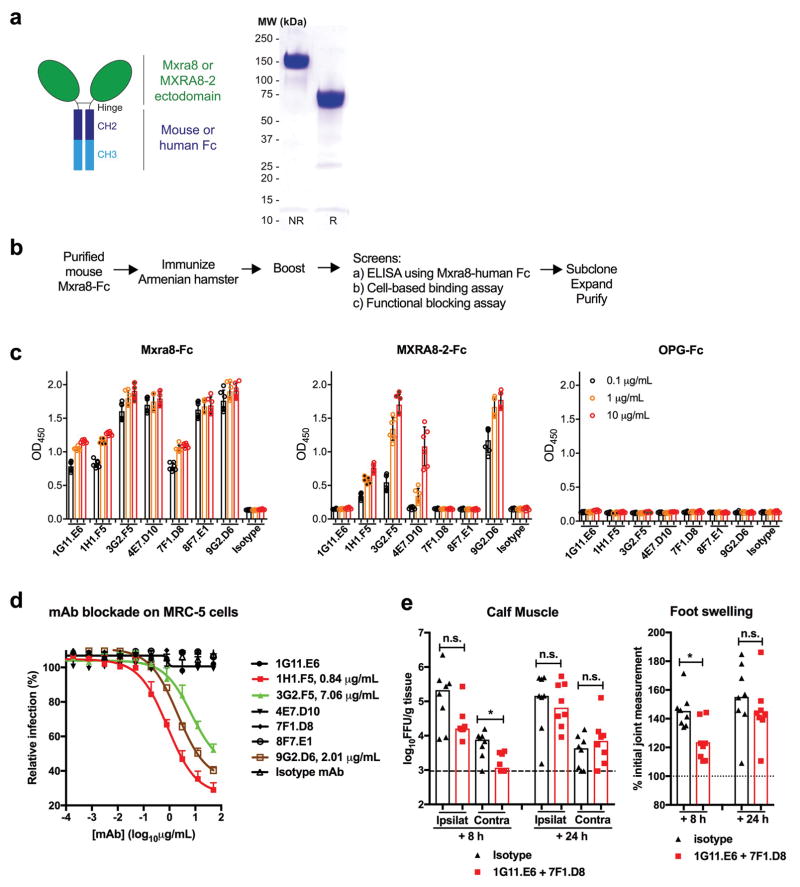
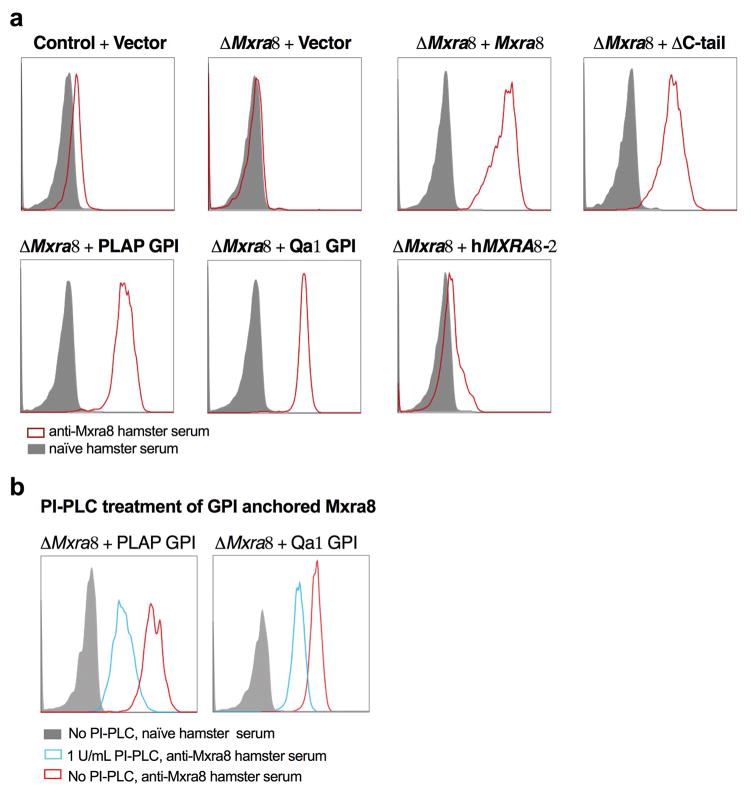
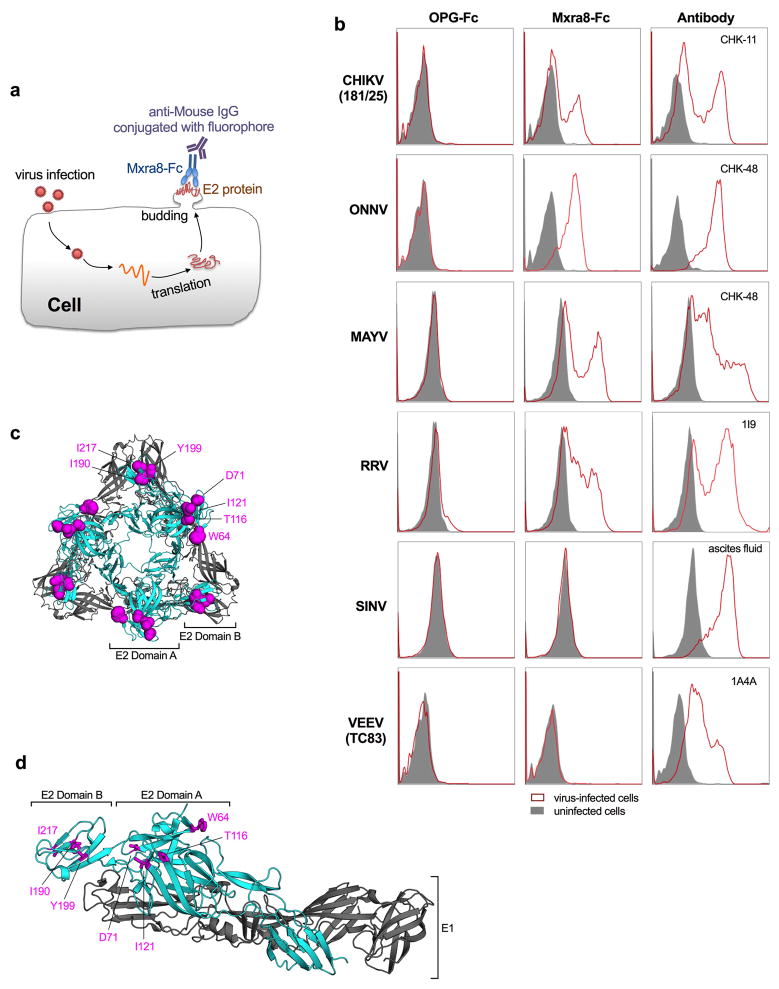
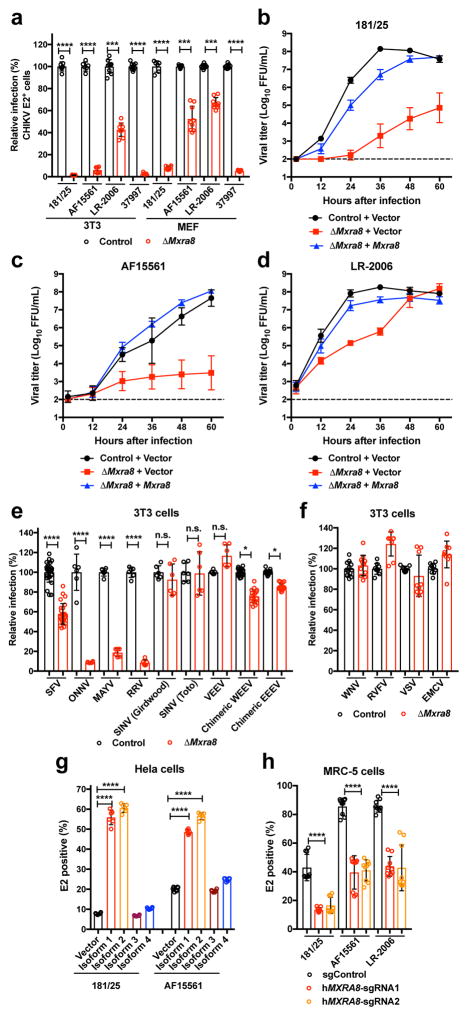
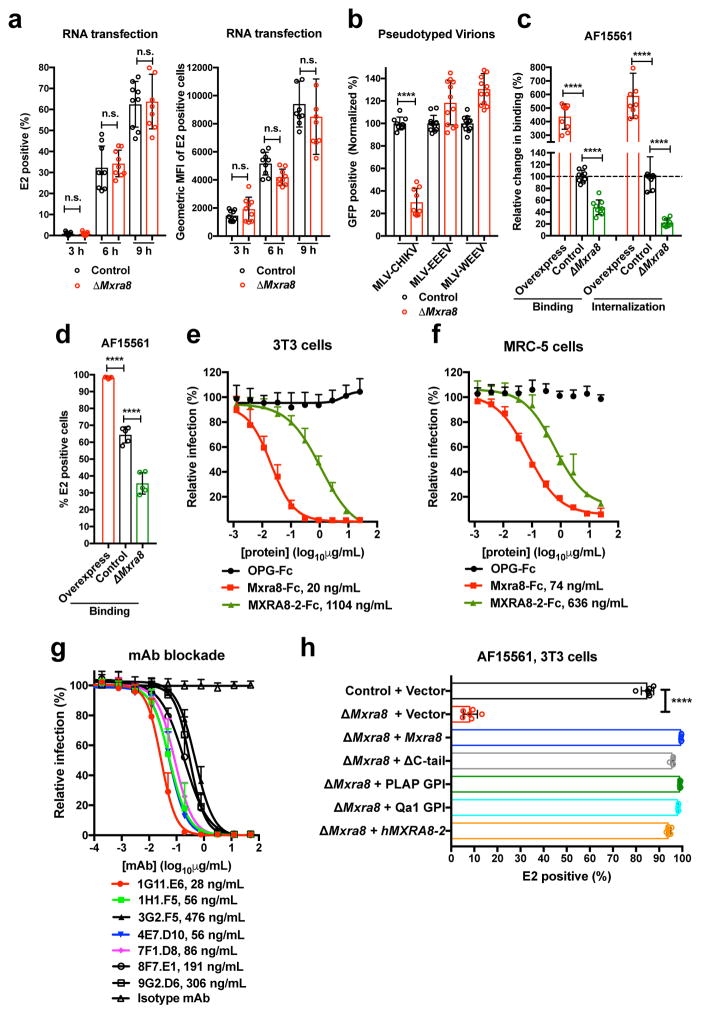
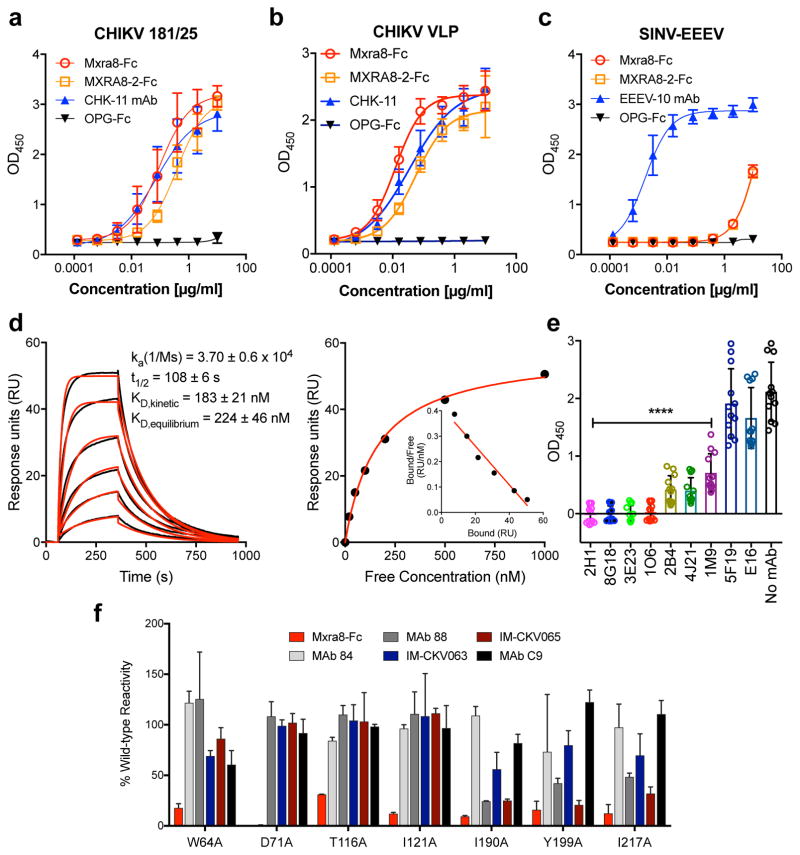
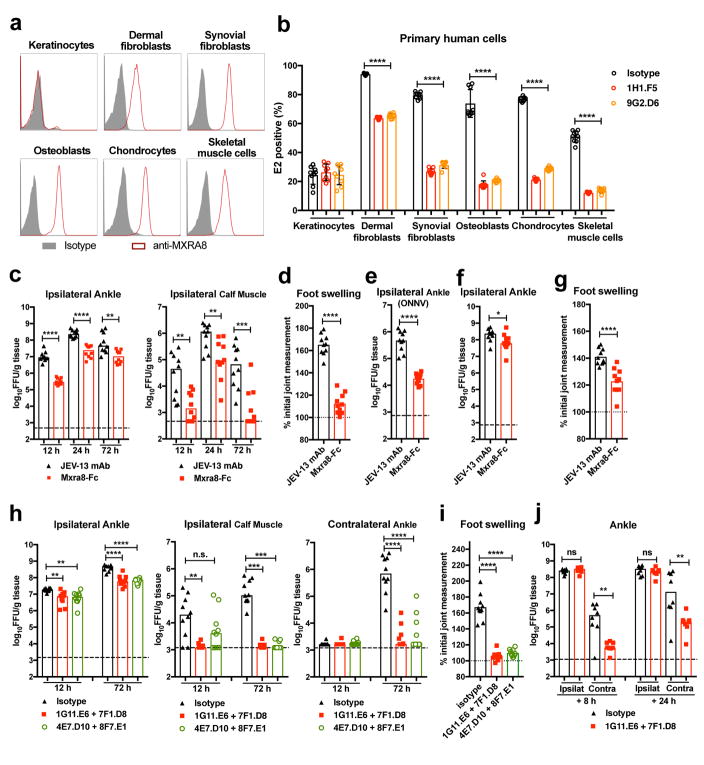
Arthritogenic alphaviruses comprise a group of enveloped RNA viruses that are transmitted to humans by mosquitoes and cause debilitating acute and chronic musculoskeletal disease 1 . The host factors required for alphavirus entry remain poorly characterized 2 . Here we use a genome-wide CRISPR-Cas9-based screen to identify the cell adhesion molecule Mxra8 as an entry mediator for multiple emerging arthritogenic alphaviruses, including chikungunya, Ross River, Mayaro and O'nyong nyong viruses. Gene editing of mouse Mxra8 or human MXRA8 resulted in reduced levels of viral infection of cells and, reciprocally, ectopic expression of these genes resulted in increased infection. Mxra8 bound directly to chikungunya virus particles and enhanced virus attachment and internalization into cells. Consistent with these findings, Mxra8-Fc fusion protein or anti-Mxra8 monoclonal antibodies blocked chikungunya virus infection in multiple cell types, including primary human synovial fibroblasts, osteoblasts, chondrocytes and skeletal muscle cells. Mutagenesis experiments suggest that Mxra8 binds to a surface-exposed region across the A and B domains of chikungunya virus E2 protein, which are a speculated site of attachment. Finally, administration of the Mxra8-Fc protein or anti-Mxra8 blocking antibodies to mice reduced chikungunya and O'nyong nyong virus infection as well as associated foot swelling. Pharmacological targeting of Mxra8 could form a strategy for mitigating infection and disease by multiple arthritogenic alphaviruses.


Figures

Extended Data Figure 1
Extended Data Figure 1. RISPR-Cas9-based gene editing screen
Mouse 3T3 cells were transduced separately with two half libraries (A + B) comprising 130,209 sgRNAs, selected with puromycin, and then inoculated with CHIKV-181/25-mKate2 (MOI of 1). One day later, mKate2-negative cells were sorted, and expanded in the presence of 2 μg/ml each of CHK-152 and CHK-166 neutralizing mAbs. Several days later, cells were re-inoculated with CHIKV-181/25-mKate2 without neutralizing mAbs and re-sorted for mKate2-negative cells. This procedure was repeated one additional time. Afterwards, genomic DNA was harvested for sgRNA sequencing and compared to the parent library for abundance (see Supplemental Tables 1 and 2). b. Diagram of the mouse Mxra8 and human MXRA8 orthologs. The transcript indentification numbers and length of proteins are indicated to the right. Partial deletions in the isoforms 3 and 4 are shown as dashed lines. c. Phylogenetic tree of Mxra8 indicating genetic relationships. The Neighbor-Joining tree was constructed using MEGA 7. Scale bar shows the branch length. (Right) Identity (red) and similarity (yellow) matrix indicating the conservation of Mxra8 between species. The matrix was generated using MagGat 1.8.
Extended Data Figure 2
Extended Data Figure 2. Efficiency of targeting Mxra8 expression by CRISPR-Cas9 gene editing
a. 3T3 cells were edited with a control or three different Mxra8 sgRNAs. After puromycin selection, bulk cells were inoculated with chimeric CHIKV-181/25-mKate2 and processed for marker gene expression by flow cytometry. Data are pooled from three experiments and expressed as mean ± SD (n = 6, one-way ANOVA with a Dunnett’s multiple comparison test compared to control, ****, P < 0.0001). b. Western blotting of Mxra8 in control and ΔMxra8 3T3 or MEF cells using hamster mAb 3G2.F5. One representative of two is shown. c. 3T3 and MEF cells (parent or ΔMxra8) were tested for Mxra8 surface expression by flow cytometry using anti-Mxra8 antibody (4E7.D10) and an isotype control mAb. One representative experiment of two is shown. d. Sanger sequencing of Mxra8 in control and ΔMxra8 3T3 or MEF cells. Sequencing data shows an alignment and individual out-of-frame deletions. e. Viability of control and ΔMxra8 3T3 and MEF cells. An equal number of cells were plated and viability was assessed over a 24 h period using the Cell-Titer Glo assay. The results were normalized to control cells and pooled from two experiments (n = 6). Error bars indicate SD.
Extended Data Figure 3
Extended Data Figure 3. CHIKV infectivity in CHO-K1 and CHO-745 cells in the presence or absence of ectopic Mxra8 expression
a. Surface expression of Mxra8 on CHO-K1 (WT) and CHO-745 (glycosaminoglycan deficient) cells stably transduced with control (vector-only) or mouse Mxra8 as judged by flow cytometry. b. Confirmation of HS expression on the surface of CHO-K1 (WT) and CHO-745 cells. Surface expression of HS was evaluated using the R17 protein of rodent herpesvirus Peru, which binds to glycosaminoglycans on the surface of cells. R17GAG2 is a mutant form of the protein that lacks binding to glycosaminoglycans and served as a negative control. For a and b, data are representative of two experiments. c. CHO-K1 (WT) and CHO-745 cells were transduced stably with control (vector) or mouse Mxra8 and inoculated with CHIKV (strains 181/25, AF15561, or LR-2006) and processed for intracellular E2 protein staining by flow cytometry. Data are from three experiments: mean ± SD (n = 6, one-way ANOVA with a Dunnett’s multiple comparison test, ****, P < 0.001).
Extended Data Figure 4
Extended Data Figure 4. Growth curves of related alphaviruses in ΔMxra8 3T3 cells
Control and ΔMxra8 3T3 cells were inoculated with Bebaru (BEBV), Barmah Forest (BFV), Getah (GETV), Una (UNAV), Middleburg (MIDV), or Semliki Forest (SFV) viruses at an MOI of 0.01 (except for BEBV, which was at 0.001), and supernatants were harvested at the indicated times for FFA. Data are pooled from two (BEBV) or three (all others) experiments and expressed as mean ± SD (n =6, BEBV; n = 9, BFV, GETV, UNAV, and MIDV; n = 12, SFV; two-way ANOVA with Sidak’s multiple comparisons test, ***, P < 0.001; ****, P < 0.0001).
Extended Data Figure 5
Extended Data Figure 5. Surface expression of MXRA8 in different human cell lines
Human cell lines were tested for MXRA8 surface expression by flow cytometry: 293T (embryonic kidney), A549 (lung adenocarcinoma), JEG3 (placental choriocarcinoma), U2OS (osteosarcoma), HFF-1 (foreskin fibroblasts), HeLa (cervical carcinoma), Huh7 (hepatocarcinoma), HTR8/SV.neo (trophoblast progenitor), MRC-5 (lung carcinoma), hCMEC/D3 (cerebral microvascular endothelial cells), RPE (retinal pigment epithelial cell), Jurkat (T cell lymphoma), Raji (B cell lymphoma), K562 (eryrtholeukemia), HT1080 (fibrosarcoma), and Hs 633T (fibrosarcoma) cells. Representative data are shown of two independent experiments. Gray histograms, isotype control mAb; red histograms, anti-MXRA8 mAb.
Extended Data Figure 6
Extended Data Figure 6. MXRA8 supports enhanced infection of different CHIKV strains
a. Transduction and expression of different MXRA8 (-1, -2, -3, and -4) isoforms in HeLa cells. Representative data is shown from two experiments. Gray histograms, isotype control mAb; red histograms, anti-MXRA8 mAb. b. Effect of ectopic expression of MXRA8-2 on CHIKV (181/25, AF15561, and LR-2006) infection of A549, HeLa, or 293T cells. Cells were harvested and stained for CHIKV antigen with an anti-E2 antibody. Data are pooled from three experiments and expressed as mean ± SD. Asterisks indicate statistical significance (n = 6; two-tailed t-test with Holm-Sidak multiple comparison correction, ***, P < 0.001; ****, P < 0.0001). c. Transduction and expression of MXRA8-2 in 293T, A549, and HeLa cells. Representative data is shown from two experiments.
Extended Data Figure 7
Extended Data Figure 7. Gene-editing of MXRA8 in human cell lines
a. Flow cytometry analysis of MXRA8 expression in human MRC-5, HFF-1, RPE, and Hs 633T cells expressing control or two different MXRA8 sgRNAs. Data are representative of two experiments. b. Gene-edited cells were inoculated with CHIKV (181/25, AF15561, or LR-2006) in HFF-1, RPE, and Hs 633T cells. Cells were stained for viral antigen with an anti-E2 antibody. Data are pooled from two (HFF-1 and Hs 633T) or three (RPE) independent experiments and expressed as mean values ± SD (n = 6; one-way ANOVA with a Dunnett’s multiple comparison test compared to the control, ****, P < 0.0001).
Extended Data Figure 8
Extended Data Figure 8. Mxra8-Fc and anti-Mxra8 generation and function
a. Diagram of Mxra8-Fc (left) and SDS-PAGE (non-reducing [NR] and reducing [R] conditions) of purified material (right). Data are representative of three experiments. b. Scheme of anti-Mxra8 generation in Armenian hamsters. c. ELISA reactivity of anti-Mxra8 mAbs against Mxra8-Fc, MXRA8-2-Fc, or OPG-Fc. Purified proteins (50 μl, 5 μg/ml) were immobilized overnight at 4°C on ELISA plates. Anti-Mxra8 and isotype control mAbs were incubated for 1 h at room temperature. Signal was detected at 450 nm after incubation with horseradish peroxide conjugated goat anti-Armenian hamster IgG (H+L) and development with 3,3′-5,5′ tetramethylbenzidine substrate. d. Blockade of CHIKV-181/25 infection in MRC-5 cells with seven different hamster anti-Mxra8 or isotype control mAbs. MAbs were pre-incubated with cells for 1 h at 37°C prior to addition of virus. After infection, cells were processed for E2 staining by flow cytometry. Relative infection was compared to a no mAb condition using flow cytometry and anti-E2 staining. Data in c and d are pooled from two experiments (n = 6) and expressed as mean ± SD. e. Anti-Mxra8 mAbs (1G11 + 7F1) or isotype control hamster mAbs (300 μg total) were administered via intraperitoneal route 8 or 24 hours after inoculation of CHIKV-AF15561 in the footpad. (Left) At 72 h after initial infection, CHIKV titers were measured in the ipsilateral and contralateral gastrocnemius (calf) muscles. (Right) At 72 h, ipsilateral foot swelling was measured and compared to measurements taken immediately prior to infection. Data are pooled from two experiments (n = 8; *, P < 0.05; two-tailed Mann-Whitney test) and expressed as median values.
Extended Data Figure 9
Extended Data Figure 9. Expression of truncated forms of Mxra8 mutants
a. Cell surface expression of Mxra8 in ΔMxra8 3T3 cells trans-complemented with vector, Mxra8, Mxra8 ΔC-tail, Mxra8 with GPI anchors (PLAP or Qa1-derived), or MXRA8-2. Data are representative of two independent experiments. Gray histograms, isotype control mAb; red histograms, anti-Mxra8 mAb. b. Effect of PI-PLC treatment on expression of different GPI anchored (PLAP or Qa1-derived) forms or Mxra8. Data are representative of two independent experiments. Gray histograms, isotype control mAb; red histograms, untreated, anti-Mxra8 mAb; blue histograms, PI-PLC-treated, anti-Mxra8 mAb.
Extended Data Figure 10
Extended Data Figure 10. Binding of Mxra8-Fc to surface-displayed E2 protein in virus-infected cells
a. Diagram of the cell-based binding assay. After infection, viral structural proteins (e.g., E2) traffic to the cell plasma membrane where progeny virion assembles and buds. E2 protein is displayed on the cell surface and is accessible to the binding of Mxra8-Fc and detection with a goat anti-mouse IgG secondary antibody by flow cytometry. b. Binding of Mxra8-Fc to virus-infected WT 3T3 cells. Cell were infected with the indicated viruses and processed for Mxra8-Fc binding by flow cytometry. Virus-specific anti-E2 Abs were used as positive controls. Data are representative of two independent experiments. c–d. Mapped residues by are shown as magenta spheres (c) or sticks (d) on the CHIKV p62-E1 structure (c, trimer of dimers, top view; d, heterodimer, side view) using PyMOL (PDB 3N41). The E1 and E2 proteins are colored in grey and cyan, respectively.
Figure 1
Figure 1. Mxra8 is required for optimal infection of CHIKV and other alphaviruses
a. ΔMxra8 or control 3T3 or MEF cells were inoculated with CHIKV and stained for E2 protein (3 experiments, n = 9; two-tailed t-test with Holm-Sidak correction, ***, P < 0.001; ****, P < 0.0001; mean ± standard deviations (SD). b–d. Multi-step growth curves with CHIKV-181/25 (b), CHIKV-AF15561 (c), or CHIKV-LR-2006 (d) in control, ΔMxra8, or Mxra8 trans-complemented 3T3 cells (3 experiments, n = 9; mean ± SD). e. ΔMxra8 or control 3T3 cells were inoculated with alphaviruses and processed for E2 or reporter gene expression (3 or more experiments, n = 6 except for SFV, WEEV, and EEEV where n = 18; two-tailed t-test with Holm-Sidak correction, *, P < 0.05; ****, P < 0.0001; mean ± SD). f. ΔMxra8 or control 3T3 cells were inoculated with indicated viruses and processed for viral antigen or reporter gene expression (3 experiments, mean ± SD). g. HeLa cells were transduced with control or MXRA8-1, -2, -3, or -4 alleles, inoculated with CHIKV, and processed for E2 staining (3 experiments, n = 6; one-way ANOVA with Dunnett’s test, *, P < 0.05; **, P < 0.01; ***, P < 0.001; mean ± SD). h. Human MRC-5 cells depleted of MXRA8 with two different sgRNA were inoculated with CHIKV, and E2 expression was analyzed (3 experiments, n = 9; one-way ANOVA with Dunnett’s test, ****, P < 0.0001; mean ± SD).
Figure 2
Figure 2. Mxra8 modulates CHIKV attachment and internalization
a. Transfection of CHIKV RNA into control or ΔMxra8 cells. Cells were analyzed for E2 expression (left, percent positive; right, mean fluorescence intensity; 3 experiments, n = 9; not significantly different (n.s.), two-tailed t-test with Holm-Sidak correction, mean ± SD). b. MLV RNA encoding GFP and pseudotyped with alphavirus structural genes were added to control or ΔMxra8 cells. Data are from three (MLV-CHIKV, n = 9) or four (MLV-WEEV and MLV-EEEV, n = 12) experiments: (two-tailed t-test with Holm-Sidak correction, ****, P < 0.0001, mean ± SD). c–d. CHIKV-AF15561 was incubated with control, ΔMxra8, and Mxra8-overexpressing MEFs at 4°C (c, left and d) or 37°C (c, right) as described in Methods. Cells were harvested, and RNA (CHIKV and Gapdh) was measured by (c) RT-qPCR or surface E2 protein was analyzed by (d) flow cytometry (3 experiments, c, n = 9; d, n = 5; one-way ANOVA with Dunnett’s test, ****, P < 0.001; mean ± SD). e–f. Mxra8-Fc, MXRA8-2-Fc, or OPG-Fc were mixed with CHIKV-181/25 prior to infection of 3T3 (e) or MRC-5 (f) cells. Data are from two (MRC-5, n = 6) or three (3T3, n = 8–12) experiments: mean ± SD. g. Blockade of CHIKV-181/25 infection in 3T3 cells with hamster anti-Mxra8 or isotype control mAbs (2 experiments, n = 6; mean ± SD). h. Trans-complementation of ΔMxra8 cells with vector, Mxra8, Mxra8 ΔC-tail, Mxra8 with GPI anchors (PLAP or Qa1-derived), or human MXRA8-2 (3 experiments: (n = 6, one-way ANOVA with Dunnett’s test, ****, P < 0.001, mean ± SD).
Figure 3
Figure 3. Direct binding of Mxra8 to CHIKV
a–c. Purified CHIKV-181/25 (a), CHIKV VLPs (b), or chimeric EEEV virions (c) were captured with anti-CHIKV or -EEEV human mAbs. Mxra8-Fc, MXRA8-2-Fc, or OPG-Fc and positive controls mAbs (CHK-11 or EEEV-10) were added. Data are from two (b, c) or three (a) experiments (a, n = 8; b, n = 4; c, n = 6): mean ± SD. d. (Left) Sensograms of Mxra8 binding to CHIKV VLP. Experimental curves (black traces) were fit using a 1:1 binding model (red traces). (Right) Representative response curve for steady-state analysis, where binding is plotted versus Mxra8 concentration. Inset. Linear Scatchard plot (4 experiments; mean and standard error of the mean). e. Antibody blockade of Mxra8-Fc binding to CHIKV. Virus was incubated with indicated human mAbs against CHIKV, WNV (E16), or no mAb prior to the addition of Mxra8-Fc (4 experiments, n = 12; one-way ANOVA with Dunnett’s test, ****, P < 0.001, mean ± SD). f. Residues that result in loss of Mxra8-Fc binding to cell surface displayed CHIKV E2-E1. Residues are considered involved in the epitope if there is diminished binding without loss of protein integrity as judged by retention of interaction with mAbs (except for those previously mapped to a specific residue). Graphs are shown for four A domain (W64, D71, T116, and I121A) and three B domain (I190, Y199, and I217) alanine mutations (see also Supplementary Table 3). Data are from two experiments.
Figure 4
Figure 4. Mxra8 contributes to alphavirus pathogenesis
(a) Surface expression of MXRA8 on primary human keratinocytes, dermal fibroblasts, synovial fibroblasts, osteoblasts, chondrocytes, and skeletal muscle cells. One experiment of three is shown. (b) Cells were pre-incubated with anti-MXRA8 blocking mAbs prior to addition of CHIKV-AF15561 and processed for E2 staining (3 experiments, n = 9; one-way ANOVA with Dunnett’s test, ****, P < 0.0001). c–d. Mxra8-Fc or JEV-13 mAb were incubated with CHIKV-AF15561 for 30 min prior to subcutaneous inoculation. (c) At 12, 24, and 72 h, CHIKV was measured in the ankle and calf muscle. (d) At 72 h, foot swelling was measured (2 experiments, n = 10; median viral titers: *, P < 0.05; **, P < 0.01; two-tailed Mann-Whitney test; mean foot swelling, ****, P < 0.0001; two-tailed unpaired t-test). e. Mxra8-Fc or JEV-13 mAb were mixed with ONNV immediately prior to subcutaneous inoculation. At 12 h, ONNV was measured in the ankle (2 experiments, n = 10; ****, P < 0.0001; two-tailed unpaired t-test; median values). f–g. Mxra8-Fc or JEV-13 mAb were administered via an intraperitoneal route 6 h prior to CHIKV-AF15561 inoculation in the footpad. At 24 h, CHIKV was measured in the ankle (f). At 72 h, foot swelling was measured (g) (2 experiments, n = 10; median viral titers: *, P < 0.05; two-tailed Mann-Whitney test; mean foot swelling, ****, P < 0.0001; two-tailed unpaired t-test). h–j. Pairs of anti-Mxra8 mAbs or isotype control hamster mAbs were administered via an intraperitoneal route 12 h prior to (h–i) or 8 or 24 hours after (j) inoculation of CHIKV-AF15561. At 12 (h) and 72 (h, j) h, CHIKV was measured. At 72 h, foot swelling (i) was measured (2 experiments, (h (left) and i: n = 10; **, P < 0.01; ****, P < 0.0001; one-way ANOVA with Dunnett’s test; h (middle and right): n = 10; **, P < 0.01; ***, P < 0.001; ****, P < 0.0001; Kruskal-Wallis with Dunn’s test; j: n = 8; **, P < 0.01; two-tailed Mann-Whitney test).

Comment in

References

    1. Weaver SC, Charlier C, Vasilakis N, Lecuit M. Zika, Chikungunya, and Other Emerging Vector-Borne Viral Diseases. Annual review of medicine. 2017 doi: 10.1146/annurev-med-050715-105122. - DOI - PMC - PubMed
    1. Vancini R, Hernandez R, Brown D. Alphavirus entry into host cells. Progress in molecular biology and translational science. 2015;129:33–62. doi: 10.1016/bs.pmbts.2014.10.002. - DOI - PubMed
    1. Cong L, et al. Multiplex genome engineering using CRISPR/Cas systems. Science. 2013;339:819–823. doi: 10.1126/science.1231143. science.1231143 [pii] - DOI - PMC - PubMed
    1. Jinek M, et al. RNA-programmed genome editing in human cells. eLife. 2013;2:e00471. doi: 10.7554/eLife.0047100471. [pii] - DOI - PMC - PubMed
    1. Pal P, et al. Development of a highly protective combination monoclonal antibody therapy against Chikungunya virus. PLoS Pathog. 2013;9:e1003312. - PMC - PubMed

Publication types

MeSH terms