. 2014 Feb 7;40(3):21-30.
doi: 10.14745/ccdr.v40i03a01.

Pertussis Surveillance in Canada: Trends to 2012

Affiliations

Pertussis Surveillance in Canada: Trends to 2012

T Smith et al. Can Commun Dis Rep. .

Abstract

Objective: The purpose of this report is to provide a summary of the pertussis activity in Canada.

Methods: A descriptive analysis of pertussis incidence by year, age group, gender and province/territory was conducted using national surveillance data, clinical administrative data and vital statistics data.

Results: Pertussis is an endemic cyclical disease in Canada with peaks in activity occurring every 2 to 5 years. Canada has experienced a decline in pertussis activity following the introduction of routine pertussis immunization programs. The incidence of pertussis is highest in infants and children. Hospitalization and mortality are more common among infants, particularly those less than three months of age. Trends in pertussis vary by province and territory. Canada experienced a notable increase in incidence in 2012. Reasons for this increase are unknown.

Conclusion: Our understanding of the epidemiology of pertussis in Canada could be enhanced by improved approaches for monitoring the disease. Although the peak in activity observed in 2012 could be an isolated event, further work to support outbreak response in provinces and territories, including rapid research tools and resources, should be considered.


Figures

Figure 1
Figure 1
Reported cases and incidence rate (per 100,000 population) of Pertussis in Canada by year, 1924 to 2012* *Case data from 1924 to 2011 were obtained from the Canadian Notifiable Diseases Surveillance System. Case data for 2012 were obtained directly from provinces and territories by CIRID and are preliminary. PEI did not report 1924-1928; Newfoundland did not report until 1949; Yukon did not report 1924-1955; Northwest Territories did not report 1924-1958; Nunavut data for 1999 are only partial, for 2007 & 2009 are missing, and for 2008, 2010-2011 are preliminary. Population data (July 1st annual estimates) were obtained from Statistics Canada.
Figure 2
Figure 2
Number of reported cases and hospitalizations for pertussis in Canada by year, 1995 to 2012*
Figure 3
Figure 3
Incidence rate (per 100,000 population) of pertussis reports in Canada by age group (in years) and year, 1980 to 2012* *Case data from 1980 to 2011 were obtained from the Canadian Notifiable Diseases Surveillance System. Case data for 2012 were obtained directly from provinces and territories by CIRID and are preliminary. Nunavut data for 1999 are only partial, for 2007 & 2009 are missing, and for 2008, 2010-2011 are preliminary. Population data (July 1st annual estimates) was obtained from Statistics Canada and uses.
Figure 4
Figure 4
Age distribution of pertussis cases in Canada, 1990 to 2012* *Case data from 1990 to 2011 were obtained from the Canadian Notifiable Diseases Surveillance System. Case data for 2012 were obtained directly from provinces and territories by CIRID and are preliminary. Nunavut data for 1999 are only partial, for 2007 & 2009 are missing, and for 2008, 2010-2011 are preliminary.
Figure 5
Figure 5
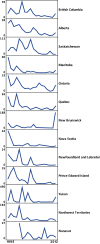
Trends in annual incidence of pertussis (per 100,000 population) by province/territory, 1995 to 2012 *Case data from 1995 to 2011 were obtained from the Canadian Notifiable Diseases Surveillance System. Case data for 2012 were obtained directly from provinces and territories by CIRID and are preliminary. Nunavut data for 1999 are only partial, for 2007 & 2009 are missing, and for 2008, 2010-2011 are preliminary; Population data (July 1st annual estimates) were obtained from Statistics Canada.
Figure 6
Figure 6
The number of pertussis cases and deaths, IMPACT, 1991 to 2012* *Data for 2012 are preliminary.

References

    1. Public Health Agency of Canada. Publicly funded Immunization Programs in Canada - Routine Schedule for Infants and Children including special programs and catch-up programs (as of March 2013). http://www.phac-aspc.gc.ca/im/ptimprog-progimpt/table-1-eng.php
    1. Public Health Agency of Canada. National Notifiable Diseases. http://www.phac-aspc.gc.ca/aids-sida/about/dis-eng.php
    1. Health and Welfare Canada. Canadian Communicable Disease Surveillance System. Disease-specific case definitions and surveillance methods. Can Dis Wkly Rep 1991;17 Suppl 3:1–35. - PubMed
    1. Health Canada. Case definitions for diseases under national surveillance. Can Commun Dis Rep 2000. May;26 Suppl 3:i–iv. - PubMed
    1. Public Health Agency of Canada. Case definitions for communicable diseases under national surveillance. Can Commun Dis Rep 2009;35 Suppl 2.