. 2017 Dec 7;43(12):248-256.
doi: 10.14745/ccdr.v43i12a01.

HIV in Canada-Surveillance Report, 2016

Affiliations

HIV in Canada-Surveillance Report, 2016

A C Bourgeois et al. Can Commun Dis Rep. .

Abstract

Background: Human immunodeficiency virus (HIV) continues to be a global public health concern, with 2.1 million people newly infected in 2015. Although many high-income countries have noted decreasing rates of HIV, between 2013 and 2015 Canada's rates had stabilized at 5.8 per 100,000 population.

Objective: To provide a descriptive overview of reported cases of HIV in Canada up until 2016 by geographic location, sex, age group, exposure category and race/ethnicity, with a focus on the most recent data.

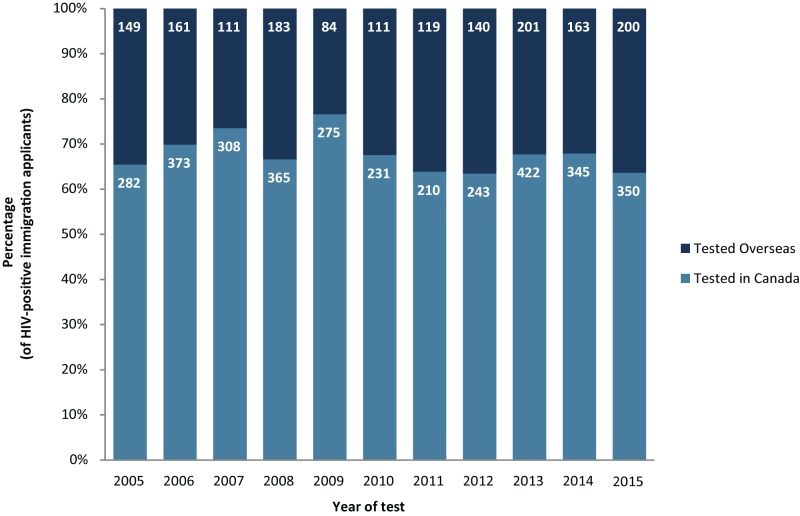
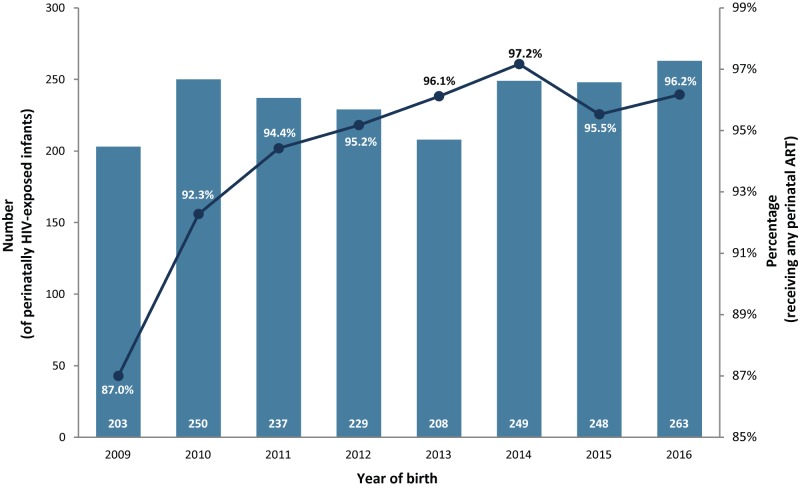
Methods: The Public Health Agency of Canada (PHAC) monitors HIV through the national HIV/AIDS Surveillance System (HASS), Immigration, Refugees and Citizenship Canada (IRCC), and the Canadian Perinatal HIV Surveillance Program (CPHSP). HASS is a passive, case-based system that collates non-nominal data voluntarily submitted by all Canadian provinces and territories. Data were also received from the IRCC and the CPHSP. Data were collated, tables and figures were prepared, then descriptive statistics were applied by PHAC and validated by each province and territory.

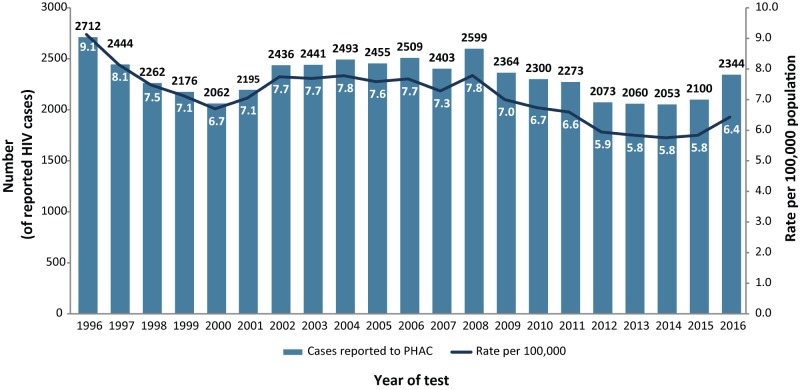
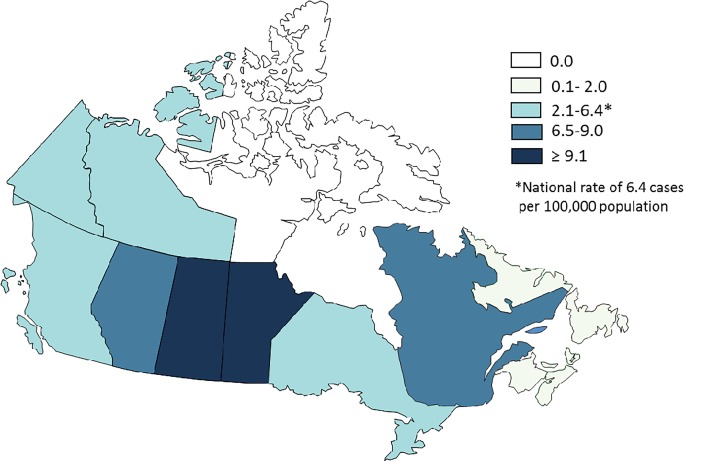
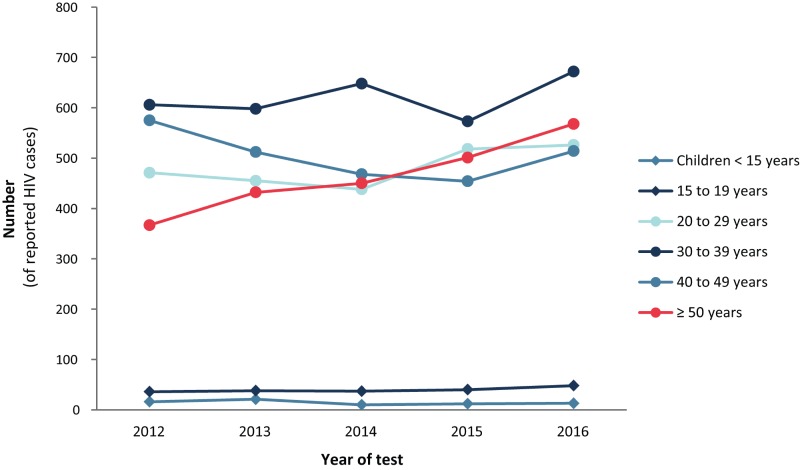
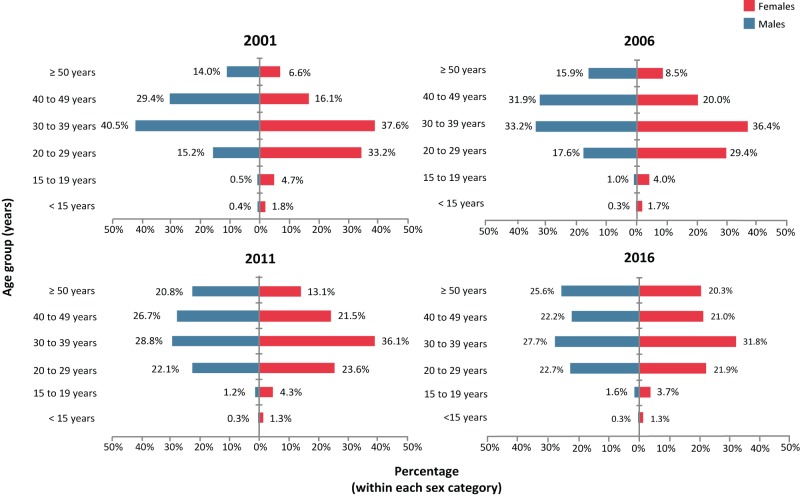
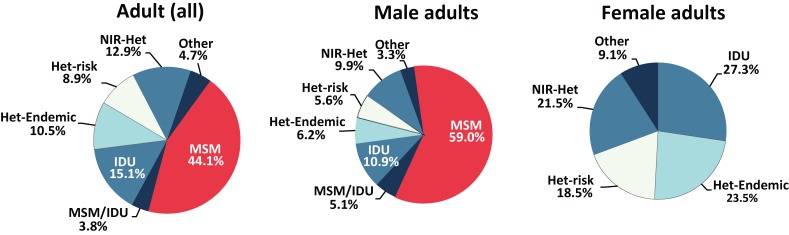
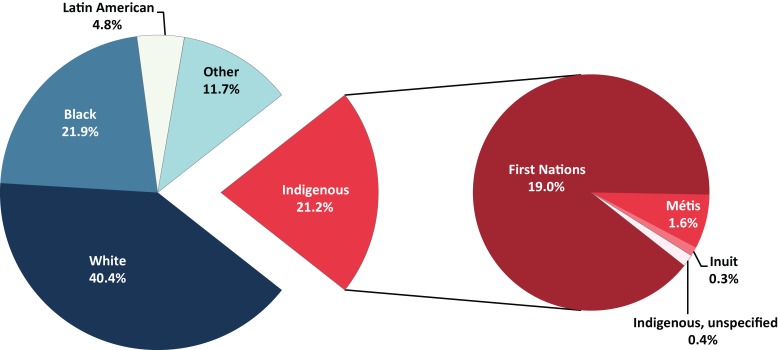
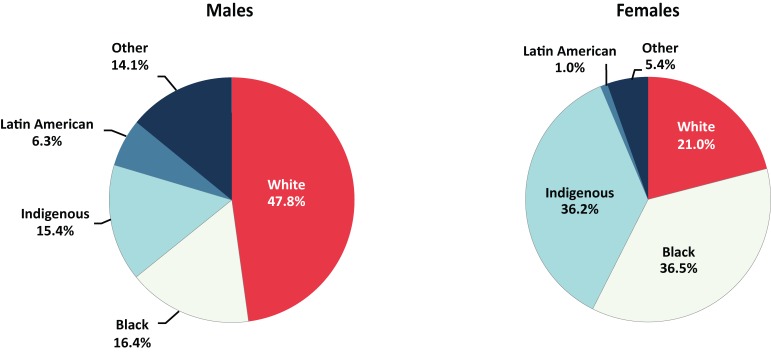
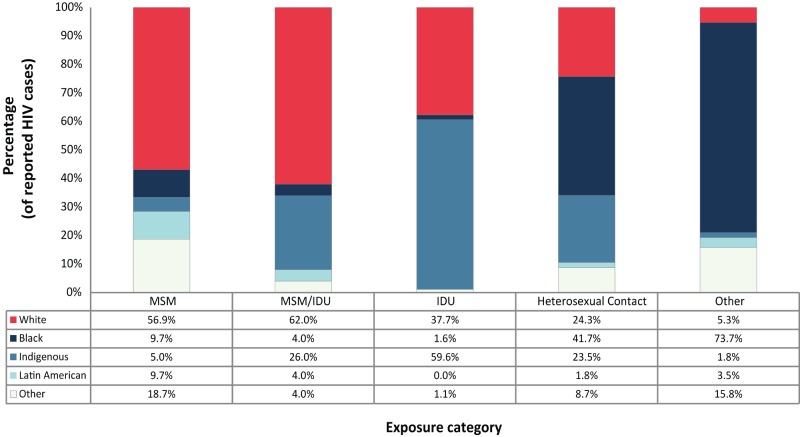
Results: A total of 2,344 new diagnoses of HIV were reported in 2016 in Canada, with a cumulative total of 84,409 cases since 1985. The national diagnosis rate increased from 5.8 per 100,000 population in 2015 to 6.4 per 100,000 population in 2016. Saskatchewan reported the highest provincial diagnosis rate in 2016 (15.1 per 100,000 population). In 2016, 76.6% of reported HIV cases were among males. Adults aged 30-39 years old accounted for 28.7% of all reported cases. There was a similar age distribution of HIV cases between sexes with notable increases in the proportion of the 50 years and over age group over the past five years. The "men who have sex with men" exposure category continued to represent the largest number and proportion of all reported HIV cases in adults (44.1%). White (40.4%), Black (21.9%) and Indigenous (21.2%) race/ethnicity categories represented the largest proportions of cases.

Conclusion: In 2016, Canada saw a slight increase in the number and rate of reported HIV cases compared with previous years. Although the diagnostic rate was lower than in all years prior to 2012, it is the highest of the past five years. While a number of possibilities exist to explain this increase, further investigation and additional data are needed in order to determine the cause and significance.


Conflict of interest statement

Conflict of Interest: None.

Figures

Figure 1
Figure 1. Number of reported HIV cases, including diagnostic rate, by year of test—Canada, 1996-2016
Abbreviation: PHAC, Public Health Agency of Canada Disaggregated data by year are not available before 1995 for some jurisdictions
Figure 2
Figure 2. HIV diagnosis rate (per 100,000 population) by province and territory—Canada, 2016
Population data source: Annual Demographic Statistics, Demography Division, Statistics Canada, October 2016
Figure 3
Figure 3. Proportion of reported HIV cases by age group and year of test—Canada, 2007–2016
Figure 4
Figure 4. Age group distribution of reported HIV cases by sex—Canada, 2016 1
1 Denominators used to calculate percentages exclude "sex not reported/transsexual/transgender" and "age group not reported"
Figure 5
Figure 5. Proportion of reported HIV cases among all adults (≥ 15 years old), adult males and adult females by exposure category—Canada, 2016 1,2
Abbreviations: Het-Endemic, heterosexual contact among people born in a country where HIV in endemic; Het-Risk, heterosexual contact with a person at-risk; HIV, human immunodeficiency virus; IDU, injection drug use; MSM, men who have sex with men; MSM/IDU, men who have sex with men and use injection drugs; NIR-Het, heterosexual contact with no identified risk 1 Percentages are based on the total number of reported cases excluding "NIR" and "not reported" cases. Note that exposure category data were not available for Quebec. Both male and female charts exclude HIV cases where sex was not reported or reported as transsexual or transgender 2 "Other" includes recipient of blood/clotting factor, unspecified exposure routes listed as “other” and Alberta, cases identified as "out of country”
Figure 6
Figure 6. Proportion of reported HIV cases (all ages) by race/ethnicity (including the Indigenous subgroups)—Canada, 2016 1,2,3,4
1 Race/ethnicity information was not available for Quebec and British Columbia 2 Excludes cases where race/ethnicity was not reported 3 Latin American includes, for example, Mexican, Central American and South American 4 Other includes, for example, Pakistani, Sri Lankan, Bangladeshi, Armenian, Egyptian, Iranian, Lebanese, Moroccan, Chinese, Japanese, Vietnamese, Cambodian, Indonesian, Laotian, Korean, Filipino, Somali, Haitian and Jamaican
Figure 7
Figure 7. Proportion of reported HIV cases (all ages) by sex and race/ethnicity—Canada, 2016 1,2,3,4
1 Race/ethnicity information is not available for Quebec and British Columbia 2 Denominators used to calculate percentages exclude HIV cases where race/ethnicity was "not reported" and HIV cases where sex was "not reported" or “reported” as transsexual or transgender 3 Latin American includes, for example, Mexican, Central American and South American 4 Other includes, for example, Pakistani, Sri Lankan, Bangladeshi, Armenian, Egyptian, Iranian, Lebanese, Moroccan, Chinese, Japanese, Vietnamese, Cambodian, Indonesian, Laotian, Korean, Filipino, Somali, Haitian and Jamaican
Figure 8
Figure 8. Proportion of reported HIV cases (all ages) by exposure category and race/ethnicity—Canada, 2016 1,2,3,4,5
Abbreviations: IDU, injection drug use; MSM, men who have sex with men; MSM/IDU, men who have sex with men and use injection drugs 1 Race/ethnicity information is not available for Quebec and British Columbia 2 Excludes HIV cases where race/ethnicity or exposure category was "not reported" 3 Latin American includes, for example, Mexican, Central American and South American 4 Other race/ethnicity includes, for example, Pakistani, Sri Lankan, Bangladeshi, Armenian, Egyptian, Iranian, Lebanese, Moroccan, Chinese, Japanese, Vietnamese, Cambodian, Indonesian, Laotian, Korean, Filipino, Somali, Haitian and Jamaican 5 Other exposure category includes recipient of blood/clotting factor and unspecified exposure routes listed as “other”
Figure 9
Figure 9. Proportion of HIV-positive immigration applicants by testing location and year of test, 2005–2014 1,2
1 Immigration, Refugees and Citizenship Canada, IRCC HIV Database as of July 2017. Immigration, Refugees and Citizenship Canada, IRCC HB Post-Arrival Health Public Health Liaison Unit Provincial Notifications - Overseas Notifications Database as of July 2017. Reproduced and distributed with the permission of Immigration, Refugees and Citizenship Canada 2 For applicants tested in Canada, the year refers to the year of the test. For applicants tested overseas, the year refers to the year the applicant landed in Canada
Figure 10
Figure 10. Number of perinatally HIV-exposed infants and proportion of perinatally HIV-exposed infants receiving perinatal antiretroviral therapy by year of birth—Canada, 2009–2016
Abbreviation: ART, antiretroviral therapy

References

    1. UNAIDS. Prevention Gap Report, Joint United Nations Programme on HIV/AIDS, Geneva, 2016. http://www.unaids.org/sites/default/files/media_asset/2016-prevention-ga...
    1. World Health Organization. World Health Statistics 2017: monitoring health for the SDGs, Sustainable Development Goals, Geneva, 2017. http://www.who.int/gho/publications/world_health_statistics/2017/en/
    1. Public Health Agency of Canada. HIV and AIDS in Canada: Surveillance Report to December 31, 2014, Minister of Public Works and Government Services Canada, Ottawa, 2015. https://www.canada.ca/en/public-health/services/publications/diseases-co...
    1. Public Health Agency of Canada. Strengthening Federal Action in the Canadian Response to HIV/AIDS, Minister of Public Works and Government Services Canada, 14 August 2012. http://www.phac-aspc.gc.ca/aids-sida/fi-if/fa-if/2-eng.php. [Accessed 31 July 2017].
    1. Jonah L, Bourgeois AC, Edmunds M, Awan A, Varsaneux O, Siu W. AIDS in Canada—Surveillance Report, 2016. Can Commun Dis Rep 2017;43(12):257–61. - PMC - PubMed