. 2018 May 2:9:836.
doi: 10.3389/fimmu.2018.00836. eCollection 2018.

Differing Outcome of Experimental Autoimmune Encephalitis in Macrophage/Neutrophil- and T Cell-Specific gp130-Deficient Mice

Affiliations

Differing Outcome of Experimental Autoimmune Encephalitis in Macrophage/Neutrophil- and T Cell-Specific gp130-Deficient Mice

Kristian Holz et al. Front Immunol. .

Abstract

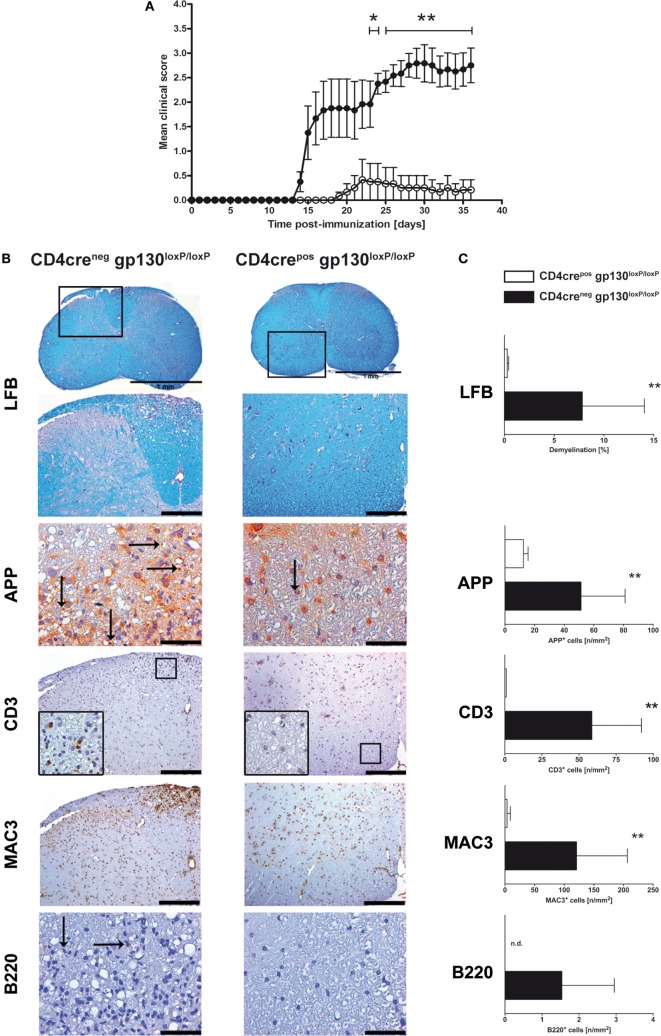
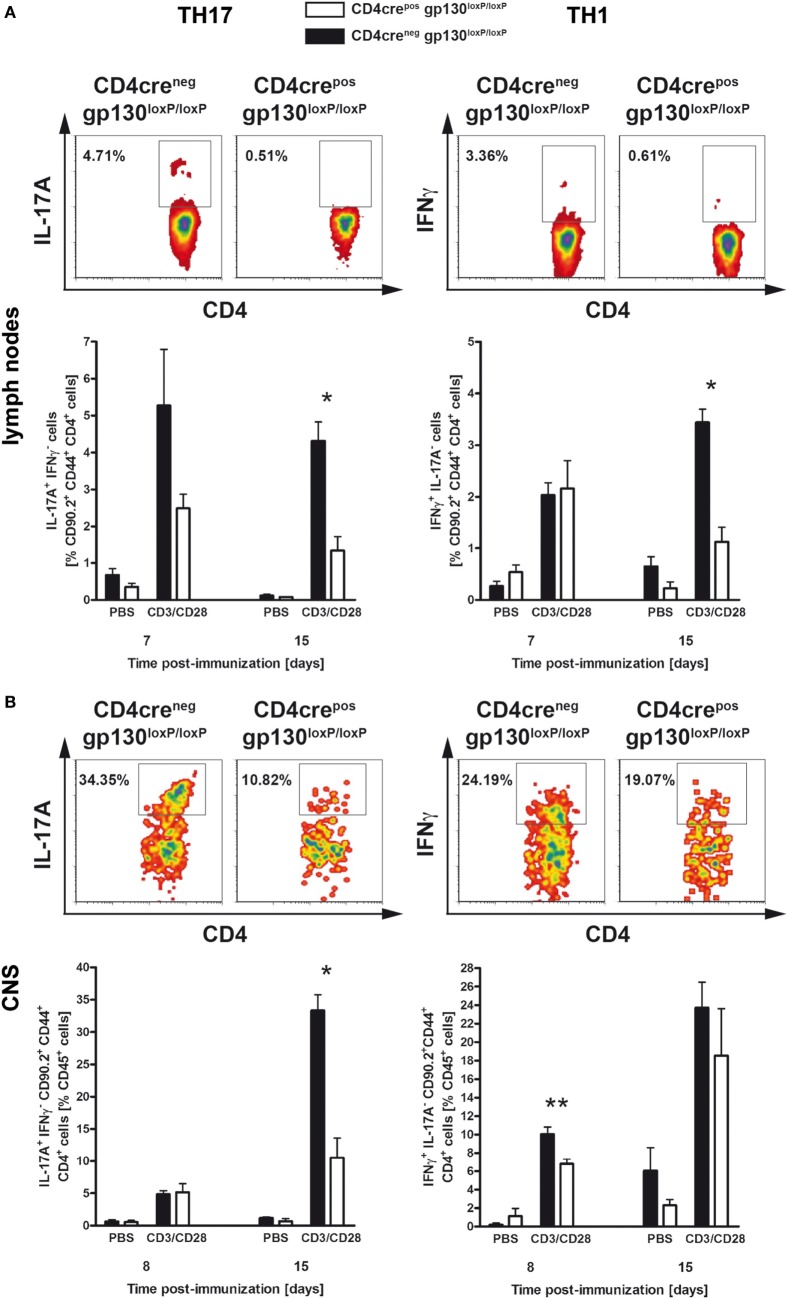
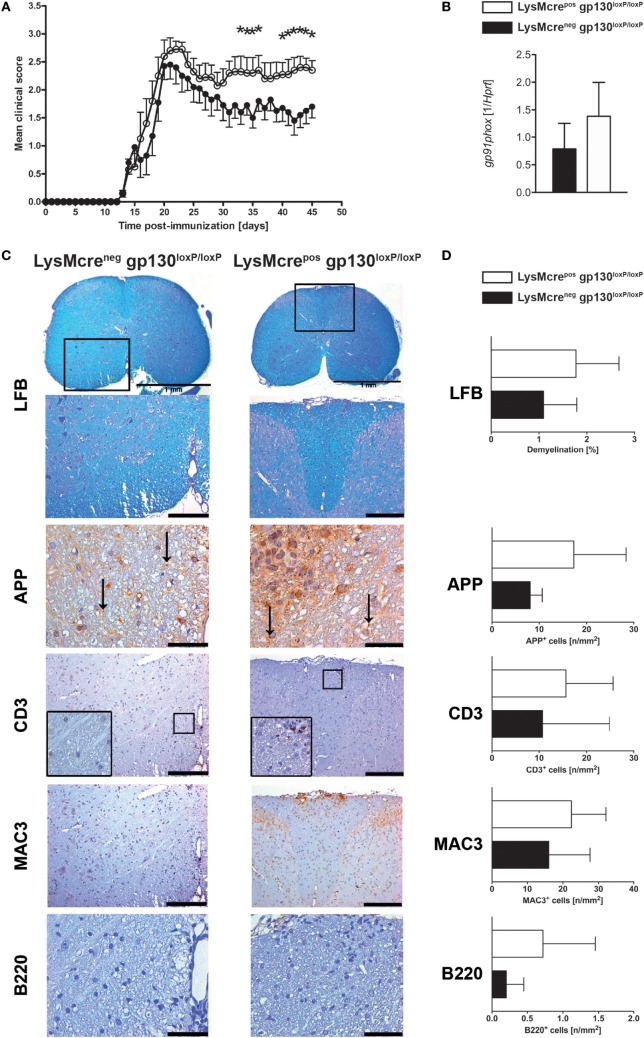
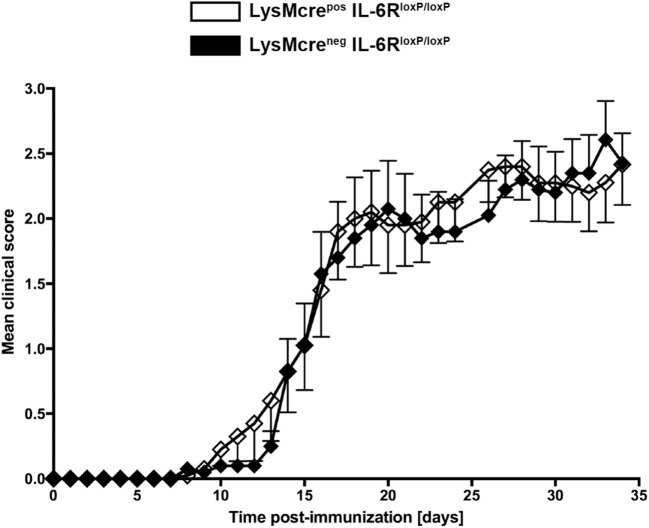
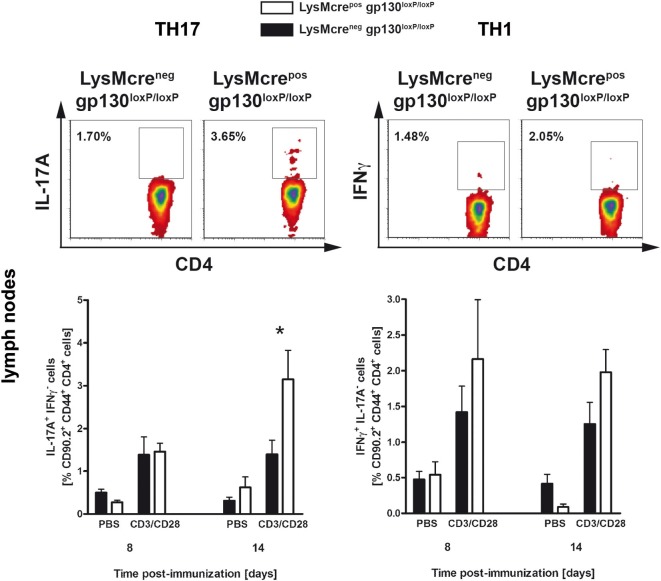
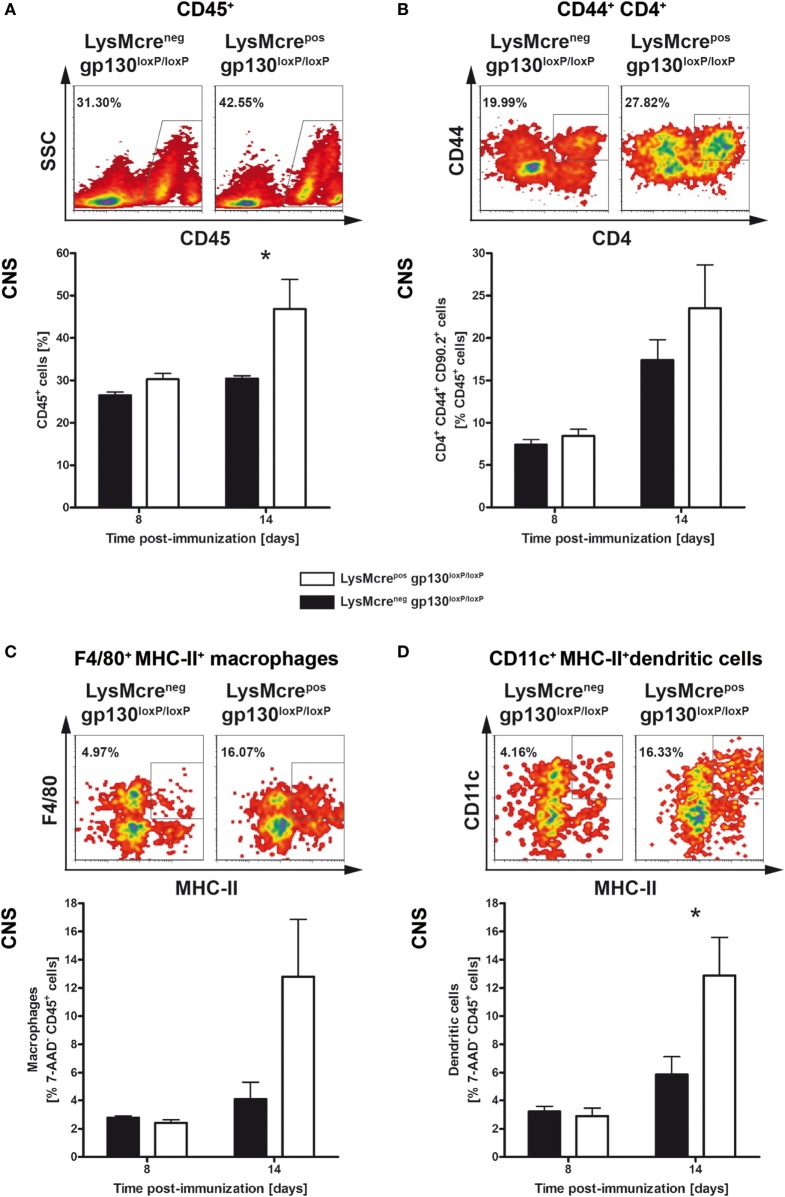
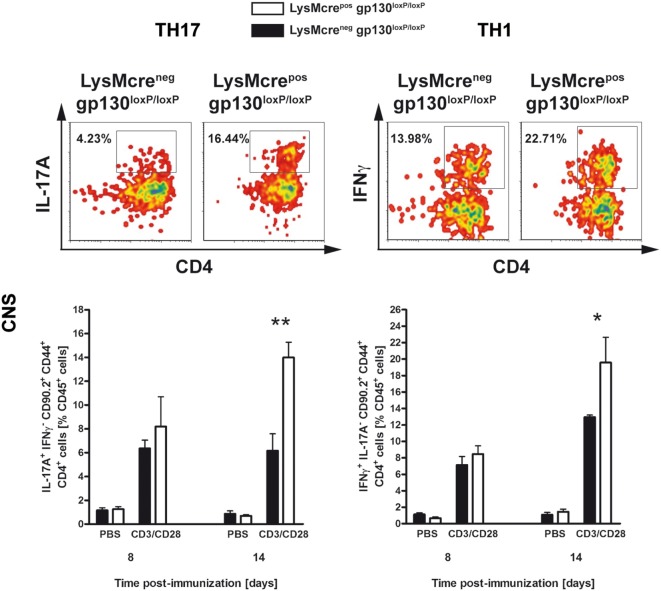
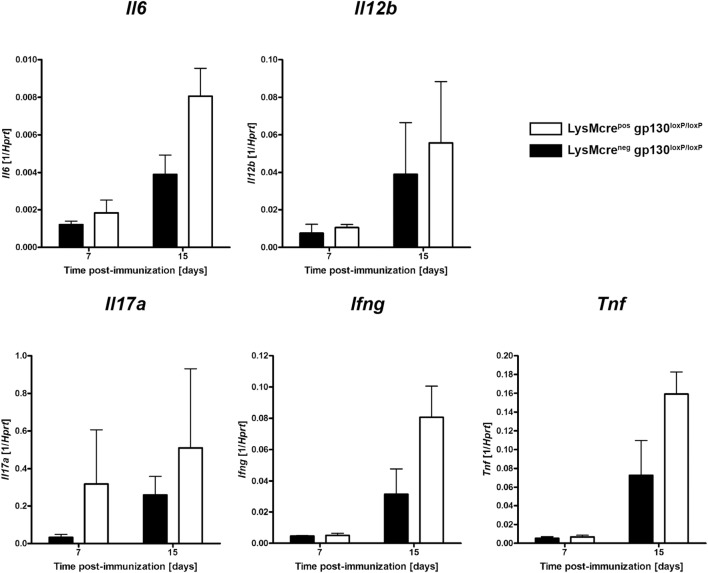
gp130 cytokines are differentially involved in regulating the T helper (H) 17-driven pathogenesis of experimental autoimmune encephalomyelitis (EAE), the animal model of human multiple sclerosis. Interleukin (IL)-6 directly promotes the development of TH17 cells through the gp130/IL-6R complex. By contrast, IL-27 has been shown to suppress a TH17 immune response by gp130/IL-27R-alpha (α) receptor ligation. The IL-27-dependent regulation of a TH17 development could be mediated on the level of CD4 T cells. However, because IL-27 also suppresses the secretion of the TH17-driving cytokines IL-6 and IL-12/23p40 in accessory cells, TH17 immune responses may also be controlled by IL-27 on the level of macrophages and/or neutrophils. To analyze these opposing effects of gp130 engagement on the pathogenesis of EAE, we immunized CD4+ T cell-specific gp130-deficient (CD4creposgp130loxP/loxP) and macrophage/neutrophil-specific gp130-deficient (LysMcreposgp130loxP/loxP) mice with the myelin-oligodendrocyte-glycoprotein peptide MOG35-55. Whereas inflammatory immune responses, TH17 differentiation, and pathology in CD4creposgp130loxP/loxP mice were mitigated, disease progression was eventually enhanced in LysMcreposgp130loxP/loxP mice. Exacerbated disease in MOG35-55-immunized LysMcreposgp130loxP/loxP mice was associated with an elevated development of TH17 cells and increased infiltration of the central nervous system with leukocytes indicating a suppressive role of macrophage/neutrophil-gp130. To further prove IL-6 to be responsible for the control of inflammation during EAE through gp130 on macrophages/neutrophils, we immunized LysMcreposIL-6RloxP/loxP mice. In contrast to LysMcreposgp130loxP/loxP mice, neuropathology in MOG35-55-immunized macrophage/neutrophil-specific IL-6R-deficient mice was not enhanced indicating that the alleviation of EAE through macrophage/neutrophil-gp130 is mediated independently of IL-6. Together, this different pathology in macrophage/neutrophil- and CD4 T cell-specific gp130-deficient mice suggests that gp130 cytokines modulate TH17 inflammation differentially by targeting distinct cell types.

Keywords: experimental autoimmune encephalomyelitis/multiple sclerosis; gp130 cytokine; inflammation mediators; interleukin-27; interleukin-6.


Figures

Figure 1
Figure 1
Disease progression and neuropathology in immunized CD4creposgp130loxP/loxP mice and CD4creneggp130loxP/loxP mice. Experimental autoimmune encephalomyelitis (EAE) was induced by active immunization of CD4creposgp130loxP/loxP mice (white circles and bars) and CD4creneggp130loxP/loxP littermates (black circles and bars). (A) Clinical disease of EAE. Data represent means and SEs of six mice per group. One experiment representative out of three performed is shown. (B,C) 21 days after immunization, histopathological and immunohistochemical analysis of spinal cord sections was performed. Panel (B) shows regions of demyelination [luxol fast blue (LFB)], distribution of amyloid precursor protein (APP) deposits representing axonal damage, and presence of CD3+, MAC3+, and B220+ cells. If not indicated, scale bars represent 50 µm (APP) and 200 µm (LFB, CD3, MAC3, and B220). Panel (C) shows extent of demyelination, quantity of APP deposits and infiltration of CD3+ T cells, MAC3+ macrophages, and B220+ B cells. Data represent means and SEs of five mice per group. Statistical analysis was performed using Mann–Whitney test. Asterisks indicate statistical significance (*p ≤ 0.05; **p ≤ 0.01). Abbreviation: n.d., not detectable.
Figure 2
Figure 2
TH17 and TH1 immune responses in immunized CD4creposgp130loxP/loxP mice and CD4creneggp130loxP/loxP littermates. CD4creposgp130loxP/loxP (white bars) mice and CD4creneggp130loxP/loxP (black bars) littermates were immunized with MOG35–55/CFA. During the course of EAE, the frequency of TH17 and TH1 cells was determined by intracellular cytokine staining and subsequent flow cytometry. Panels (A,B) show analysis of intracellular interleukin (IL)-17A (left) and IFNγ production (right) by anti-CD3/CD28-stimulated cells. For the analysis of TH17 and TH1 cells, single cell suspensions of (A) draining lymph nodes and (B) central nervous system (CNS)-infiltrating lymphocytes were performed at different time points (gated on CD90.2+CD44+CD4+ cells). Representative flow cytometry density plots of IL-17A- and IFNγ-producing cells isolated on day 15 are shown. Data represent means and SEs of at least three mice (A) and five mice (B) per group, respectively. (A,B) One experiment representative out of three performed is shown. Statistical analysis was performed using Mann–Whitney test. Asterisks indicate statistical significance (*p ≤ 0.05; **p ≤ 0.01).
Figure 3
Figure 3
Disease progression and neuropathology in immunized LysMcreposgp130loxP/loxP mice and LysMcreneggp130loxP/loxP mice. LysMcreposgp130loxP/loxP mice (white circles and bars) and LysMcreneggp130loxP/loxP littermates (black circles and bars) were immunized with MOG35–55/CFA. (A) Clinical course of EAE in LysMcreposgp130loxP/loxP mice compared with LysMcreneggp130loxP/loxP littermates. One experiment representative out of three performed is shown. Data represent means and SEs of 10 mice per group. (B) 15 days after immunization, CNS homogenates were assayed for Gp91phox gene expression by quantitative real-time PCR. Data are expressed as ratio of Gp91phox versus endogenous Hprt and expressed as means and SEs of four mice per group. Statistical analysis was performed using Mann–Whitney test. (C,D) 21 days after immunization, histopathological and immunohistochemical analysis of spinal cord sections was performed. Panel (C) shows regions of demyelination [luxol fast blue (LFB)], distribution of amyloid precursor protein (APP) deposits representing axonal damage and presence of CD3+, MAC3+, and B220+ cells. If not indicated, scale bars represent 50 µm (APP) and 200 µm (LFB, CD3, MAC3, and B220). Panel (D) shows extent of demyelination and quantity of APP deposits and of infiltration with CD3+ T cells, MAC3+ macrophages, and B220+ B cells. Data represent means and SEs of five (LysMcreposgp130loxP/loxP) and four (LysMcreneggp130loxP/loxP) mice per group, respectively. Statistical analysis was performed using Mann–Whitney test. Asterisks indicate statistical significance (*p ≤ 0.05).
Figure 4
Figure 4
Disease progression in immunized LysMcreposIL-6RloxP/loxP mice and LysMcrenegIL-6RloxP/loxP mice. LysMcreposIL-6RloxP/loxP mice (white rhombs) and LysMcrenegIL-6RloxP/loxP littermates (black rhombs) were immunized with MOG35–55/CFA. Clinical course of EAE in LysMcreposIL-6RloxP/loxP mice compared with LysMcrenegIL-6RloxP/loxP littermates. One experiment representative out of two performed is shown. Data represent means and SEs of 10 mice per group. Statistical analysis was performed using Mann-Whitney test.
Figure 5
Figure 5
TH17 and TH1 immune responses in immunized LysMcreposgp130loxP/loxP mice and LysMcreneggp130loxP/loxP littermates. During the course of EAE, the frequency of TH17 and TH1 cells was determined by intracellular cytokine staining and subsequent flow cytometry. Analysis of intracellular IL-17A (left) and IFNγ production (right) by anti-CD3/CD28-stimulated cells is shown. For the analysis of TH17 and TH1 cells, single cell suspensions of the draining lymph nodes were performed at different time points (gated on CD90.2+CD44+CD4+ cells). Representative flow cytometry density plots of IL-17A- and IFNγ-producing cells isolated on day 14 are shown. Data represent means and SEs of five mice (day 8) and at least four mice (day 14) per group, respectively. One experiment representative out of two performed is shown. Statistical analysis was performed using Mann–Whitney test. Asterisks indicate statistical significance (*p ≤ 0.05).
Figure 6
Figure 6
Characterization of infiltrates in immunized LysMcreposgp130loxP/loxP mice and LysMcreneggp130loxP/loxP mice. LysMcreposgp130loxP/loxP mice (white bars) and LysMcreneggp130loxP/loxP littermates (black bars) were immunized with MOG35–55/CFA. During the course of EAE, the frequency of (A) CD45+ lymphocytes, (B) activated CD44+CD4+ T cells, (C) F4/80+MHC-II+ macrophages, and (D) CD11c+MHC-II+ dendritic cells was determined by flow cytometry. For the analysis, single cell suspensions of CNS-infiltrating lymphocytes were performed at different time points. Representative flow cytometry density plots of cells isolated on day 14 are shown. Data represent means and SEs of five mice per group. Statistical analysis was performed using Mann–Whitney test. Asterisks indicate statistical significance (*p ≤ 0.05).
Figure 7
Figure 7
TH17 and TH1 immune responses in the CNS of immunized LysMcreposgp130loxP/loxP mice and LysMcreneggp130loxP/loxP littermates. During the course of EAE, the frequency of CNS-infiltrating TH17 and TH1 cells was determined by intracellular cytokine staining and subsequent flow cytometry. Analysis of intracellular IL-17A (left) and IFNγ production (right) by anti-CD3/CD28-stimulated cells is shown. For the analysis of TH17 and TH1 cells, single cell suspensions of CNS-infiltrating lymphocytes were performed at different time points (gated on CD90.2+CD44+CD4+ cells). Representative flow cytometry density plots of IL-17A- and IFNγ-producing cells isolated on day 14 are shown. Data represent means and SEs of five mice per group. One experiment representative out of three performed is shown. Statistical analysis was performed using Mann–Whitney test. Asterisks indicate statistical significance (*p ≤ 0.05; **p ≤ 0.01).
Figure 8
Figure 8
Expression of cytokines during the course of EAE. Immunized LysMcreposgp130loxP/loxP mice (white bars) show enhanced expression of Il6, Il12b, Ifng, Il17a, and Tnf compared with LysMcreneggp130loxP/loxP littermates (black bars). At different time points after EAE induction, CNS homogenates were assayed for gene expression by quantitative real-time RT-PCR. Data are expressed as ratio of induced factors versus endogenous Hprt and expressed as means and SEs of three mice per group. Statistical analysis was performed using Mann–Whitney test.

References

    1. Fletcher JM, Lalor SJ, Sweeney CM, Tubridy N, Mills KHG. T cells in multiple sclerosis and experimental autoimmune encephalomyelitis. Clin Exp Immunol (2010) 162:1–11. 10.1111/j.1365-2249.2010.04143.x - DOI - PMC - PubMed
    1. Petermann F, Korn T. Cytokines and effector T cell subsets causing autoimmune CNS disease. FEBS Lett (2011) 585:3747–57. 10.1016/j.febslet.2011.03.064 - DOI - PubMed
    1. Fouser LA, Wright JF, Dunussi-Joannopoulos K, Collins M. Th17 cytokines and their emerging roles in inflammation and autoimmunity. Immunol Rev (2008) 226:87–102. 10.1111/j.1600-065X.2008.00712.x - DOI - PubMed
    1. Ouyang W, Kolls JK, Zheng Y. The biological functions of T helper 17 cell effector cytokines in inflammation. Immunity (2008) 28:454–67. 10.1016/j.immuni.2008.03.004 - DOI - PMC - PubMed
    1. Sospedra M, Martin R. Immunology of multiple sclerosis. Annu Rev Immunol (2005) 23:683–747. 10.1146/annurev.immunol.23.021704.115707 - DOI - PubMed

Publication types

MeSH terms

LinkOut - more resources