

A Census of Tandemly Repeated Polymorphic Loci in Genic Regions Through the Comparative Integration of Human Genome Assemblies
- PMID: 29770143
- PMCID: PMC5941971
- DOI: 10.3389/fgene.2018.00155
A Census of Tandemly Repeated Polymorphic Loci in Genic Regions Through the Comparative Integration of Human Genome Assemblies
Abstract
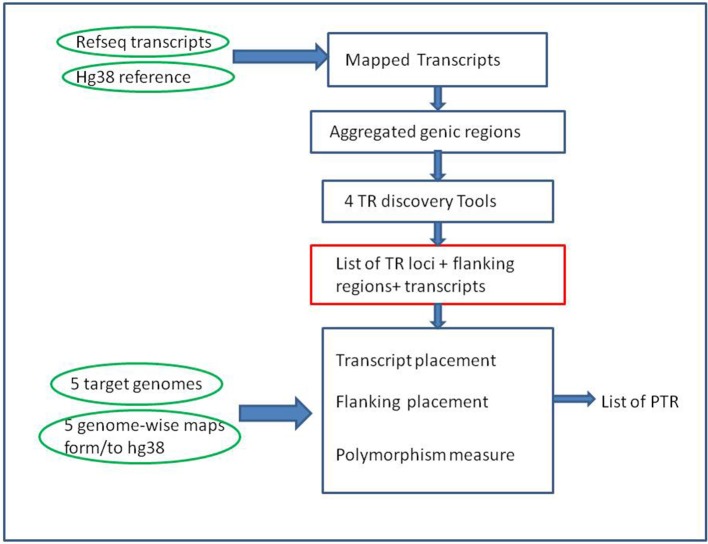
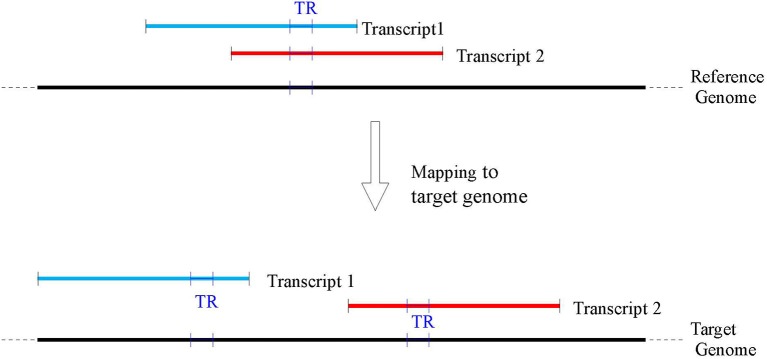
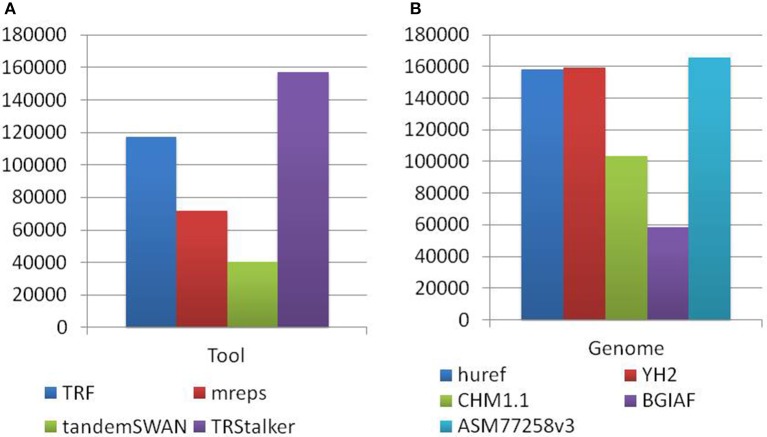
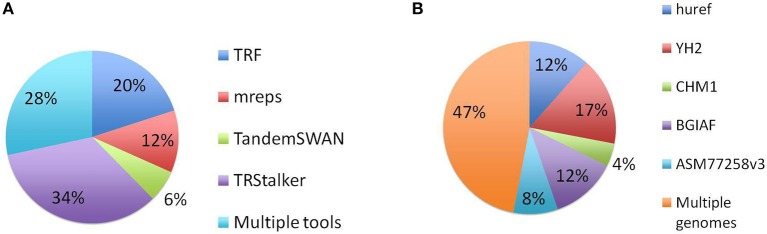
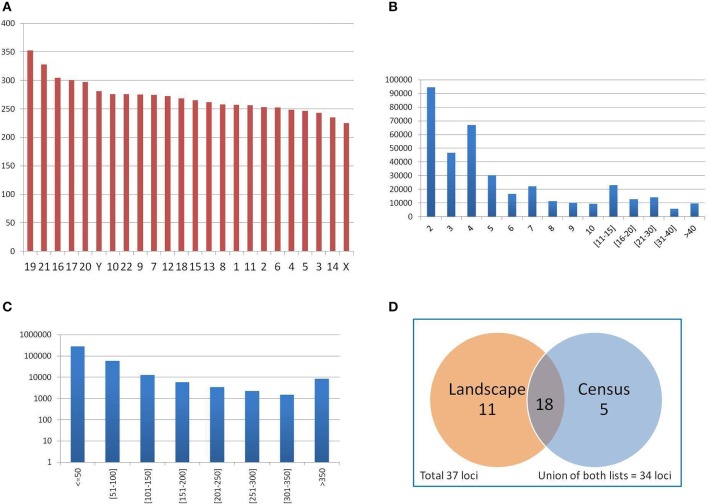
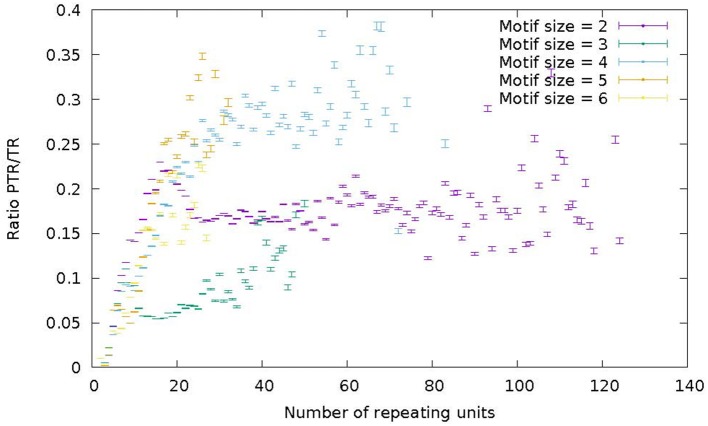
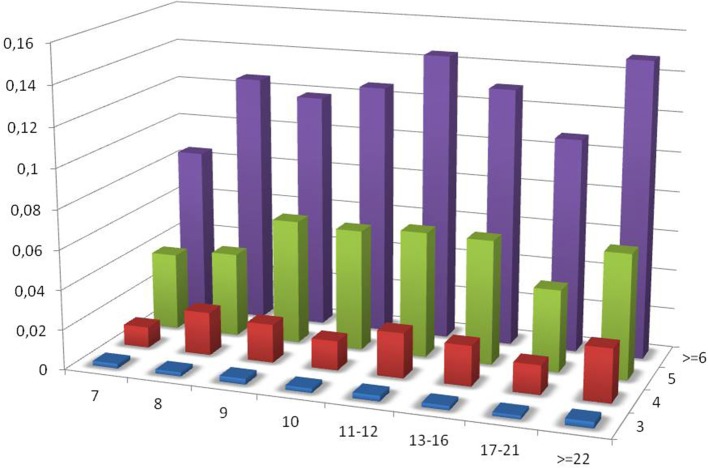
Polymorphic Tandem Repeat (PTR) is a common form of polymorphism in the human genome. A PTR consists in a variation found in an individual (or in a population) of the number of repeating units of a Tandem Repeat (TR) locus of the genome with respect to the reference genome. Several phenotypic traits and diseases have been discovered to be strongly associated with or caused by specific PTR loci. PTR are further distinguished in two main classes: Short Tandem Repeats (STR) when the repeating unit has size up to 6 base pairs, and Variable Number Tandem Repeats (VNTR) for repeating units of size above 6 base pairs. As larger and larger populations are screened via high throughput sequencing projects, it becomes technically feasible and desirable to explore the association between PTR and a panoply of such traits and conditions. In order to facilitate these studies, we have devised a method for compiling catalogs of PTR from assembled genomes, and we have produced a catalog of PTR for genic regions (exons, introns, UTR and adjacent regions) of the human genome (GRCh38). We applied four different TR discovery software tools to uncover in the first phase 55,223,485 TR (after duplicate removal) in GRCh38, of which 373,173 were determined to be PTR in the second phase by comparison with five assembled human genomes. Of these, 263,266 are not included by state-of-the-art PTR catalogs. The new methodology is mainly based on a hierarchical and systematic application of alignment-based sequence comparisons to identify and measure the polymorphism of TR. While previous catalogs focus on the class of STR of small total size, we remove any size restrictions, aiming at the more general class of PTR, and we also target fuzzy TR by using specific detection tools. Similarly to other previous catalogs of human polymorphic loci, we focus our catalog toward applications in the discovery of disease-associated loci. Validation by cross-referencing with existing catalogs on common clinically-relevant loci shows good concordance. Overall, this proposed census of human PTR in genic regions is a shared resource (web accessible), complementary to existing catalogs, facilitating future genome-wide studies involving PTR.
Keywords: catalog; fuzzy tandem repeats; genic regions; measure of polymorphism; polymorphic tandem repeats; short tandem repeats; tandem repeat detection tools; variable number tandem repeats.
Figures
Similar articles
-
Isolated clusters of paired tandemly repeated sequences in the Xenopus laevis genome.Mol Cell Biol. 1984 Feb;4(2):254-9. doi: 10.1128/mcb.4.2.254-259.1984. Mol Cell Biol. 1984. PMID: 6700590 Free PMC article.
-
Analysis of Tandem Repeats in Short-Read Sequencing Data: From Genotyping Known Pathogenic Repeats to Discovering Novel Expansions.Curr Protoc. 2024 Nov;4(11):e70010. doi: 10.1002/cpz1.70010. Curr Protoc. 2024. PMID: 39499075 Free PMC article.
-
Insights from a genome-wide truth set of tandem repeat variation.bioRxiv [Preprint]. 2023 May 8:2023.05.05.539588. doi: 10.1101/2023.05.05.539588. bioRxiv. 2023. PMID: 37214979 Free PMC article. Preprint.
-
Tandem Repeats in Proteins: Prediction Algorithms and Biological Role.Front Bioeng Biotechnol. 2015 Sep 24;3:143. doi: 10.3389/fbioe.2015.00143. eCollection 2015. Front Bioeng Biotechnol. 2015. PMID: 26442257 Free PMC article. Review.
-
Statistical approaches to detecting and analyzing tandem repeats in genomic sequences.Front Bioeng Biotechnol. 2015 Mar 17;3:31. doi: 10.3389/fbioe.2015.00031. eCollection 2015. Front Bioeng Biotechnol. 2015. PMID: 25853125 Free PMC article. Review.
Cited by
-
ONT in Clinical Diagnostics of Repeat Expansion Disorders: Detection and Reporting Challenges.Int J Mol Sci. 2025 Mar 18;26(6):2725. doi: 10.3390/ijms26062725. Int J Mol Sci. 2025. PMID: 40141365 Free PMC article.
-
The Impact of SNCA Variations and Its Product Alpha-Synuclein on Non-Motor Features of Parkinson's Disease.Life (Basel). 2021 Aug 9;11(8):804. doi: 10.3390/life11080804. Life (Basel). 2021. PMID: 34440548 Free PMC article. Review.
-
Non-canonical RNA-DNA differences and other human genomic features are enriched within very short tandem repeats.PLoS Comput Biol. 2020 Jun 8;16(6):e1007968. doi: 10.1371/journal.pcbi.1007968. eCollection 2020 Jun. PLoS Comput Biol. 2020. PMID: 32511223 Free PMC article.
-
DNA Hypermethylation and Unstable Repeat Diseases: A Paradigm of Transcriptional Silencing to Decipher the Basis of Pathogenic Mechanisms.Genes (Basel). 2020 Jun 22;11(6):684. doi: 10.3390/genes11060684. Genes (Basel). 2020. PMID: 32580525 Free PMC article. Review.
-
Genome assembly composition of the String "ACGT" array: a review of data structure accuracy and performance challenges.PeerJ Comput Sci. 2023 Jul 13;9:e1180. doi: 10.7717/peerj-cs.1180. eCollection 2023. PeerJ Comput Sci. 2023. PMID: 37547391 Free PMC article.
References
-
- Boland C. R., Thibodeau S. N., Hamilton S. R., Sidransky D., Eshleman J. R., Burt R. W., et al. . (1998). A national cancer institute workshop on microsatellite instability for cancer detection and familial predisposition: development of international criteria for the determination of microsatellite instability in colorectal cancer. Cancer Res. 58, 5248–5257. - PubMed
LinkOut - more resources
Full Text Sources
Other Literature Sources
Research Materials