. 2018 Dec;80(6):2538-2548.
doi: 10.1002/mrm.27339. Epub 2018 May 16.

Effect of head motion on MRI B0 field distribution

Affiliations

Effect of head motion on MRI B0 field distribution

Jiaen Liu et al. Magn Reson Med. 2018 Dec.

Abstract

Purpose: To identify and characterize the sources of B0 field changes due to head motion, to reduce motion sensitivity in human brain MRI.

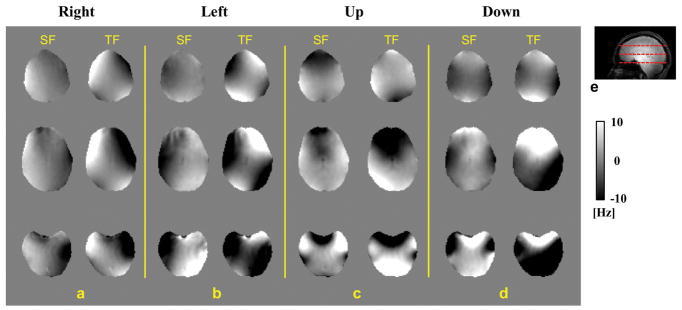
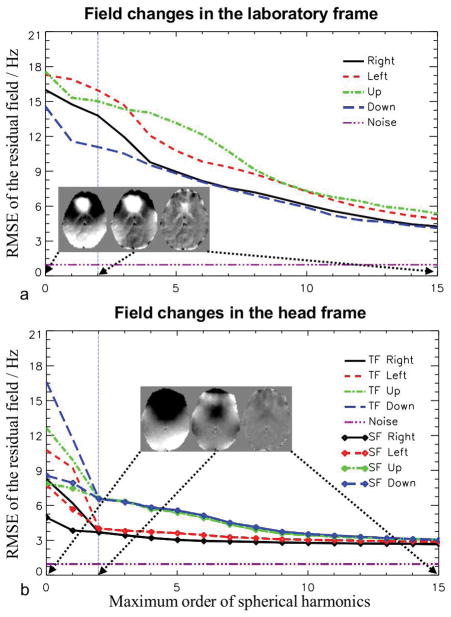
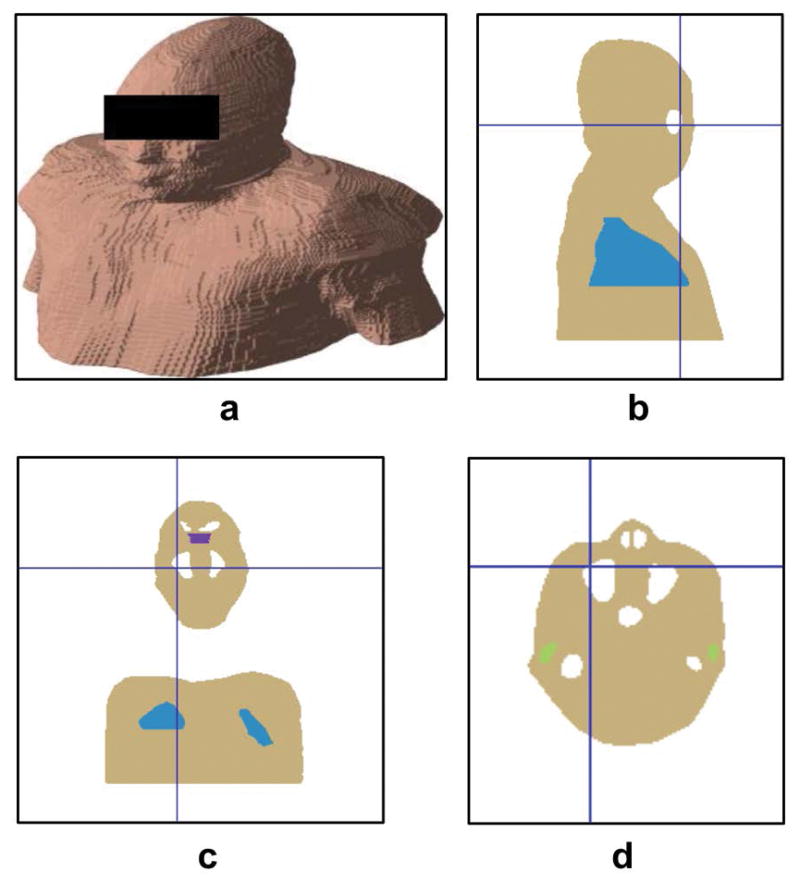
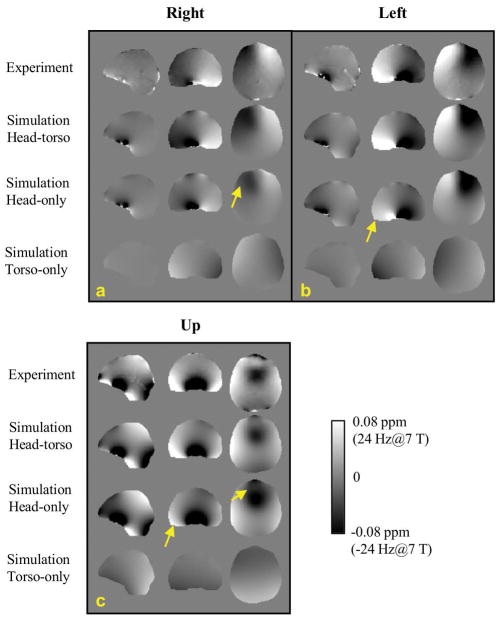
Methods: B0 fields were measured in 5 healthy human volunteers at various head poses. After measurement of the total field, the field originating from the subject was calculated by subtracting the external field generated by the magnet and shims. A subject-specific susceptibility model was created to quantify the contribution of the head and torso. The spatial complexity of the field changes was analyzed using spherical harmonic expansion.

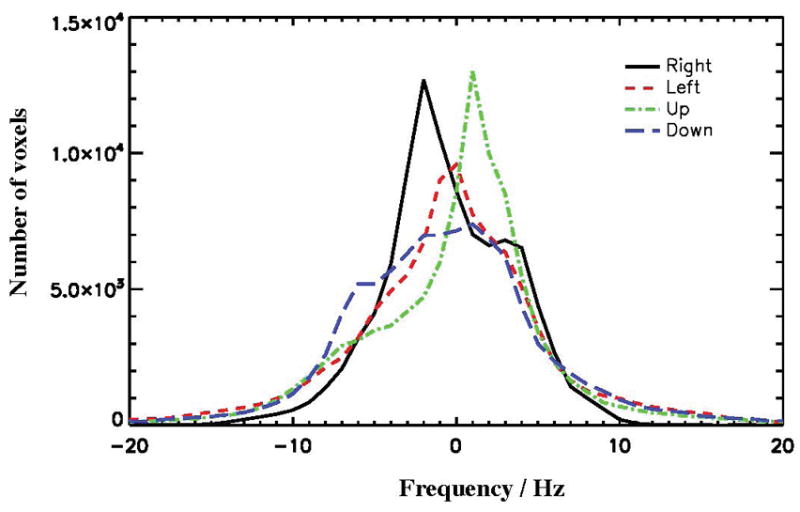
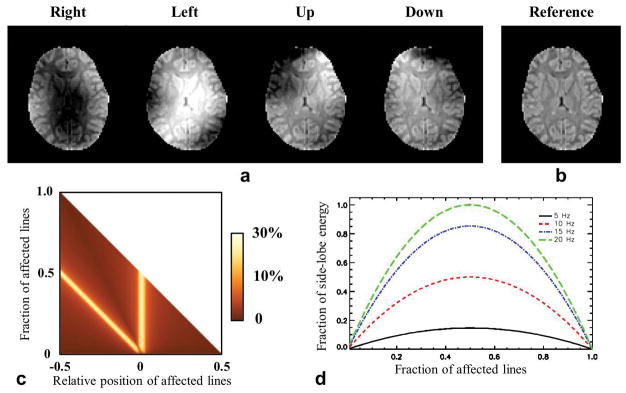
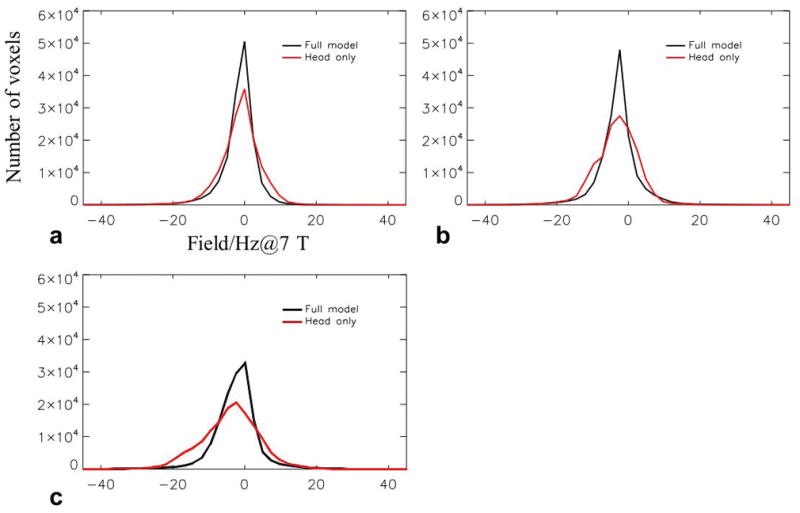
Results: Minor head pose changes can cause substantial and spatially complex field changes in the brain. For rotations and translations of approximately 5 º and 5 mm, respectively, at 7 T, the field change that is associated with the subject's magnetization generates a standard deviation (SD) of about 10 Hz over the brain. The stationary torso contributes to this subject-associated field change significantly with a SD of about 5 Hz. The subject-associated change leads to image-corrupting phase errors in multi-shot T 2 * -weighted acquisitions.

Conclusion: The B0 field changes arising from head motion are problematic for multishot T 2 * -weighted imaging. Characterization of the underlying sources provides new insights into mitigation strategies, which may benefit from individualized predictive field models in addition to real-time field monitoring and correction strategies.

Keywords: B0; MRI; head motion; susceptibility.


Figures

FIG. 1
FIG. 1
a–d: Field difference in the brain of subject #1 in four poses relative to the field in the reference pose in the head frame. The results on the left of each panel are the SF change while the TF change is shown on the right. e: A sagittal image of the subject. Dashed lines indicate the positions of the slices shown in a–d. The field map is presented in the unit of Hz offset from the resonance frequency at 7 T.
FIG. 2
FIG. 2
Distribution of the SF change in the head frame of subject #1 for the four poses relative to the reference.
FIG. 3
FIG. 3
RMSEs of the residual, when the field changes in the laboratory frame (a) and head frame (b) were modeled as spherical harmonic expansions, as a function of the maximum order of the harmonics. For the head frame, both TF and SF changes were analyzed. The purple dashed line shows the level of noise in the field measurement. The vertical dashed line marks the second order expansion, illustrating the maximum order of the shim coils on a typical high-field MRI system. The inserts show the TF residual fields of pose “Up” in a slice after the expansions of 0th, 2nd and 15th orders, respectively. The gray scale of the maps ranges from −10 to 10 Hz.
FIG. 4
FIG. 4
Impact of the motion-induced SF change on the synthetic GRE image with TE=25 ms. a: Resultant image magnitudes after two central k-space lines of the reference image (b, in the same color map as a) were replaced by the corresponding lines of the “field-corrupted” images. The data of field change was obtained from the measurement in the middle slice as shown in Fig. 1. c: Summary of NRMSE of corrupted image magnitude as a function of the fraction of affected lines and their relative position in the k-space. d: The FESL curves of the PSF as a function of the fraction of the affected lines and the frequency change.
FIG. 5
FIG. 5
The extracted susceptibility model of subject #5 in the simulation study. a: Surface view of the model. b–d: Sagittal, coronal and axial view of the model, respectively. Blue, white, green and purple regions indicate lung, air cavity, ear canal and upper nasal pathway, respectively.
FIG. 6
FIG. 6
Comparison of model-predicated field changes with experiment data in three head poses. The subject did not move as expected in the step of “Down” pose. The field data was converted to the resonance frequency at 7 T.
FIG. 7
FIG. 7
Histograms of the difference between calculated field change and experimental data for the head-only (red) and full (black) models. The head-only model shows increased error compared with the full model. a–c: Error distribution corresponding to “Right”, “Left” and “Up” poses, respectively.

References

    1. Andre JB, Bresnahan BW, Mossa-Basha M, Hoff MN, Smith CP, Anzai Y, Cohen WA. Toward Quantifying the Prevalence, Severity, and Cost Associated With Patient Motion During Clinical MR Examinations. J Am Coll Radiol. 2015;12:689–695. doi: 10.1016/j.jacr.2015.03.007. - DOI - PubMed
    1. Hedley M, Yan H. Motion artifact suppression: A review of post-processing techniques. Magn Reson Imaging. 1992;10:627–635. doi: 10.1016/0730-725X(92)90014-Q. - DOI - PubMed
    1. Zaitsev M, Maclaren J, Herbst M. Motion Artefacts in MRI: a Complex Problem with Many Partial Solutions. J Magn Reson Imaging JMRI. 2015;42:887–901. doi: 10.1002/jmri.24850. - DOI - PMC - PubMed
    1. Hennig J, Nauerth A, Friedburg H. RARE imaging: A fast imaging method for clinical MR. Magn Reson Med. 1986;3:823–833. doi: 10.1002/mrm.1910030602. - DOI - PubMed
    1. Liu G, Van Gelderen P, Duyn J, Moonen CTW. Single-shot diffusion MRI of human brain on a conventional clinical instrument. Magn Reson Med. 1996;35:671–677. doi: 10.1002/mrm.1910350508. - DOI - PubMed

Publication types