. 2019 Jan 1;68(1):32-46.
doi: 10.1093/sysbio/syy039.

Allele Phasing Greatly Improves the Phylogenetic Utility of Ultraconserved Elements

Affiliations

Allele Phasing Greatly Improves the Phylogenetic Utility of Ultraconserved Elements

Tobias Andermann et al. Syst Biol. .

Abstract

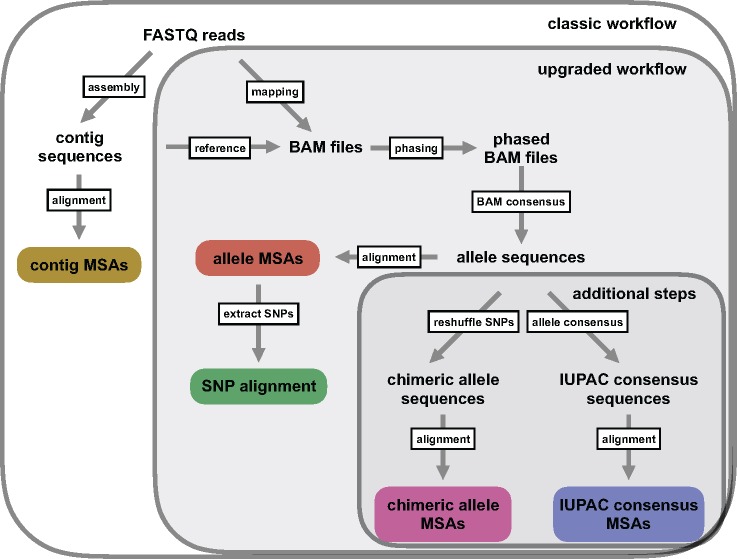
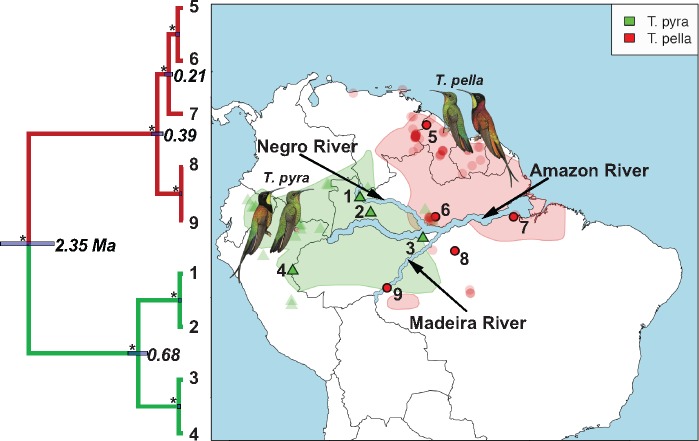
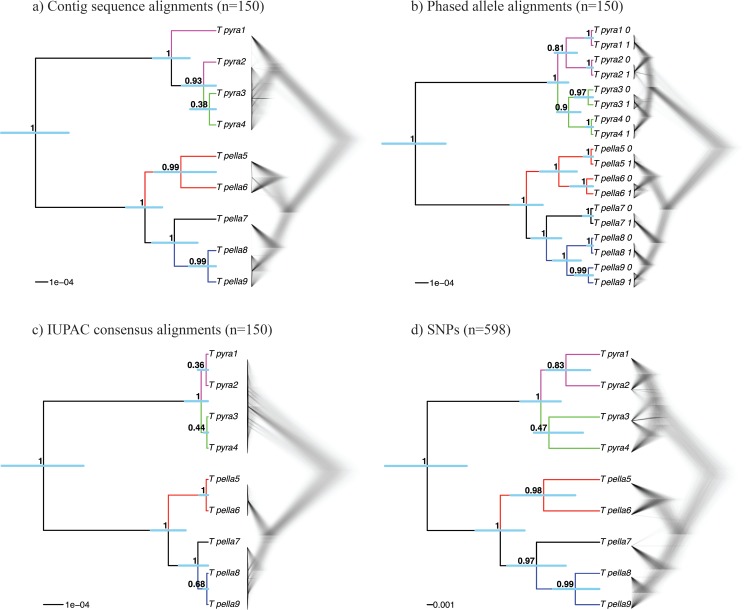
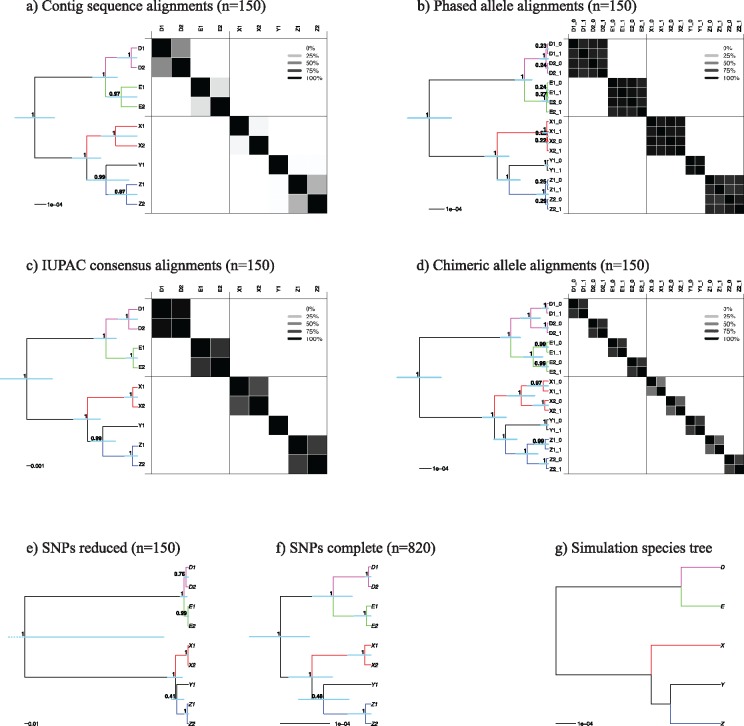
Advances in high-throughput sequencing techniques now allow relatively easy and affordable sequencing of large portions of the genome, even for nonmodel organisms. Many phylogenetic studies reduce costs by focusing their sequencing efforts on a selected set of targeted loci, commonly enriched using sequence capture. The advantage of this approach is that it recovers a consistent set of loci, each with high sequencing depth, which leads to more confidence in the assembly of target sequences. High sequencing depth can also be used to identify phylogenetically informative allelic variation within sequenced individuals, but allele sequences are infrequently assembled in phylogenetic studies. Instead, many scientists perform their phylogenetic analyses using contig sequences which result from the de novo assembly of sequencing reads into contigs containing only canonical nucleobases, and this may reduce both statistical power and phylogenetic accuracy. Here, we develop an easy-to-use pipeline to recover allele sequences from sequence capture data, and we use simulated and empirical data to demonstrate the utility of integrating these allele sequences to analyses performed under the multispecies coalescent model. Our empirical analyses of ultraconserved element locus data collected from the South American hummingbird genus Topaza demonstrate that phased allele sequences carry sufficient phylogenetic information to infer the genetic structure, lineage divergence, and biogeographic history of a genus that diversified during the last 3 myr. The phylogenetic results support the recognition of two species and suggest a high rate of gene flow across large distances of rainforest habitats but rare admixture across the Amazon River. Our simulations provide evidence that analyzing allele sequences leads to more accurate estimates of tree topology and divergence times than the more common approach of using contig sequences.


Figures

Figure 1.
Figure 1.
Depiction of the workflow used in this manuscript. Colored boxes represent different types of MSAs used for phylogenetic inference in this study. In addition to the standard UCE workflow (boxlabel: classic workflow) of generating contig MSAs (Faircloth et al. 2012; Smith et al. 2014; Faircloth 2015), we extended the bioinformatic processing to generate UCE allele MSAs, and to extract SNPs from these allele MSAs (boxlabel: upgraded workflow). We added these new functions to the PHYLUCE pipeline (Faircloth 2015). Additional data processing steps (boxlabel: additional steps) were executed in this study to test different codings of heterozygous positions.
Figure 2.
Figure 2.
Distribution ranges and mitochondrial phylogeny of the South American hummingbird genus Topaza. Tip labels of phylogeny and numbers on map represent sample IDs (Table 1) of sequenced Topaza specimens. Node labels in phylogeny show mean divergence time estimates for mitochondrial lineages in million years (Ma), with node bars representing the surrounding uncertainty [95% highest posterior density (HPD)]. All nodes are supported with 100% PP, as indicated by asterisks. Polygons on map represent distribution ranges of the two morphospecies (Topaza pyra and Topaza pella) as estimated by BirdLife International (http://www.birdlife.org). Transparent symbols (triangles and circles) represent Topaza sightings, which were downloaded from the eBird database (Sullivan et al. 2009). The major river systems in the Amazon drainage basin are labeled and emphasized in size for better visibility. Topaza illustrations were provided by (del Hoyo et al. 2016b).
Figure 3.
Figure 3.
Multispecies coalescent (MSC) species trees for the empirical Topaza data, based on four data types used in this study: contig sequence MSAs, phased allele sequence MSAs, IUPAC consensus sequence MSAs and SNP data. a) STACEY species tree from UCE contig alignments (formula image), b) STACEY species tree from UCE allele alignments (formula image), c) STACEY species tree from UCE IUPAC consensus alignments (formula image), and d) SNAPP species tree from UCE SNP data (1 SNP per locus if present, formula image). Shown are the maximum clade credibility trees (node values = PP, error-bars = 95% HPD of divergence times) and a plot of the complete posterior species tree distribution (excluding burn-in).
Figure 4.
Figure 4.
MSC species tree results for different data processing schemes of simulated data. a)–d) The STACEY results of the four types of MSAs analyzed in this study. Displayed in these panels are the maximum clade credibility trees and the similarity matrices depicting the PP of two samples belonging to the same clade, as calculated with SpeciesDelimitationAnalyser. Dark panels depict a high pairwise similarity, whereas light panels depict low similarity scores (see legend). e) and f) The maximum clade credibility trees resulting from SNAPP for our two SNP data sets (reduced and complete). g) The species tree under which the sequence data were simulated in this study. Node support values in PP, blue bars representing 95% HPD confidence intervals.
Figure 5.
Figure 5.
Posterior distributions of divergence times, estimated with STACEY. Each panel represents a node in the STACEY species tree (see panel titles) and shows density plots of the posterior node-height distribution (excl. 10% burnin) for each of the four sequence-based processing schemes: contig sequences, phased allele sequences, IUPAC consensus sequences and chimeric allele sequences (see legend for color-codes). The dotted vertical lines show the means of these posterior distributions. The solid vertical line shows the true node height value, which is the node height for the respective clade in the input species tree, under which the sequence alignments were simulated.

References

    1. Bodily P.M., Fujimoto M., Ortega C., Okuda N., Price J.C., Clement M.J., Snell Q.. 2015. Heterozygous genome assembly via binary classification of homologous sequence. BMC Bioinformatics 16:S5. - PMC - PubMed
    1. Bolger A.M., Lohse M., Usadel B.. 2014. Trimmomatic: a flexible trimmer for Illumina sequence data. Bioinformatics 30:2114–20. - PMC - PubMed
    1. Bouckaert R., Heled J., Kühnert D., Vaughan T., Wu C.-H., Xie D., Suchard M.A., Rambaut A., Drummond A.J.. 2014. BEAST 2: a software platform for Bayesian evolutionary analysis. PLoS Comput. Biol. 10:e1003537. - PMC - PubMed
    1. Bryant D., Bouckaert R., Felsenstein J., Rosenberg N.A., RoyChoudhury A.. 2012. Inferring species trees directly from biallelic genetic markers: bypassing gene trees in a full coalescent analysis. Mol. Biol. Evol. 29:1917–32. - PMC - PubMed
    1. Clair, C.C.S. 2003. Comparative permeability of roads, rivers, and meadows to songbirds in Banff national park. Conserv. Biol. 17:1151–1160.

Publication types