. 2018 Nov 1;125(5):1357-1367.
doi: 10.1152/japplphysiol.00397.2017. Epub 2018 May 17.

Tracheal acid or surfactant instillation raises alveolar surface tension

Affiliations

Tracheal acid or surfactant instillation raises alveolar surface tension

Tam L Nguyen et al. J Appl Physiol (1985). .

Abstract

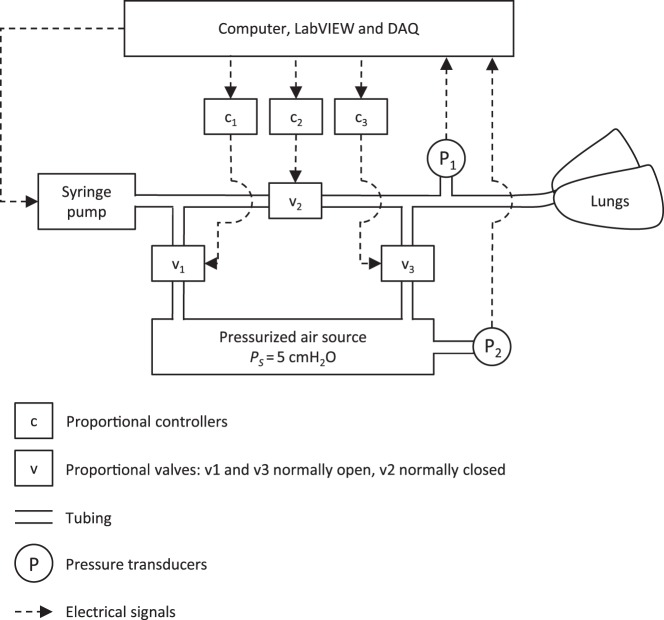
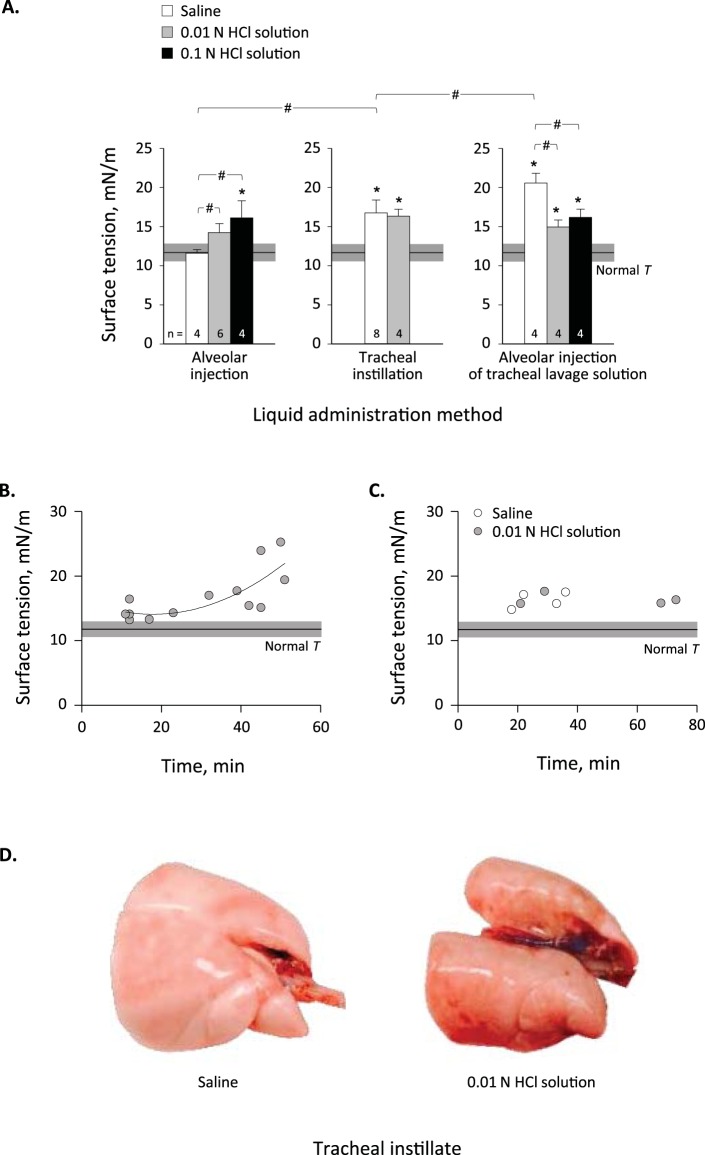
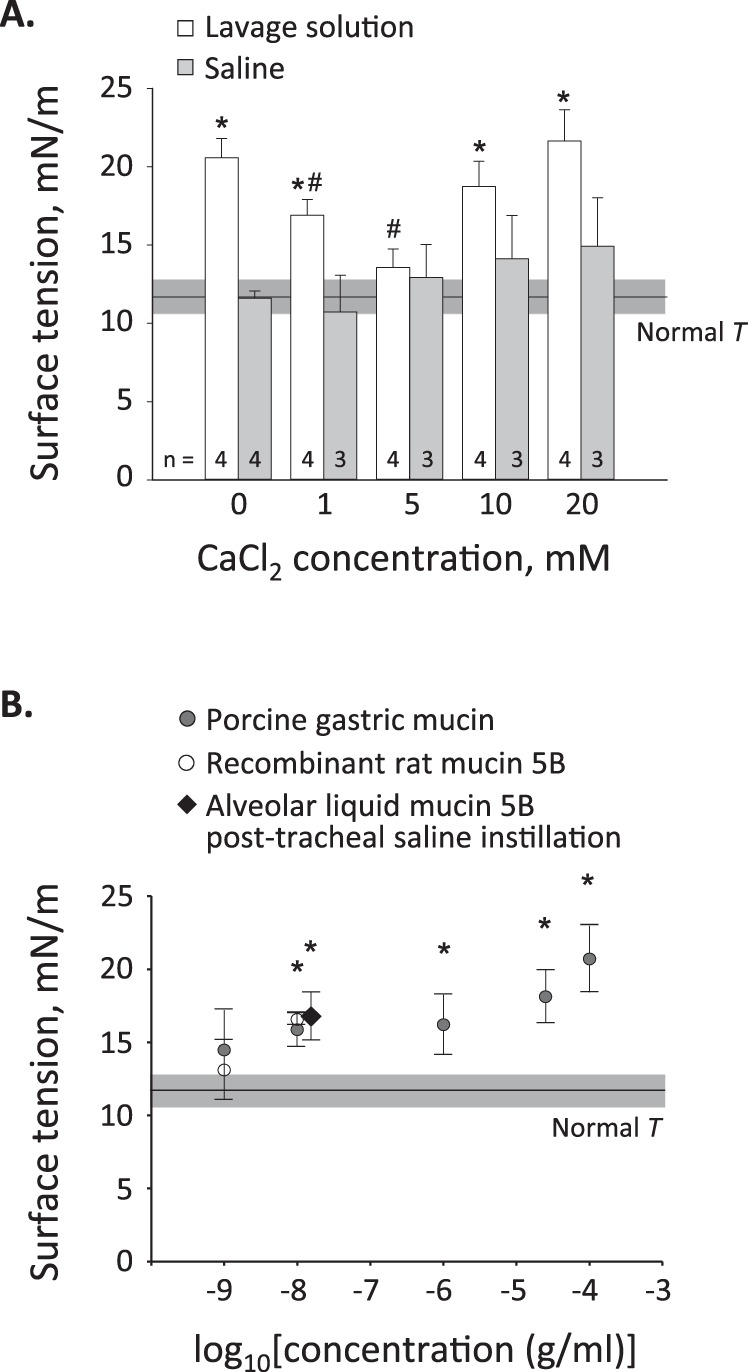
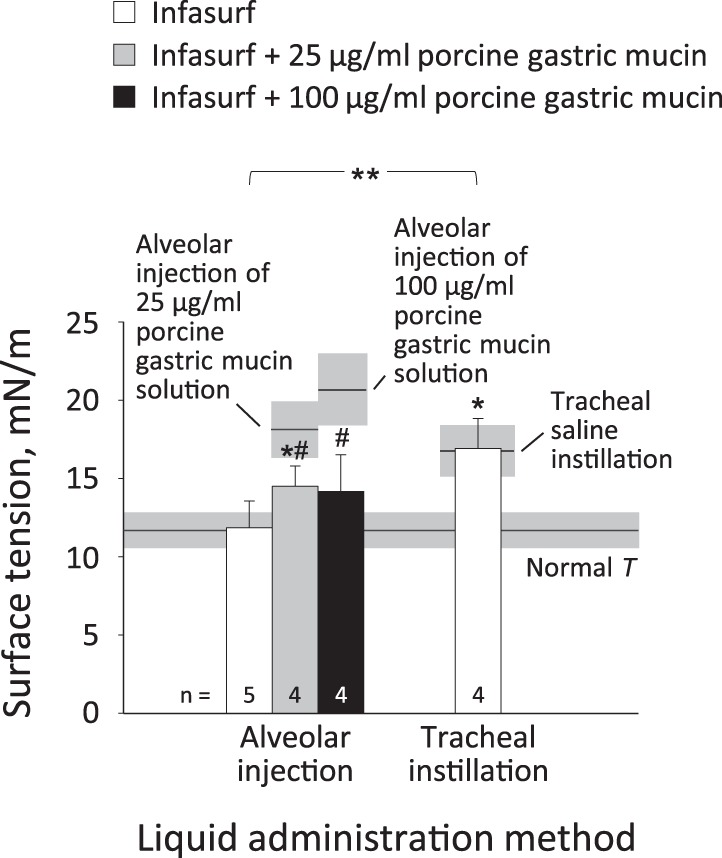
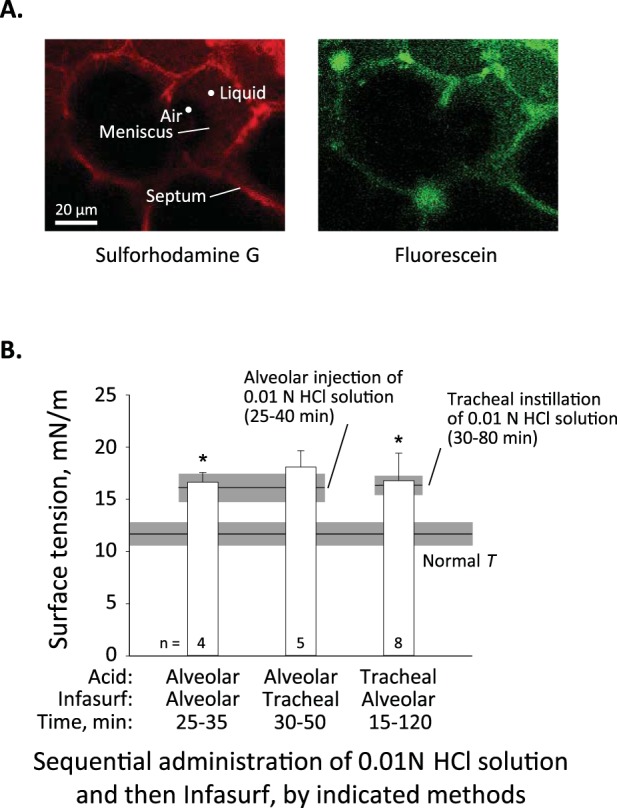
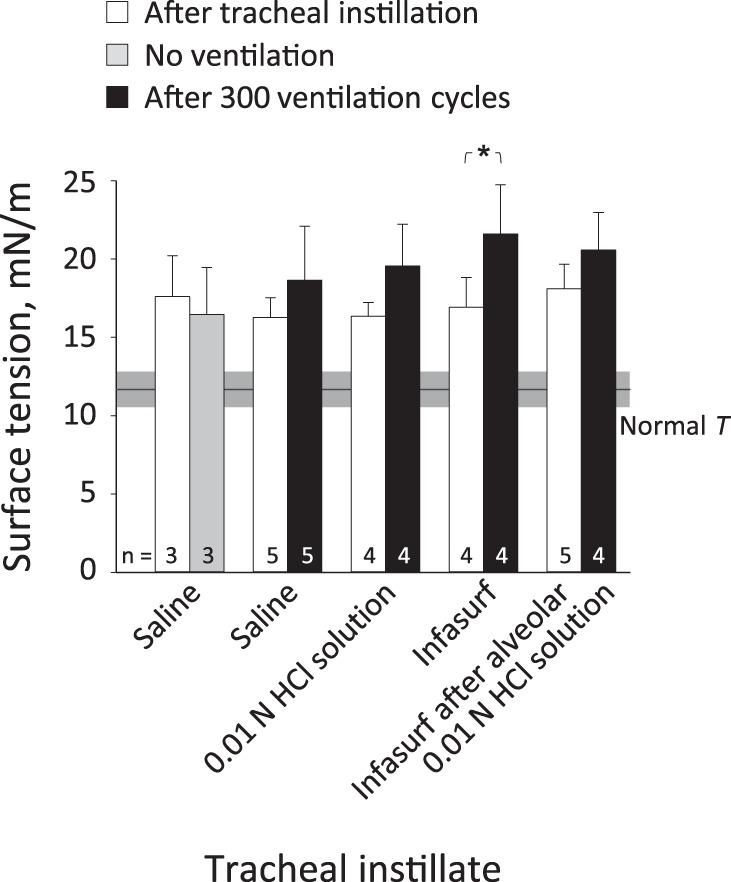
Whether alveolar liquid surface tension, T, is elevated in the acute respiratory distress syndrome (ARDS) has not been demonstrated in situ in the lungs. Neither is it known how exogenous surfactant, which has failed to treat ARDS, affects in situ T. We aim to determine T in an acid-aspiration ARDS model before and after exogenous surfactant administration. In isolated rat lungs, we combine servo-nulling pressure measurement and confocal microscopy to determine alveolar liquid T according to the Laplace relation. Administering 0.01 N (pH 1.9) HCl solution by alveolar injection or tracheal instillation, to model gastric liquid aspiration, raises T. Subsequent surfactant administration fails to normalize T. Furthermore, in normal lungs, tracheal instillation of control saline or exogenous surfactant raises T. Lavaging the trachea with saline and injecting the lavage solution into the alveolus raises T, suggesting that tracheal instillation may wash T-raising airway contents to the alveolus. Adding 0.01 N HCl or 5 mM CaCl2-either of which aggregates mucins-to tracheal lavage solution reduces or eliminates the effect of lavage solution on alveolar T. Following tracheal saline instillation, liquid suctioned directly out of alveoli through a micropipette contains mucins. Additionally, alveolar injection of gastric mucin solution raises T. We conclude that 1) tracheal liquid instillation likely washes T-raising mucins to the alveolus and 2) even exogenous surfactant that could be delivered mucin-free to the alveolus might not normalize T in acid-aspiration ARDS. NEW & NOTEWORTHY We demonstrate in situ in isolated lungs that surface tension is elevated in an acid-aspiration acute respiratory distress syndrome (ARDS) model. Following tracheal liquid instillation, also in isolated lungs, we directly sample alveolar liquid. We find that liquid instillation into normal lungs washes mucins to the alveolus, thereby raising alveolar surface tension. Furthermore, even if exogenous surfactant could be delivered mucin-free to the alveolus, exogenous surfactant might fail to normalize alveolar surface tension in acid-aspiration ARDS.

Keywords: acid aspiration; acute respiratory distress syndrome; airway mucins; exogenous surfactant therapy; tracheal instillation.


Figures

Fig. 1.
Fig. 1.
Fig. 1. Ventilation circuit. A reversible syringe pump is connected by an airflow line to isolated rat lungs. Along the airflow line are, in sequence, a tee branch with normally-open proportional valve v1 that controls air inflow to the syringe; normally-closed proportional valve v2 that controls lung inflation; a second tee branch with normally-open proportional valve v3 that controls lung deflation; and a blind-ended tee branch with a transducer that records transpulmonary pressure, PL, at the entrance to the trachea. The ends of both valved tee branches are connected to an air source of constant pressure PS = 5 cmH2O, which is monitored by another pressure transducer. A custom LabVIEW program controls the syringe pump; sends voltages out of three channels of a data acquisition (DAQ) device to three proportional controllers that convert the voltage signals into currents that control the proportional valves; and records the signal from the pressure transducer, also through the DAQ.
Fig. 2.
Fig. 2.
Acidic solution increases alveolar liquid surface tension, T. A: acidic solution increases T whether delivered by alveolar microinjection or tracheal instillation. Left: T at 10–30 min after alveolar microinjection of specified solutions. Center: T at ~30 min after tracheal instillation of specified solutions. Right: T at 10–30 min after alveolar injection of tracheal lavage solution without or with postlavage addition of HCl at specified concentrations. All solutions instilled into initially normal lungs. Statistics: *P < 0.05 vs. normal T; #P < 0.05 between specified groups. In this figure and all subsequent figures, T is determined at transpulmonary pressure of 15 cmH2O; normal saline is base for all solutions other than 100% Infasurf; tracheal instillation volume is 3 ml/kg; horizontal gray bars show mean ± SD T values for specified conditions—in this figure for normal T; normal T refers to interfacial T of liquid lining layer in aerated lungs as determined by Kharge et al. (37). B: after alveolar microinjection of 0.01 N HCl solution, dependence of T on time, t. Curve fit: T = 0.0072 × t2 – 0.26 × t + 16.39, R2 = 0.58. C: after tracheal instillation of specified solutions, dependence of T on time. D: pictures of representative lungs after tracheal instillation of specified solutions.
Fig. 3.
Fig. 3.
Mucins increase alveolar liquid surface tension. A: T at 10–30 min after alveolar microinjection of tracheal lavage solution or normal saline to which calcium, which aggregates mucins, is added at specified concentrations. Statistics: *P < 0.05 vs. normal T; #P < 0.05 vs. tracheal lavage solution without calcium. B: comparison of T-mucin concentration relation between alveolar mucin-solution injection experiments and alveolar liquid sample obtained following tracheal saline instillation. Circles: T at 10–30 min after alveolar microinjection of specified solutions with specified concentrations (n = 3–5 per group). Diamond: T at ~30 min following tracheal saline instillation (n = 8) plotted vs. mucin 5B concentration in alveolar liquid sampled following tracheal saline instillation (n = 3). Because assay for only one type of mucin, alveolar liquid mucin concentration likely exceeds reported value. Statistics: *P < 0.05 vs. normal T.
Fig. 4.
Fig. 4.
Exogenous surfactant partially reverses mucin effect on alveolar liquid surface tension. T at 10–30 min after alveolar injection or ~30 min after tracheal instillation of specified solutions. Statistics: *P < 0.05 vs. normal T; #P < 0.05 vs. alveolar injection of solution with same mucin-concentration in absence of Infasurf; **P < 0.05 between specified groups.
Fig. 5.
Fig. 5.
Exogenous surfactant does not reverse acid effect on alveolar liquid surface tension. Administration of 0.01 N HCl solution, labeled with 5 μM sulforhodamine G, followed by administration of Infasurf, labeled with 23 μM fluorescein. A: confocal images at ~30-µm subpleural depth of an alveolus that received acidic solution by alveolar injection and Infasurf by tracheal instillation, as evidenced by fluorescence in red and green channels, respectively. B: T after administration of acidic solution and subsequent administration of 100% Infasurf, by specified routes. Times between HCl administration and T determination are indicated. Truncated horizontal bars indicate T values at similar times after acid administration without subsequent surfactant administration. Statistics: *P < 0.05 vs. normal T.
Fig. 6.
Fig. 6.
Effect of ventilation on alveolar liquid surface tension after tracheal liquid instillation. T ~30 min after tracheal instillation of specified solutions and after 300 subsequent ventilation cycles with a minimum transpulmonary pressure, PL, of 5 cmH2O, tidal volume of 5 ml/kg and peak PL of 21.5 ± 2.7 cmH2O, or after same time in the absence of ventilation. Statistics: T in all groups significantly greater than normal T (P < 0.05, statistics not shown on graph); *P < 0.05 between specified groups.

Similar articles

Cited by

References

    1. Acosta EJ, Gitiafroz R, Zuo YY, Policova Z, Cox PN, Hair ML, Neumann AW. Effect of humidity on lung surfactant films subjected to dynamic compression/expansion cycles. Respir Physiol Neurobiol 155: 255–267, 2007. doi:10.1016/j.resp.2006.06.009. - DOI - PubMed
    1. Ali M, Lillehoj EP, Park Y, Kyo Y, Kim KC. Analysis of the proteome of human airway epithelial secretions. Proteome Sci 9: 4, 2011. doi:10.1186/1477-5956-9-4. - DOI - PMC - PubMed
    1. Ali MS, Pearson JP. Upper airway mucin gene expression: a review. Laryngoscope 117: 932–938, 2007. doi:10.1097/MLG.0b013e3180383651. - DOI - PubMed
    1. Aspros AJ, Coto CG, Lewis JF, Veldhuizen RAW. High-frequency oscillation and surfactant treatment in an acid aspiration model. Can J Physiol Pharmacol 88: 14–20, 2010. doi:10.1139/Y09-096. - DOI - PubMed
    1. Bachofen H, Schürch S, Michel RP, Weibel ER. Experimental hydrostatic pulmonary edema in rabbit lungs. Morphology. Am Rev Respir Dis 147: 989–996, 1993. doi:10.1164/ajrccm/147.4.989. - DOI - PubMed

Publication types

MeSH terms

LinkOut - more resources