. 2018 Jul 15;29(13):1693-1703.
doi: 10.1091/mbc.E18-02-0136. Epub 2018 May 17.

Septins regulate junctional integrity of endothelial monolayers

Affiliations

Septins regulate junctional integrity of endothelial monolayers

Joanna Kim et al. Mol Biol Cell. .

Abstract

Junctional integrity of endothelial monolayers is crucial to control movement of molecules and cells across the endothelium. Examining the structure and dynamics of cell junctions in endothelial monolayers, we discovered a role for septins. Contacts between adjacent endothelial cells were dynamic, with protrusions extending above or below neighboring cells. Vascular endothelial cadherin (VE-cadherin) was present at cell junctions, with a membrane-associated layer of F-actin. Septins localized at cell-junction membranes, in patterns distinct from VE-cadherin and F-actin. Septins assumed curved and scallop-shaped patterns at junctions, especially in regions of positive membrane curvature associated with actin-rich membrane protrusions. Depletion of septins led to disrupted morphology of VE-cadherin junctions and increased expression of VE-cadherin. In videos, septin-depleted cells displayed remodeling at cell junctions; regions with VE-cadherin were broader, and areas with membrane ruffling were wider. Septin depletion and junction disruption led to functional loss of junctional integrity, revealed by decreased transendothelial electric resistance and increased transmigration of immune cells. We conclude that septins, as cytoskeletal elements associated with the plasma membrane, are important for cell junctions and junctional integrity of endothelial monolayers, functioning at regions of positive curvature in support of actin-rich protrusions to promote cadherin-based cell junctions.


Figures
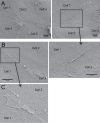
FIGURE 1:
FIGURE 1:
Surface views of cell junctions of human microvascular endothelial monolayers by scanning electron microscopy. (A) Low-magnification image of cell junctions between several cells. Scale bar, 5 µm. (B, C) Higher-magnification images of cell junctions. In many locations, the membranes at cell junctions are linear and smooth; in some cases, one cell protrudes over a neighbor. Some cell membranes show ruffles at the boundary. Scale bar = 5 µm.
FIGURE 2:
FIGURE 2:
Localization of septin 2, VE-cadherin, and F-actin at cell junctions of endothelial monolayers. Immunofluorescence staining of endogenous septin 2 (green) and VE-cadherin (red), combined with fluorescent phalloidin staining for F-actin (magenta). Top row: scale bar = 50 µm. Middle and bottom rows are higher magnification images of the boxed regions 1 and 2, respectively. In these two-dimensional projections, septin 2, VE-cadherin and F-actin localize near each other at cell junctions but with distinct differences.
FIGURE 3:
FIGURE 3:
Scallop-shaped and curved structures of septin 2 at cell junctions of endothelial monolayers. Endogenous septin 2 (green), VE-cadherin (red), and F-actin (magenta) revealed by antibody and fluorescent phalloidin staining. Septin 2 appears in curved scallop shapes, resolved more clearly in higher magnification images of the boxed region. Images are two-dimensional projections of Z-stacks of scanning confocal image planes. Scale bar = 5 µm.
FIGURE 4:
FIGURE 4:
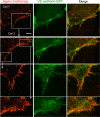
Septin 2 in curved structures at membranes with positive curvature. Cell junctions between three neighboring cells are shown. Cell 1 expresses septin 2-GFP, Cell 2 expresses septin 2-tdTomato, and Cell 3 expresses no fluorescent protein. The fluorescence patterns in Cells 2 and 3 reveal that septin 2 is present at regions of the cell edge with positive curvature. Two-dimensional projections of Z-stacks of scanning confocal images. Scale bar = 5 µm.
FIGURE 5:
FIGURE 5:
Septin 2 in curved structures at membranes with positive curvature. Cell 1 simultaneously expresses septin 2-tdTomato and VE-cadherin-GFP, adjacent to Cell 2, which does not express any fluorescent protein. VE-cadherin-GFP serves as a marker for the plasma membrane. Distribution of septin 2-tdTomato shows that septin 2 is enriched at regions of positive curvature at the base and along the sides of membrane protrusions. The top panel is a low-magnification view. The bottom panels show higher-magnification views of the boxed regions. Scale bar = 5 µm.
FIGURE 6:
FIGURE 6:
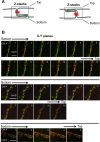
Localization of septin 2 and VE-cadherin at z-axis planes of cell junctions. (A) Diagrams illustrating possible z-axis locations for septin 2 (green) and VE-cadherin (red) at cell junctions. (B) z-Axis series of xy focal planes of immunofluorescence staining for endogenous septin 2 (green) and VE-cadherin (red). In the first example, in the top two rows of images, septin 2 curved regions are in focus from frames 1 to 7 but fall out of focus from 8 to 12. In contrast, VE-cadherin appears in focus in frames 7 to 12. In the second example, septin 2 is in focus from frames 1 to 6, with VE-cadherin in focus from frames 4 to 9. In the third example, unlike the first two, septin 2 and VE-cadherin appear in focus in the same frames; this specimen is very thin, compared with the first two.
FIGURE 7:
FIGURE 7:
Transmission electron micrographs of sagittal thin sections of cell junctions of an endothelial monolayer. Thin membrane protrusions from neighboring cells extend toward each other cell and overlap to different extents. Scale bar = 1 µm for A and B and 500 nm for C.
FIGURE 8:
FIGURE 8:
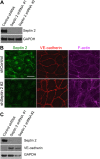
Septin 2 suppression alters VE-cadherin arrangement at cell junctions and the level of VE-cadherin expression. (A) Decreased septin 2 expression in endothelial cells (HDMVECs) expressing shRNAs targeting septin 2. Immunoblot of whole-cell lysates probed with anti-septin 2 and anti-GAPDH as a control. Two different shRNA sequences targeting septin 2 decrease expression. (B) Immuno­fluorescence staining for endogenous septin 2, VE-cadherin, and F-actin. Control endothelial cells in the top panels, expressing a control shRNA, show intact junctional localization of septin 2, VE-cadherin, and F-actin. Cells expressing shRNA targeting septin 2, in the bottom panels, show decreased intensity of anti-septin 2 staining. The cells show altered VE-cadherin organization, with junction staining patterns that are broad, wavy, and discontinuous compared with control. F-actin imaging in these cells shows increased staining in the interior of the cell with less staining at cell junctions. Scale bar = 50 µm. (C) Increased VE-cadherin expression.
FIGURE 9:
FIGURE 9:
Decreased endothelial monolayer integrity in response to septin 2 depletion and TNF-α treatment. Endothelial cells (HDMVECs) expressing shRNAs targeting septin 2 and treated with TNF-α. (A) Immunofluorescence staining of endogenous septin 2 and VE-cadherin, with fluorescent phalloidin staining for F-actin of endothelial cell monolayers. Scale bar = 5 µm. Control cells, expressing shControl RNA, are shown in the top set of three panels, while the middle and bottom sets of panels show cells expressing two different shRNAs targeting septin 2. Cells were treated with TNF-α in the bottom set of panels and not the top set. TNF-α-treated cells show less septin 2 at cell junctions, with alterations of VE-cadherin and F-actin at cell junctions. These effects are similar to those caused by decreased septin 2. (B) Decreases in TEER in cells treated with TNF-α and with shRNAs targeting septin 2. Within each of 11–14 independent experiments, TEER values were normalized to 1 for shRNA control cells not treated with TNF-α. Treatment with TNF-α and shSeptin 2 knockdown decreased TEER values to ∼70% of control. The combination of TNF-α with shSeptin 2 decreased the TEER values slightly further, to approximately 50–60% of control. The horizontal bar is the median of the values, and the error bars represent the 95% C.I. from the median. Statistical significance at a p < 0.0001 was found, by parametric t tests and nonparametric Mann–Whitney tests for all of the following pairwise comparisons: Untreated shControl vs. untreated shSeptin 2 #1 and #2; untreated shControl vs. treated shControl; and treated shControl vs. treated shSeptin2 #1 and #2. (C) Transendothelial migration by NK cells, scored as individual events from movies. Septin 2 shRNA expression led to increased levels of transendothelial migration compared with control. The results come from three independent experiments performed on different days, with each experiment as a different color: black, green, and blue. The absolute values differed among the three days, but the relative changes were similar. In each case, loss of septin 2 was associated with increased transendothelial migration.

References

    1. Abbott NJ, Rönnbäck L, Hansson E. (2006). Astrocyte-endothelial interactions at the blood-brain barrier. Nat Rev Neurosci , 41–53. - PubMed
    1. Abu Taha A, Taha M, Seebach J, Schnittler HJ. (2014). ARP2/3-mediated junction-associated lamellipodia control VE-cadherin-based cell junction dynamics and maintain monolayer integrity. Mol Biol Cell , 245–256. - PMC - PubMed
    1. Baldwin AL, Thurston G. (2001). Mechanics of endothelial cell architecture and vascular permeability. Crit Rev Biomed Eng , 247–278. - PubMed
    1. Bazzoni G, Dejana E. (2004). Endothelial cell-to-cell junctions: molecular organization and role in vascular homeostasis. Physiol Rev , 869–901. - PubMed
    1. Bertin A, McMurray MA, Pierson J, Thai L, McDonald KL, Zehr EA, García G, Peters P, Thorner J, Nogales E. (2012). Three-dimensional ultrastructure of the septin filament network in Saccharomyces cerevisiae . Mol Biol Cell , 423–432. - PMC - PubMed

Publication types

MeSH terms

LinkOut - more resources