Clinical Trial
. 2018 Aug 1;128(8):3298-3311.
doi: 10.1172/JCI97659. Epub 2018 Jun 25.

Enterotoxigenic Escherichia coli-blood group A interactions intensify diarrheal severity

Affiliations
Clinical Trial

Enterotoxigenic Escherichia coli-blood group A interactions intensify diarrheal severity

Pardeep Kumar et al. J Clin Invest. .

Erratum in

  • Enterotoxigenic Escherichia coli-blood group A interactions intensify diarrheal severity.
    Kumar P, Kuhlmann FM, Chakraborty S, Bourgeois AL, Foulke-Abel J, Tumala B, Vickers TJ, Sack DA, DeNearing B, Harro CD, Wright WS, Gildersleeve JC, Ciorba MA, Santhanam S, Porter CK, Gutierrez RL, Prouty MG, Riddle MS, Polino A, Sheikh A, Donowitz M, Fleckenstein JM. Kumar P, et al. J Clin Invest. 2019 Jul 1;129(7):2980. doi: 10.1172/JCI130874. Epub 2019 Jul 1. J Clin Invest. 2019. PMID: 31259744 Free PMC article. No abstract available.

Abstract

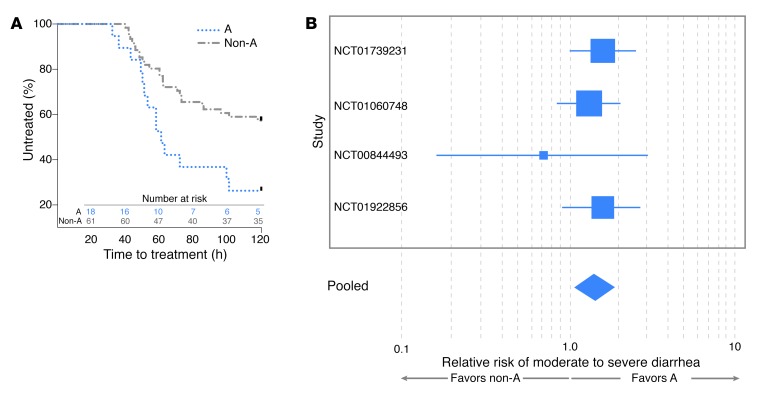
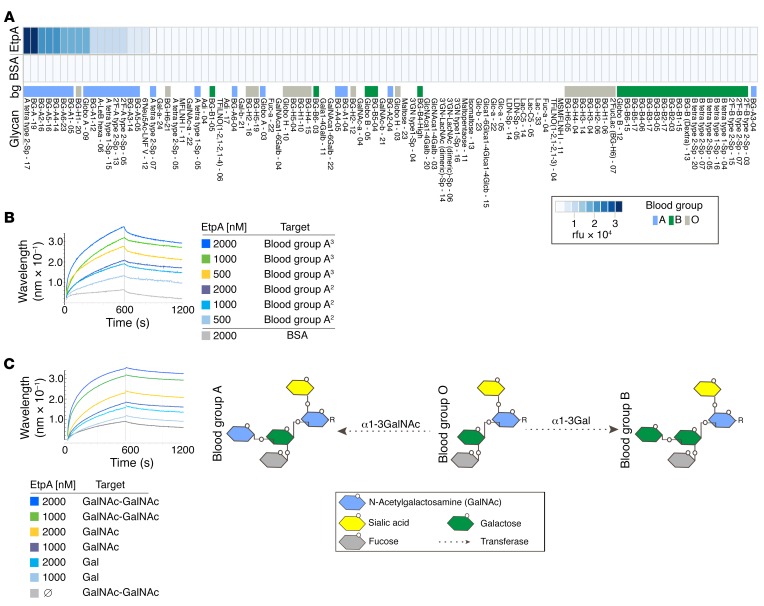
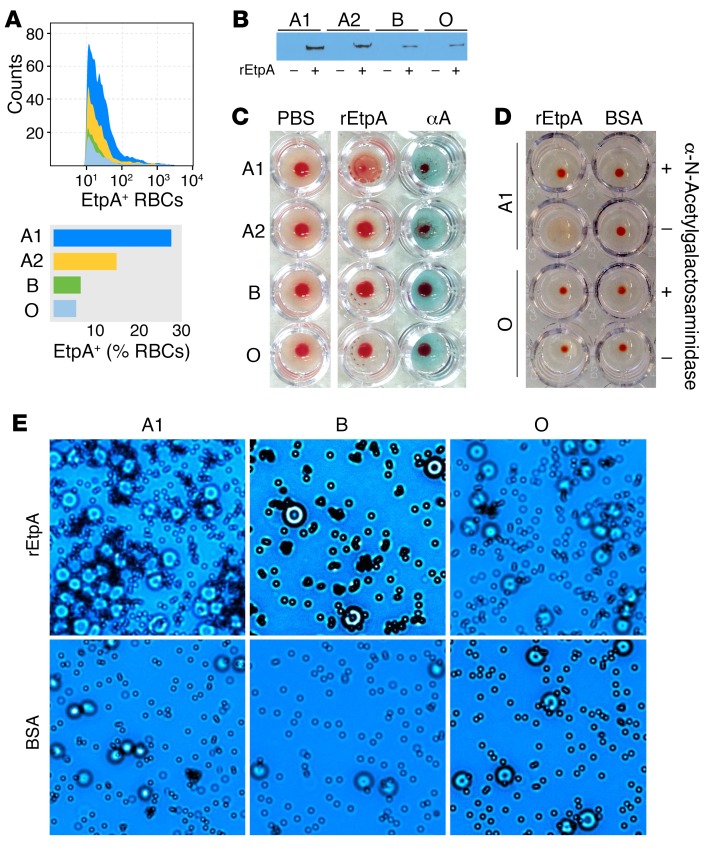
Enterotoxigenic Escherichia coli (ETEC) infections are highly prevalent in developing countries, where clinical presentations range from asymptomatic colonization to severe cholera-like illness. The molecular basis for these varied presentations, which may involve strain-specific virulence features as well as host factors, has not been elucidated. We demonstrate that, when challenged with ETEC strain H10407, originally isolated from a case of cholera-like illness, blood group A human volunteers developed severe diarrhea more frequently than individuals from other blood groups. Interestingly, a diverse population of ETEC strains, including H10407, secrete the EtpA adhesin molecule. As many bacterial adhesins also agglutinate red blood cells, we combined the use of glycan arrays, biolayer inferometry, and noncanonical amino acid labeling with hemagglutination studies to demonstrate that EtpA is a dominant ETEC blood group A-specific lectin/hemagglutinin. Importantly, we have also shown that EtpA interacts specifically with glycans expressed on intestinal epithelial cells from blood group A individuals and that EtpA-mediated bacterial-host interactions accelerate bacterial adhesion and effective delivery of both the heat-labile and heat-stable toxins of ETEC. Collectively, these data provide additional insight into the complex molecular basis of severe ETEC diarrheal illness that may inform rational design of vaccines to protect those at highest risk.

Keywords: Bacterial infections; Bacterial vaccines; Glycobiology; Infectious disease; Vaccines.


Conflict of interest statement

Conflict of interest: JMF is listed as the inventor on US patent 12/079,304, involving the EtpA adhesin.

Figures

Figure 1
Figure 1. Diarrheal severity is increased in blood group A–positive volunteers relative to those in the non-A blood groups.
(A) Development of severe diarrheal illness is accelerated in A blood group hosts. Kaplan-Meier curves indicate the proportion of subjects treated following the development of severe diarrheal illness in volunteers belonging to A and non-A blood groups. Time-to-treatment data were available for 79 of the 106 subjects (18 subjects in the A blood group and 61 subjects in the non-A group). Data were censored at 120 hours, when all remaining untreated individuals received antibiotics to clear their infection. P = 0.015, log-rank (Mantel-Cox) testing. (B) Individuals of A blood group are more likely to develop MSD. Shown are relative risk data from 4 independent controlled human infection model challenge studies of H10407 involving a total of 106 volunteers. Study numbers at left refer to ClinicalTrials.gov designations. Box size indicates relative study size, and lines represent 95% CIs for the relative risk of severe diarrhea. The width of the diamond indicates the 95% CIs for the pooled effect. The relative risk (pooled fixed effects) of MSD illness dichotomized by A (blood groups A and AB) vs. non-A (O and B) was 1.441 (95% CI, 1.097 to 1.893; P = 0.009). Cochran’s Q test of heterogeneity was insignificant (P = 0.667, Q = 1.5682, df = 3).
Figure 2
Figure 2. EtpA interacts preferentially with blood group A glycans.
(A) Glycan-array data (top row) demonstrating EtpA binding predominately to blood group A glycans. The top 100 of 411 glycans are ranked in order of diminishing binding activity from left to right. BSA (middle row) is shown as a control. Values represent background-corrected median data from 2 experimental replicates. Distribution of blood group (bg) binding is shown in the bottom row of the figure. Heatmap key (lower right) shows relative fluorescence units (rfu) and coding for blood group antigens. Names for glycans correspond to Supplemental Data Set 1. (B) EtpA binding to blood group A glycans assessed by Bio-Layer Interferometery (Pall ForteBio Corp.) assays. Data are representative of 3 independent experiments. Blood group A3 refers to the biotinylated trisaccharide-PAA conjugate GalNAcα1-3 (Fucα1,2)Galβ-PAA-biotin; blood group A2 refers to the disaccharide conjugate GalNAcα1-3Galβ-PAA-biotin. (C) EtpA binding to terminal GalNAc residues relative to Gal schematic (right) shows structures of blood groups A and B terminating in GalNAc and Gal sugars, respectively. Blood group O (core H) lacks either terminal sugar residue.
Figure 3
Figure 3. EtpA is a blood group A–specific hemagglutinin.
(A) Binding of rEtpA to the surface of group A1 and A2 RBC ghosts relative to B and O RBCs is shown in FACS data and a graph. (B) RBC pull-down of rEtpA with different blood group ghost erythrocytes. Shown in the immunoblot is rEtpA-myc-his identified by anti-myc antibodies. (C) EtpA agglutinates A1 RBCs, but exhibits minimal or no hemagglutination activity with RBCs from those with A2, B, or O blood groups. The column on the right includes anti–A blood group antibodies as a positive control. (D) EtpA-mediated hemagglutination is dependent on terminal GalNac residues. A1 RBCS pretreated with α-N-acetylgalactosaminidase (top row) fail to agglutinate in the presence of rEtpA. Shown (row 2, left) are positive controls (no enzyme pretreatment) and blood group O–negative controls (bottom rows). (E) EtpA-coated latex microspheres (top row) agglutinate RBCs from blood group A, but not B or O. Bottom row shows BSA-coated particles as controls. Each of the images are representative of 3 experimental replicates. Original magnification, ×40.
Figure 4
Figure 4. EtpA is a dominant blood group A–binding partner of ETEC H10407.
(A) Blood group A antigen far-Western blot with subcellular fractions of ETEC H10407 including supernatant (S), outer membrane (OM), and inner membrane (IM) demonstrates binding of biotinylated blood group A to high molecular weight protein in concentrated culture supernatant. (B) Coomassie-stained gel of supernatant proteins from H10407 (WT), etpA mutant jf1668, etpA mutant complemented with the etpBAC locus plasmid pJY019 (etpA(P+); etpA(P–)) equals mutant complemented with cloning vector alone. (C) EtpA immunoblot confirming the presence of EtpA in culture supernatants from H10407 and the complemented mutant. (D) Far-Western blot of culture supernatants shown in B and C shows binding of biotinylated blood group A only in the presence of EtpA. (E) EtpA is the dominant A blood group–specific interacting partner among ETEC proteins from ANL-labeled bacteria. Shown is a fluorescence image of ANL-labeled proteins from ETEC H10407 that interact with erythrocyte ghosts from A1, A2, B, and O blood groups (middle, RBCs/ANL). RBC ghosts alone are shown at left, and input protein (ANL) from H10407 and the etpA deletion mutant (jf1668) are shown at right. The migration of EtpA is indicated by the arrow, and TAMRA-labeled rEtpA is shown at far right as a positive control. Each image is representative of 3 experimental replicates.
Figure 5
Figure 5. A blood group–dependent interactions of EtpA and ETEC with intestinal epithelia.
(A) EtpA binds to regions of blood group A expression on the surface of HT-29 epithelial cells. Shown in columns from left to right are blood group A (green, antibodies against blood group A and fluorescent conjugate αbgA/AF488); nuclei (blue, DAPI); biotinylated EtpA (red, SA-coated Qdots594); and merged images. Middle row: no EtpA control. Bottom row: no EtpA binding to the surface of HT29A–/– cells engineered to remove the α1→3 GalNac glycosyltransferase required for A antigen expression. Original magnification, ×100. (B) EtpA preferentially engages cells expressing A blood group. Key: upper left indicates the target (bait) cell lines used to attract ANL-labeled bacterial (prey) proteins from H10407 (WT) or the etpA mutant. Labeled rEtpA and the arrow at left are shown to indicate the predicted migration of EtpA. Lanes at far right show input proteins from the EtpA-expressing H10407 WT and the etpA mutant. (C) Localization of EtpA-expressing ETEC to areas of blood group A expression on the surface of HT-29 cells. Original magnification, ×63. Images in AC represent 1 of 3 experimental replicates. (D) EtpA and blood group A are required for optimal adhesion. Data are representative of 4 independent experiments. HT-29A–/– data include results from 2 independently generated engineered blood group A glycosyl transferase mutant lines (1e6, circular symbols; and 1g10, square symbols; n = 8 technical replicates in total). *P = 0.03, ANOVA, Kruskal-Wallis. (E) Blood group A accelerates adhesion of ETEC to target intestinal epithelial cells (n = 8 technical replicates for HT-29 cells and n = 6 technical replicates for HT-29–/– cells; representative of 2 independent experiments); symbols represent mean ± SEM. **P = 0.003; ***P = 0.0003, Mann-Whitney U test, 2-tailed comparison. (F) Presence of A blood group and EtpA are required for optimal delivery of heat-labile toxin by ETEC (n = 5 technical replicates representative of 3 independent experiments). **P < 0.01, ANOVA, Kruskal-Wallis.
Figure 6
Figure 6. EtpA and EtpA-expressing ETEC interact preferentially with the surface of blood group A enteroids.
(A) Confocal imaging of EtpA binding to surface of polarized small intestinal enteroid monolayers from a blood group A subject. Differential interference contrast (DIC) image at bottom shows architecture of polarized enteroids on Transwell filter. Original magnification, ×63. (B) Kinetic ELISA quantification of biotinylated EtpA binding to surface of small intestinal enteroid cells from blood groups A, B, and O (n = 4 technical replicates representative of 3 separate experiments). *P < 0.05; **P < 0.01, ANOVA, Kruskal-Wallis. (C) Association of EtpA-expressing ETEC H10407 with A blood group on surface of small intestinal cells. Images represent volocity-processed confocal laser-scanning microscopy (CLSM) data of ETEC H10407 (red) to blood group A (green) and nuclei (blue). Lower panel shows polarized orientation of cells with bacteria adherent to the apical surfaces of enterocytes. Original magnification, ×63. (D) Top panel: CLSM of ETEC (green) and A blood group (red) on jejunal enteroids. Bottom panel: A blood group “footprints” (arrows) at sites of bacterial attachment. Data shown in C and D are representative of 3 experimental replicates. Original magnification, ×60. (E) Bacterial density on surface of small intestinal enteroids determined by CLSM quantification of H10407 (serotype O78). Quantitation based on imaging 10 fields per blood group, at ×20 magnification. *P = 0.039; #P < 0.0001, ANOVA, Kruskal-Wallis. (F) Adhesion of WT H10407 and etpA mutant bacteria to blood group A small intestinal enteroids (n = 5 technical replicates; representative of 3 biological replicates). Bars represent geometric mean values. (G) Production of cAMP by blood group A target enteroids following infection by WT (H10407) or the etpA mutant. Data represent total of 5 technical replicates from 2 separate experiments. (H) Production of cGMP by blood group A small intestinal enteroids following infection with WT (n = 6) or the etpA mutant (n = 4). Data are representative of 3 independent biological replicates. Inset graph indicates relative (mean ± SD, n = 6 technical replicates) production of heat stable toxin (ST) by the WT (blue bars) vs. the mutant (gray bars). **P < 0.01, Mann-Whitney U test, 2 tailed nonparametric testing.

References

    1. Kotloff KL, et al. Burden and aetiology of diarrhoeal disease in infants and young children in developing countries (the Global Enteric Multicenter Study, GEMS): a prospective, case-control study. Lancet. 2013;382(9888):209–222. doi: 10.1016/S0140-6736(13)60844-2. - DOI - PubMed
    1. Liu J, et al. Use of quantitative molecular diagnostic methods to identify causes of diarrhoea in children: a reanalysis of the GEMS case-control study. Lancet. 2016;388(10051):1291–1301. doi: 10.1016/S0140-6736(16)31529-X. - DOI - PMC - PubMed
    1. Qadri F, Saha A, Ahmed T, Al Tarique A, Begum YA, Svennerholm AM. Disease burden due to enterotoxigenic Escherichia coli in the first 2 years of life in an urban community in Bangladesh. Infect Immun. 2007;75(8):3961–3968. doi: 10.1128/IAI.00459-07. - DOI - PMC - PubMed
    1. Roels TH, Proctor ME, Robinson LC, Hulbert K, Bopp CA, Davis JP. Clinical features of infections due to Escherichia coli producing heat-stable toxin during an outbreak in Wisconsin: a rarely suspected cause of diarrhea in the United States. Clin Infect Dis. 1998;26(4):898–902. doi: 10.1086/513923. - DOI - PubMed
    1. Beatty ME, et al. Epidemic diarrhea due to enterotoxigenic Escherichia coli. Clin Infect Dis. 2006;42(3):329–334. doi: 10.1086/499246. - DOI - PubMed

Publication types

MeSH terms

Substances