Comparative Study
. 2018 May 17;10(5):268.
doi: 10.3390/v10050268.

Paradoxical Effect of Chloroquine Treatment in Enhancing Chikungunya Virus Infection

Affiliations
Comparative Study

Paradoxical Effect of Chloroquine Treatment in Enhancing Chikungunya Virus Infection

Pierre Roques et al. Viruses. .

Abstract

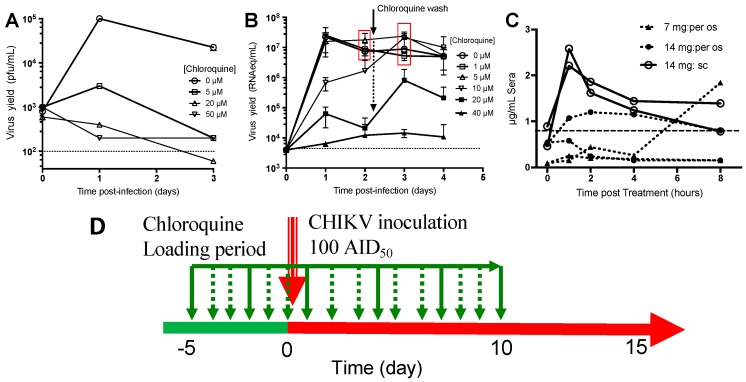
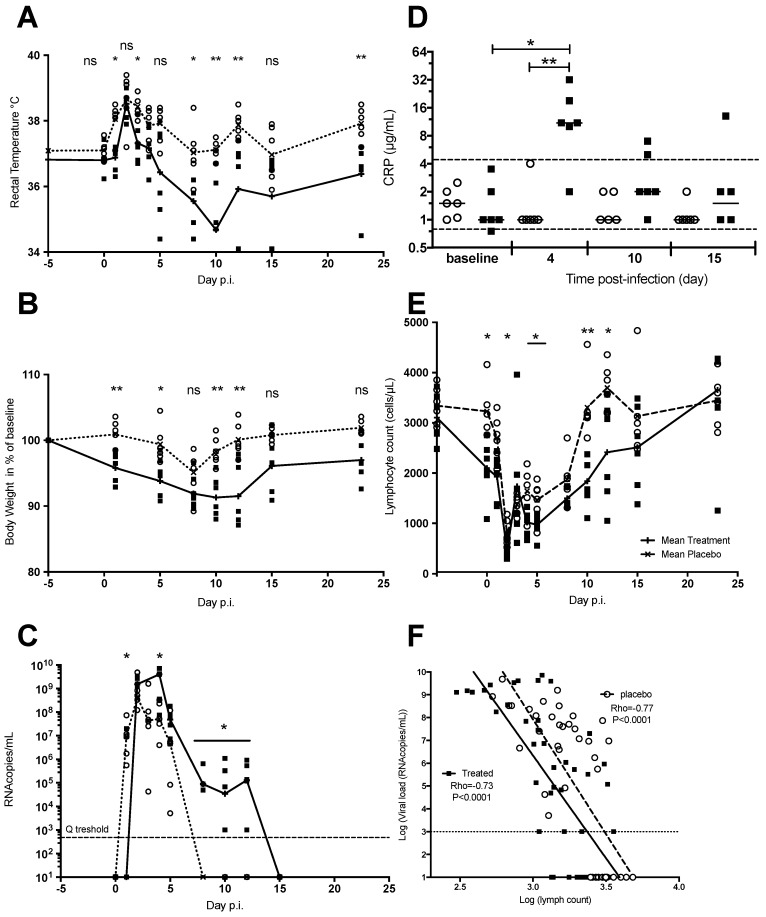
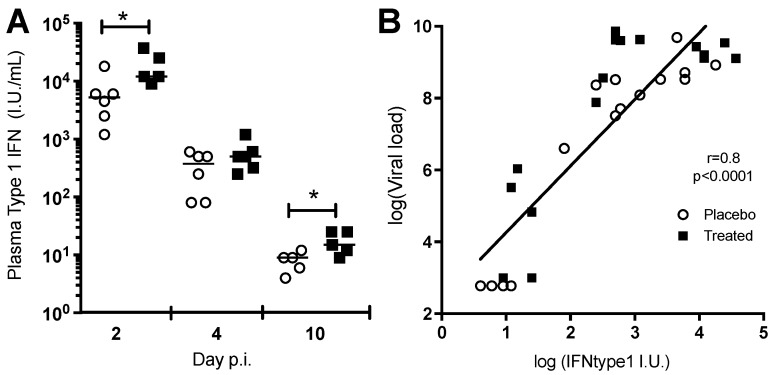
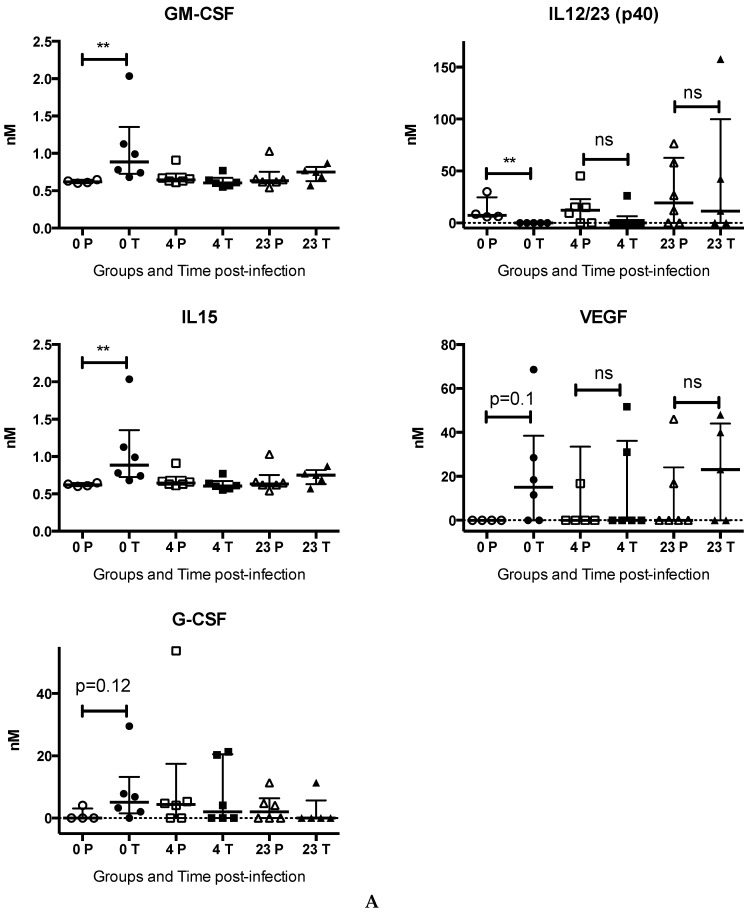
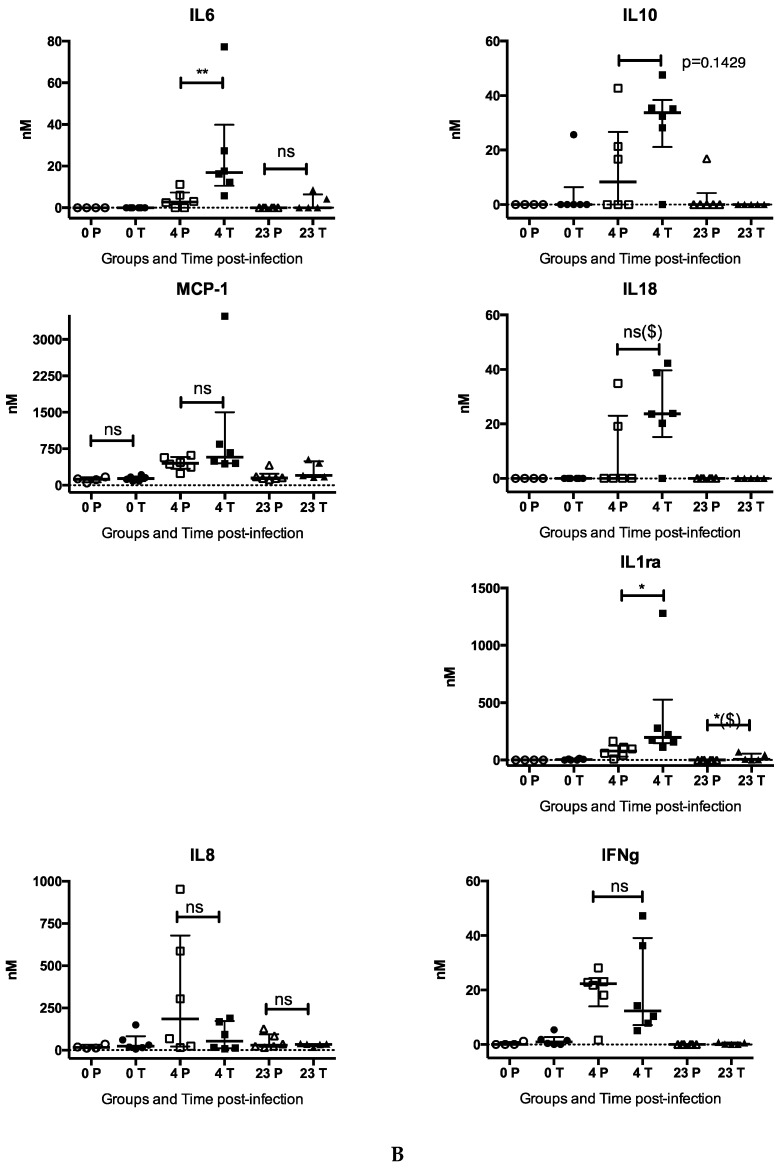
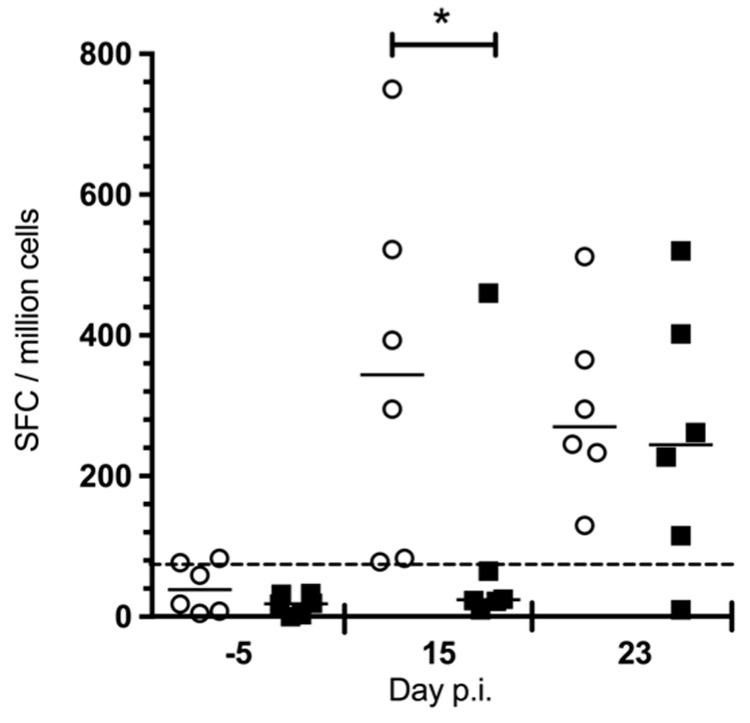
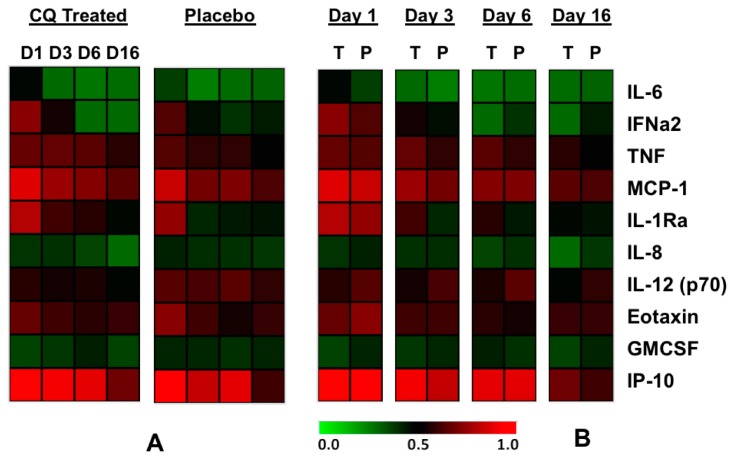
Since 2005, Chikungunya virus (CHIKV) re-emerged and caused numerous outbreaks in the world, and finally, was introduced into the Americas in 2013. The lack of CHIKV-specific therapies has led to the use of non-specific drugs. Chloroquine, which is commonly used to treat febrile illnesses in the tropics, has been shown to inhibit CHIKV replication in vitro. To assess the in vivo effect of chloroquine, two complementary studies were performed: (i) a prophylactic study in a non-human primate model (NHP); and (ii) a curative study "CuraChik", which was performed during the Reunion Island outbreak in 2006 in a human cohort. Clinical, biological, and immunological data were compared between treated and placebo groups. Acute CHIKV infection was exacerbated in NHPs treated with prophylactic administration of chloroquine. These NHPs displayed a higher viremia and slower viral clearance (p < 0.003). Magnitude of viremia was correlated to the type I IFN response (Rho = 0.8, p < 0.001) and severe lymphopenia (Rho = 0.8, p < 0.0001), while treatment led to a delay in both CHIKV-specific cellular and IgM responses (p < 0.02 and p = 0.04, respectively). In humans, chloroquine treatment did not affect viremia or clinical parameters during the acute stage of the disease (D1 to D14), but affected the levels of C-reactive Protein (CRP), IFNα, IL-6, and MCP1 over time (D1 to D16). Importantly, no positive effect could be detected on prevalence of persistent arthralgia at Day 300. Although inhibitory in vitro, chloroquine as a prophylactic treatment in NHPs enhances CHIKV replication and delays cellular and humoral response. In patients, curative chloroquine treatment during the acute phase decreases the levels of key cytokines, and thus may delay adaptive immune responses, as observed in NHPs, without any suppressive effect on peripheral viral load.

Keywords: alphavirus; chikungunya; chloroquine; macaque; monocyte-macrophage.


Conflict of interest statement

The authors declare no conflict of interest. The founding sponsors had no role in the design of the study; in the collection, analyses, or interpretation of data; in the writing of the manuscript, and in the decision to publish the results.

Figures

Figure 1
Figure 1
Chloroquine inhibition of Chikungunya virus (CHIKV) replication in cynomolgus macaque cells in vitro and pharmacokinetics in vivo. (A) Antiviral activity of chloroquine against the CHIKV infection of macaque primary monocyte-derived macrophages (MDM, quadruplicate; 4–5 × 10⁵ MDM per well) were treated for 24 h with various concentrations of chloroquine, infected with a MOI of 3.4. CHIKV levels in the supernatant were quantified by titration on the BHK-21 sensitive cell line, as previously described; (B) Primary Fibroblast cells derived from macaque tendon (quadruplicate; 4 × 10⁵ per well) were treated for 24 h with various concentrations of chloroquine, infected with a multiplicity of infection (MOI) of 1. CHIKV levels in supernatant were quantified by direct RT-PCR in 30µL of the culture supernatant. At day 2 post-infection, all cells pre-treated with less than 10 µM of Chloroquine and exposed to the virus are dying (red square). The remaining chloroquine was washed out at day 2 and a virus rebound is assessed in the 10 and 20 µM chloroquine treated cells that were killed day 3. Cells that were treated with 40 µM chloroquine were protected from infection but abnormal structures and shape were seen (Supplementary Figure S1b). The data shown either in panel A or B are representative of two experiments, dashed lines are lower limit of quantification; (C) Two macaques per regimen were treated for five days with chloroquine. On day 5, blood was taken just before the 6th treatment (time 0), for Cmin determination, or at 1, 2, 4, or 8 h after chloroquine administration. Dashed horizontal line is for Cmin obtained in Human and in macaque after five days of treatment with 14 µg/kg/days of chloroquine. Serum chloroquine concentration was determined as described in the Methods section; (D) Scheme of the treatment procedure used during in vivo assay. Chloroquine administration was shown in dotted or solid green arrow, CHIKV inoculation in red arrow and period of infection in animal on red horizontal line.
Figure 2
Figure 2
Exacerbation of acute chikungunya in macaques that were treated with chloroquine. Macaques randomly assigned to the placebo (n = 6, open circles, median shown as a dotted line) or chloroquine (n = 6, closed squares, median shown as a solid line) groups were treated for five days before infection with CHIKV. Treatment was then continued for 10 days. (A) Fever and hypothermia, as determined by measurements of rectal temperature; (B) Body weight loss in treated animals (percentage of baseline); (C) Plasma viral load, as measured by RT-qPCR; (D) CRP determination in plasma (* p < 0.05 Wilcoxon rank test). Global analysis by Kruskal-Wallis test, p = 0.0144 for the chloroquine group, not significant for the placebo group. The two dotted lines indicate the normal range of plasma CRP levels that were obtained from 15 healthy macaques; (E) Lymphopenia, as assessed by lymphocyte count kinetics; (F) Absolute lymphocyte counts are correlated with plasma viral load during acute chikungunya (Spearman’s rank correlation test). Mann & Whitney test when comparing placebo and treated animals; ns: not significant. * p < 0.05; ** p < 0.01. Wilcoxon rank test p values, for comparing the data at a given time point with baseline values (before treatment), are given in the text. Dotted horizontal line in C and F are the lower limit of quantitation by Q-RT-PCR.
Figure 3
Figure 3
The type 1 interferon response and plasma viral load during acute chikungunya. (A) Type 1 interferon concentration was higher in the chloroquine group (black squares) than in the placebo group (open circles) on day 2 pi (viral load peak) and day 10 pi (during clearance). * p < 0.05, Mann & Whitney test; (B) Type 1 interferon concentration is correlated with plasma viral load during acute chikungunya (Spearman’s rank test, rho = 0.8, p < 0.0001).
Figure 4
Figure 4
Evaluation of plasma inflammatory mediators in chloroquine treated (T, black symbols) versus non-treated (Placebo, P, open symbols) animals before infection (0P, 0T), and at 4, 23 days post-infection. Macaques were treated with chloroquine five days, and then were inoculated with 100 AID50 of CHIKV (day 0). Plasma grow-factor, cytokines and chemokines induced by the CHIKV infection were assayed using Luminex assays at day 0 before infection, four days post infection, and at day 23 post-infection thus 13 days after resolution of chloroquine treatment (see material and methods). (A) Chloroquine treatment induced variation in the expressed cytokines and chemokines: GM-CSF, IL-15, G-CSF, IL-12/23 (p40), and VEGF. Kruskal-Wallis then M&W test, ** p < 0.01, ns: not significant; (B) Cytokines significantly increased after infection (all p < 0.001: IL-6, MCP-1, IL-8, IL-10, IL-18, IL-1RA, IFNγ; in chloroquine treated (dark symbols) versus non-treated (open symbols) animals. Comparison between groups: Kruskal-Wallis then M&W test, ** p < 0.01, * p < 0.05; $ p < 0.07, ns: not significant.
Figure 4
Figure 4
Evaluation of plasma inflammatory mediators in chloroquine treated (T, black symbols) versus non-treated (Placebo, P, open symbols) animals before infection (0P, 0T), and at 4, 23 days post-infection. Macaques were treated with chloroquine five days, and then were inoculated with 100 AID50 of CHIKV (day 0). Plasma grow-factor, cytokines and chemokines induced by the CHIKV infection were assayed using Luminex assays at day 0 before infection, four days post infection, and at day 23 post-infection thus 13 days after resolution of chloroquine treatment (see material and methods). (A) Chloroquine treatment induced variation in the expressed cytokines and chemokines: GM-CSF, IL-15, G-CSF, IL-12/23 (p40), and VEGF. Kruskal-Wallis then M&W test, ** p < 0.01, ns: not significant; (B) Cytokines significantly increased after infection (all p < 0.001: IL-6, MCP-1, IL-8, IL-10, IL-18, IL-1RA, IFNγ; in chloroquine treated (dark symbols) versus non-treated (open symbols) animals. Comparison between groups: Kruskal-Wallis then M&W test, ** p < 0.01, * p < 0.05; $ p < 0.07, ns: not significant.
Figure 5
Figure 5
CHIKV-specific cell-mediated immunity is delayed by chloroquine treatment. The cell-mediated anti-CHIKV immune response was assessed by IFN-γ ELISPOT assays on leukocytes that were stimulated with CHIKV antigen in vitro, before treatment and infection (−5 p.i.), and on days 15 and 23 p.i. Chloroquine treated (black squares) versus non-treated (open circles). * p < 0.05, M&W test.
Figure 6
Figure 6
Heatmap of cytokines measured in each group. (A) General Comparison of chloroquine (CQ) treated vs Placebo treated groups (B) Comparing chloroquine treated (T) vs. Placebo treated (P) groups at each specific day. Heatplots are shown (top down) from the lower quantities (green) to higher quantities (red).

References

    1. Mason P.J., Haddow A.J. An epidemic of virus disease in Southern Province, Tanganyika Territory, in 1952–53: An additional note on Chikungunya virus isolations and serum antibodies. Trans. R. Soc. Trop. Med. Hyg. 1957;51:238–240. doi: 10.1016/0035-9203(57)90022-6. - DOI - PubMed
    1. Dupuis-Maguiraga L., Noret M., Brun S., Le Grand R., Gras G., Roques P. Chikungunya disease: Infection-associated markers from the acute to the chronic phase of arbovirus-induced arthralgia. PLoS Negl. Trop. Dis. 2012;6 doi: 10.1371/journal.pntd.0001446. - DOI - PMC - PubMed
    1. Ahola T., Courderc T., Ng L.F., Hallengärd D., Powers A., Lecuit M., Esteban M., Merits A., Roques P., Liljeström P. Therapeutics and vaccines against chikungunya virus. Vector Borne Zoonotic Dis. 2015;15:250–257. doi: 10.1089/vbz.2014.1681. - DOI - PubMed
    1. Bettadapura J., Herrero L.J., Taylor A., Mahalingam S. Approaches to the treatment of disease induced by chikungunya virus. Indian J. Med. Res. 2013;138:762–765. - PMC - PubMed
    1. Weaver S.C., Lecuit M. Chikungunya virus and the global spread of a mosquito-borne disease. N. Engl. J. Med. 2015;372:1231–1239. doi: 10.1056/NEJMra1406035. - DOI - PubMed

Publication types

MeSH terms