Review
. 2018 May 17;11(5):831.
doi: 10.3390/ma11050831.

Fe-Based Nano-Materials in Catalysis

Affiliations
Review

Fe-Based Nano-Materials in Catalysis

Stavros Alexandros Theofanidis et al. Materials (Basel). .

Abstract

The role of iron in view of its further utilization in chemical processes is presented, based on current knowledge of its properties. The addition of iron to a catalyst provides redox functionality, enhancing its resistance to carbon deposition. FeOx species can be formed in the presence of an oxidizing agent, such as CO₂, H₂O or O₂, during reaction, which can further react via a redox mechanism with the carbon deposits. This can be exploited in the synthesis of active and stable catalysts for several processes, such as syngas and chemicals production, catalytic oxidation in exhaust converters, etc. Iron is considered an important promoter or co-catalyst, due to its high availability and low toxicity that can enhance the overall catalytic performance. However, its operation is more subtle and diverse than first sight reveals. Hence, iron and its oxides start to become a hot topic for more scientists and their findings are most promising. The scope of this article is to provide a review on iron/iron-oxide containing catalytic systems, including experimental and theoretical evidence, highlighting their properties mainly in view of syngas production, chemical looping, methane decomposition for carbon nanotubes production and propane dehydrogenation, over the last decade. The main focus goes to Fe-containing nano-alloys and specifically to the Fe⁻Ni nano-alloy, which is a very versatile material.

Keywords: CO2 utilization; carbon; chemical looping; dehydrogenation; hydrocarbon conversion; nano-alloys; role of iron.


Conflict of interest statement

The authors declare no conflicts of interest.

Figures

Figure 1
Figure 1
Use of iron/iron oxides throughout mankind [6,7,8].
Figure 2
Figure 2
Schematic illustration of mixed CeO2–Fe2O3 samples, based upon ICP composition, XRD patterns, STEM, EDX, and EELS. Obtained from [65].
Figure 3
Figure 3
Oxygen storage capacity of MgFexAl2−xO4 materials as a function of the Fe2O3 content. Note that when Fe2O3 loading is less than 30 wt %, it is completely incorporated into the spinel structure without separate Fe2O3 phases. formula image
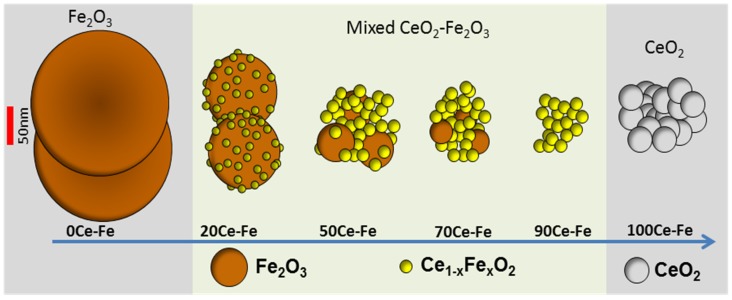
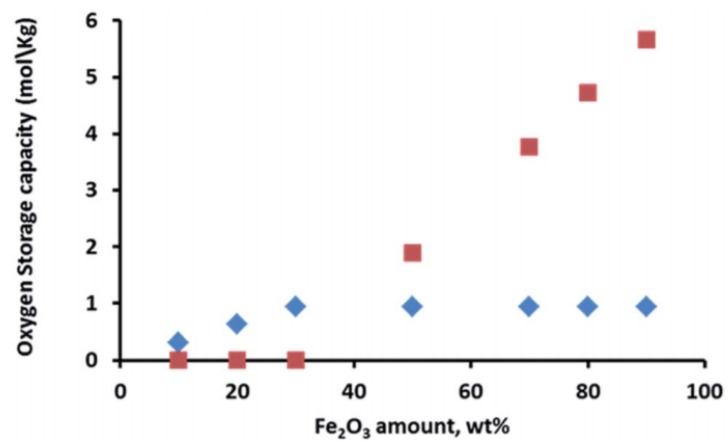
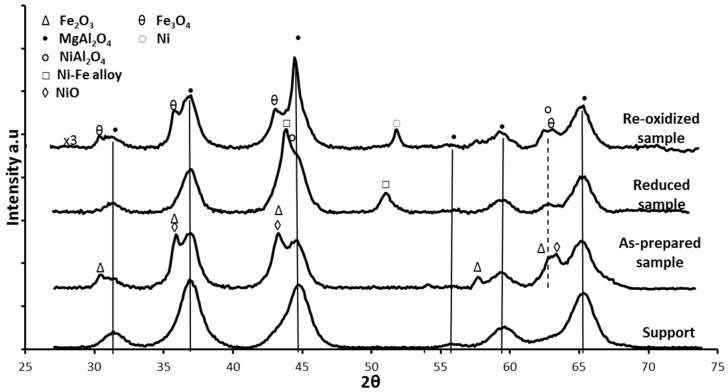
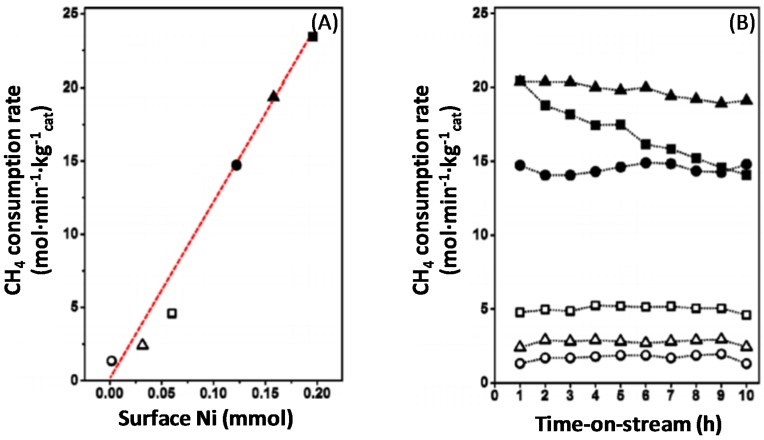
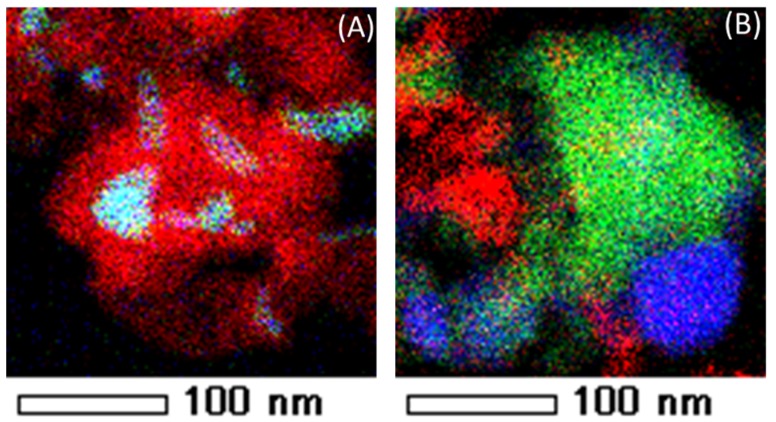
: iron incorporated in spinel structure; formula image: separate Fe2O3 phase. Obtained from [81].
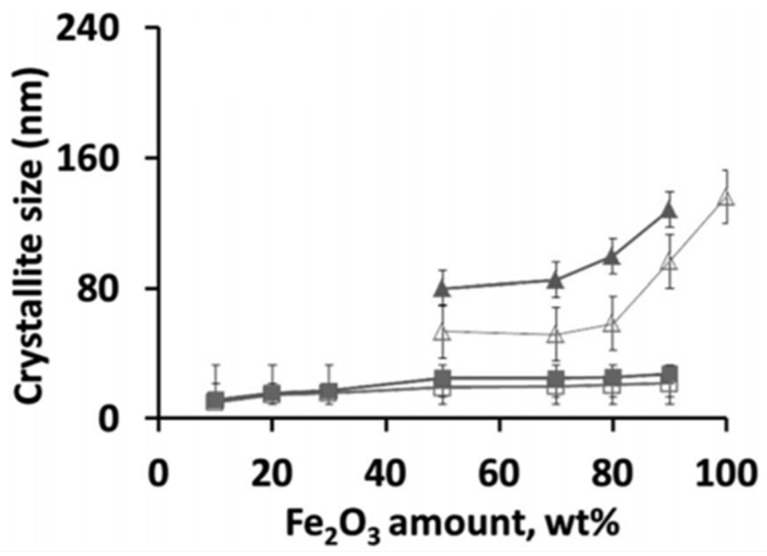
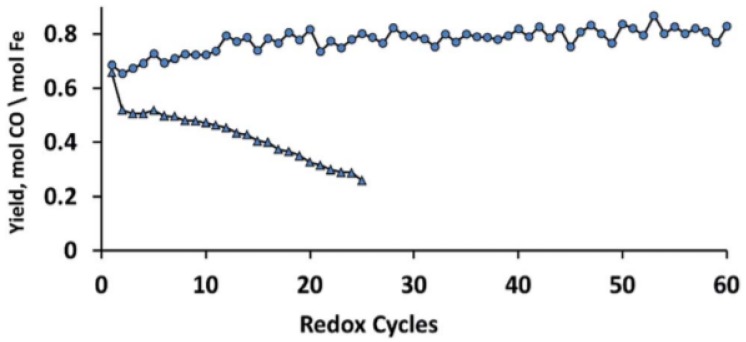
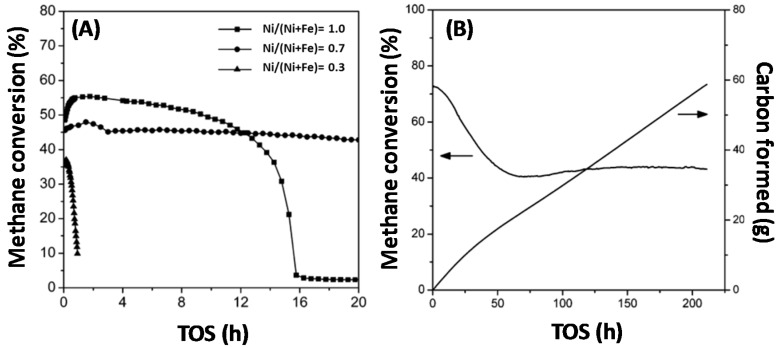
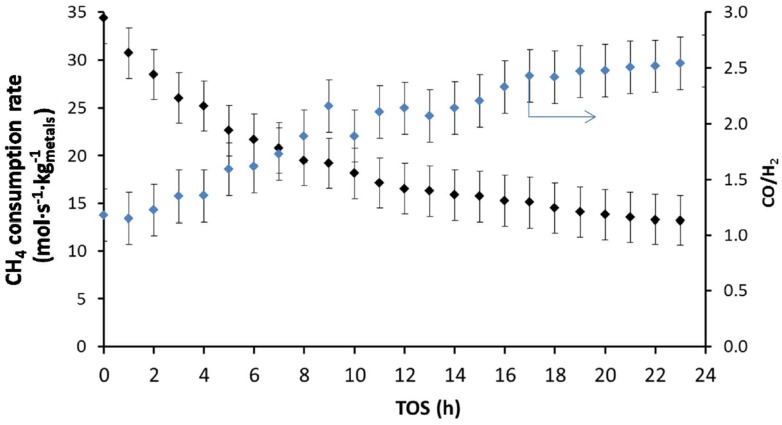
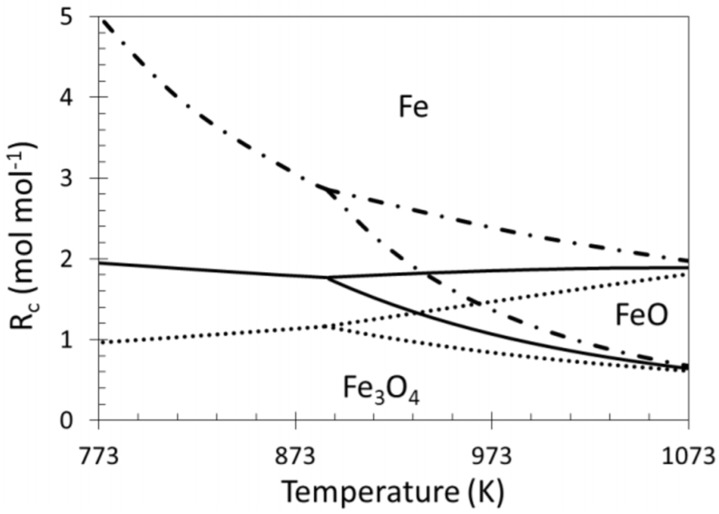
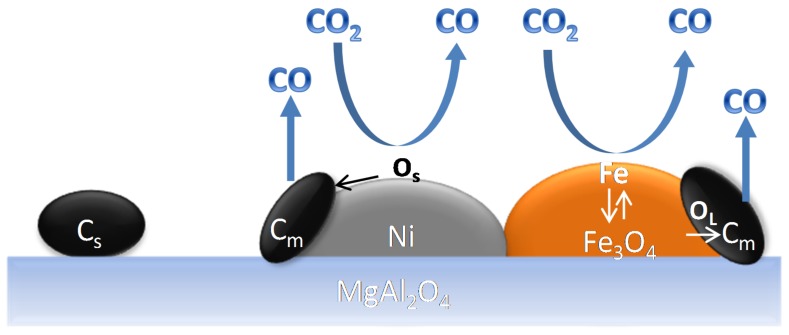
Figure 4
Figure 4
Crystallite size of Fe2O3 and MgFexAl2−xO4 phases in the samples, as calculated based on XRD using the Scherrer equation. As-prepared: (□) MgFexAl2−xO4 and (Δ) Fe2O3; (■) MgFexAl2−xO4 and (▲) Fe3O4 after 5 isothermal redox cycles of H2/CO2 at 1023 K. Obtained from [81].
Figure 5
Figure 5
CO yield in CO2 to CO conversion as a function of isothermal H2-CO2 redox cycles for MgFexAl2−xO4 and Fe2O3/MgFexAl2−xO4 with (●) 10 wt % Fe2O3 (MgFe0.14Al1.86O4) and (▲) 90 wt % Fe2O3. Each cycle (16 min) is composed of 4 min H2 (5% in Ar), 4 min He, 4 min CO2 (100%) and 4 min He at 1123 K. All the gas flows were 1.1 NmL/s. Obtained from [81].
Figure 6
Figure 6
Schematic representation of the shrinking core model in a MgFexAl2−xO4 crystallite. Top right inset: Observed and calculated conversion profile of Fe3+ based on pre-edge fitting of QXANES spectra from MgFe0.14Al1.86O4. Obtained from [85].
Figure 7
Figure 7
Conversion and product distribution of the RuxFe/TiO2 catalysts, during anisole hydrodeoxygenation (HDO), in a stainless-steel batch reactor. Reaction conditions: 10 wt % anisole (40 mL), catalyst (1.0 g), 200 °C and 10 bar H2 for 3 h. Obtained from [94].
Figure 8
Figure 8
Phase diagram of the bimetallic Fe–Ni system. Obtained from [99].
Figure 9
Figure 9
Full XRD scans of MgAl2O4, as-prepared, reduced and re-oxidized 8 wt %Ni-5 wt %Fe/MgAl2O4 (1 mL/s of 10%H2/He mixture or CO2 at a total pressure of 101.3 kPa and 1123 K). The NiFe2O4 phase cannot be distinguished due to overlapping with Fe2O3. Reproduced from [17].
Figure 10
Figure 10
EDX element mapping of 8 wt %Ni-5 wt %Fe/MgAl2O4. (A) After H2-reduction (1 mL/s of 5%H2/Ar mixture at a total pressure of 101.3 kPa and 1123 K). (B) After CO2 oxidation (1 mL/s of CO2 at a total pressure of 101.3 kPa and 1123 K). Red and green colors correspond to Fe and Ni elements respectively. Obtained from [17].
Figure 11
Figure 11
Schematic diagram of Fe–Ni nano-alloy formation and decomposition, depending on the applied environment. Obtained from [17].
Figure 12
Figure 12
(A) Methane conversion over Fe–Ni catalysts with Ni/(Ni + Fe) ratio of 1.0, 0.7 and 0.3 as a function of TOS at 873 K. (B) Long term test of a Fe–Ni catalyst with Ni/(Ni + Fe) ratio of 0.7 during methane decomposition at 923 K. Reproduced from [110].
Figure 13
Figure 13
SEM image of carbon nanotubes produced over a Fe–Ni catalyst with Ni/(Ni + Fe) of 0.7 after 210 h TOS under methane decomposition at 923 K. Obtained from [110].
Figure 14
Figure 14
(A) Rate of methane consumption (mol·min−1·kg−1cat) as a function of the amount of surface Ni (mmol), during methane dry reforming. ■: Pure Ni; ▲: Ni/(Ni + Fe) = 0.80; ●: Ni/(Ni + Fe) = 0.75; □: Ni/(Ni + Fe) = 0.5; ∆: Ni/(Ni + Fe) = 0.25 and ○: Pure Fe, all supported on MgxAlyOz and (B) rate of methane consumption (mol·min−1·kg−1cat) as a function of time-on-stream (TOS) during DRM at 923 K. Reproduced from [101].
Figure 15
Figure 15
Deposited carbon as a function of Ni/(Ni + Fe) ratio along with the SEM micrographs of “spent” catalysts supported on MgAl2O4. Temperature 1023 K, CH4:CO2 = 1:1, reaction time 4 h. Reproduced from [17].
Figure 16
Figure 16
CH4 consumption rate (molCH4·s−1·kg−1metals) and the produced CO/H2 ratio over a bimetallic Fe–Ni catalyst with Ni/(Ni + Fe) = 0.65 during DRM at 1023 K (total pressure of 101.3 kPa and CH4:CO2 = 1:1). Wmetals/F0CH4 = 0.025 molCH4·s−1·kg−1metals, XCH4: from 62% to 24%. Reproduced from [116].
Figure 17
Figure 17
Phase diagram showing the equilibrium lines between Fe3O4, FeO and Fe as a function of temperature and reduction capacity in presence of: formula image H2/H2O; formula image H2/CO/H2O/CO2 (equimolar amount of C and H2 corresponding with a feed of CH4 + CO2); formula image CO/CO2. Obtained from [49].
Figure 18
Figure 18
Deactivation due to Fe segregation from the Fe–Ni surface alloy during DRM at high temperature (1023 K). Obtained from [116].
Figure 19
Figure 19
Raman spectrum of the spent Fe–Ni catalyst, with Ni/(Ni + Fe) ratio of 0.6 (DRM for 1 h, 1023 K, CH4:CO2 = 1.1, total pressure of 101.3 kPa). Blue line: pure graphite as a reference, black line: spent Fe–Ni catalyst, grey line: spent Fe–Ni catalyst after CO2-TPO up to 950 K, purple line: Spent Fe–Ni catalyst after CO2-TPO up to 1123 K. Obtained from [118].
Figure 20
Figure 20
(A) HRTEM image of a spent Fe–Ni catalyst with Ni/(Ni + Fe) ratio of 0.6 (after DRM at 1023 K, CH4:CO2:He = 1.1:1:1, total pressure of 101.3 kPa, reaction time 1 h). EDX element mapping of (B) carbon, (C) Ni and (D) Fe. Obtained from [118].
Figure 21
Figure 21
EDX element mapping of Fe–Ni. (A) After DRM (1023 K, CH4/CO2/He = 1.1/1/1, total pressure of 101.3 kPa, reaction time 1 h). (B) After CO2 oxidation (1 mL/s of CO2 at a total pressure of 101.3 kPa and 1123 K). Red, green and blue colors correspond to carbon, Fe and Ni elements respectively. Obtained from [118].
Figure 22
Figure 22
Schematic representation of carbon species removal by CO2 over Fe–Ni catalyst. Cs: deposited carbon. Os: surface oxygen, OL: lattice oxygen. Cm: carbon deposited on metals, Cs: Carbon deposited far from metals, Os: surface oxygen, OL: lattice oxygen. The carbon illustration is not corresponding to the real carbon structure. Obtained from [118].
Figure 23
Figure 23
2D in situ XRD pattern during H2-TPR for Fe–Ni–Pd. Heating rate: 30 K/min, maximum temperature 1123 K, flow rate: 1 NmL/s, 10%H2/He. Obtained from [116].
Figure 24
Figure 24
EDX element mapping of a Fe–Ni–Pd catalyst supported on MgAl2O4. (A) as-prepared (B) reduced (1 NmL/s of 5%H2/He mixture at a total pressure of 101.3 kPa and 1123 K). Red, green and blue colors correspond to Fe, Ni and Pd elements, respectively. Obtained from [116].

References

    1. Parkinson G.S. Iron oxide surfaces. Surf. Sci. Rep. 2016;71:272–365. doi: 10.1016/j.surfrep.2016.02.001. - DOI
    1. Bragg W.H. The structure of magnetite and the spinels. Nature. 1915;95:561. doi: 10.1038/095561a0. - DOI
    1. Coltrain B.K., Herron N., Busch D.H. Oxygen Activation by Transition Metal Complexes of Macrobicyclic Cyclidene Ligands. In: Barton D.H.R., Martell A.E., Sawyer D.T., editors. The Activation of Dioxygen and Homogeneous Catalytic Oxidation. Springer; Boston, MA, USA: 1993. pp. 359–380.
    1. Dlouhy A.C., Outten C.E. The Iron Metallome in Eukaryotic Organisms. Met. Ions Life Sci. 2013;12:241–278. - PMC - PubMed
    1. Yan L., Zhang S., Chen P., Liu H., Yin H., Li H. Magnetotactic bacteria, magnetosomes and their application. Microbiol. Res. 2012;167:507–519. doi: 10.1016/j.micres.2012.04.002. - DOI - PubMed

LinkOut - more resources