. 2018 Jul 27;293(30):11687-11708.
doi: 10.1074/jbc.M117.815829. Epub 2018 May 17.

PTAP motif duplication in the p6 Gag protein confers a replication advantage on HIV-1 subtype C

Affiliations

PTAP motif duplication in the p6 Gag protein confers a replication advantage on HIV-1 subtype C

Shilpee Sharma et al. J Biol Chem. .

Abstract

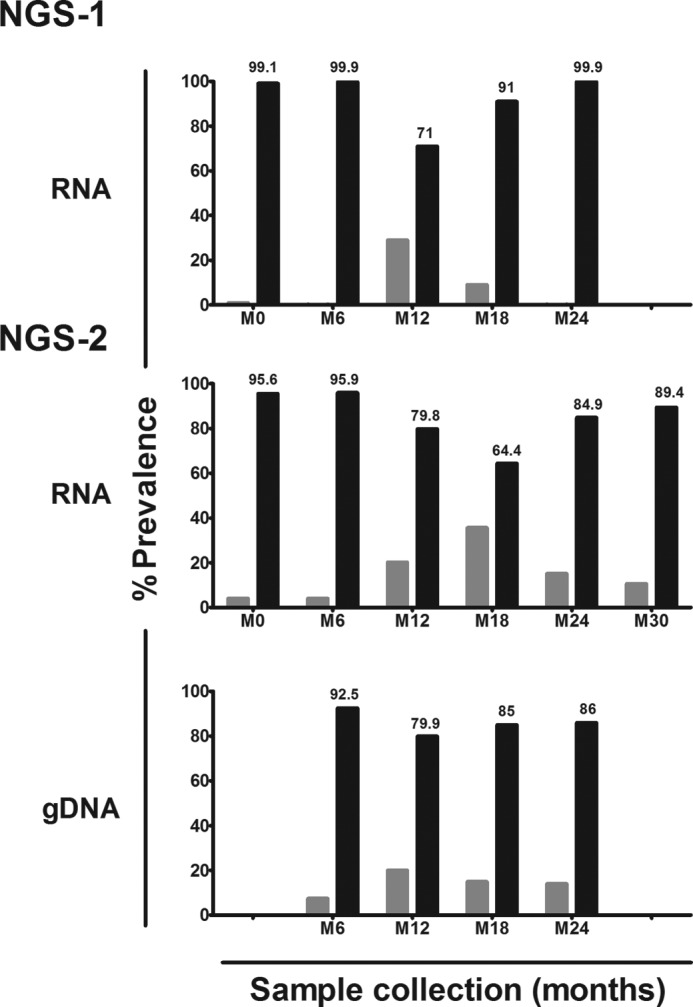
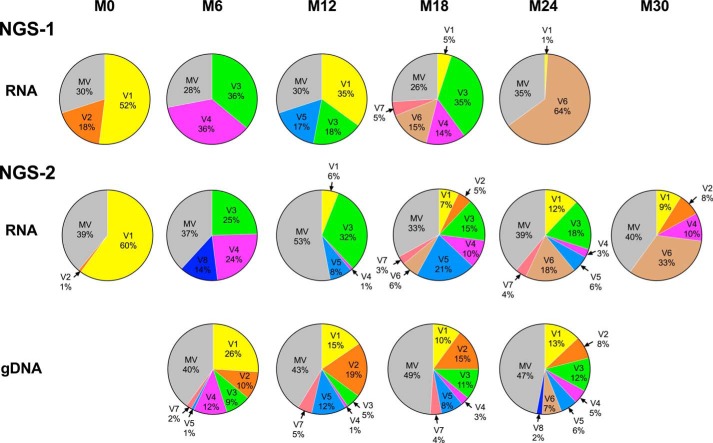
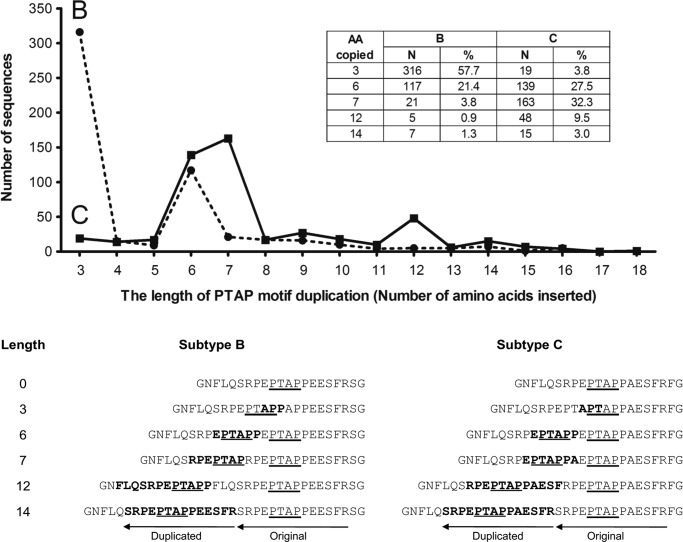
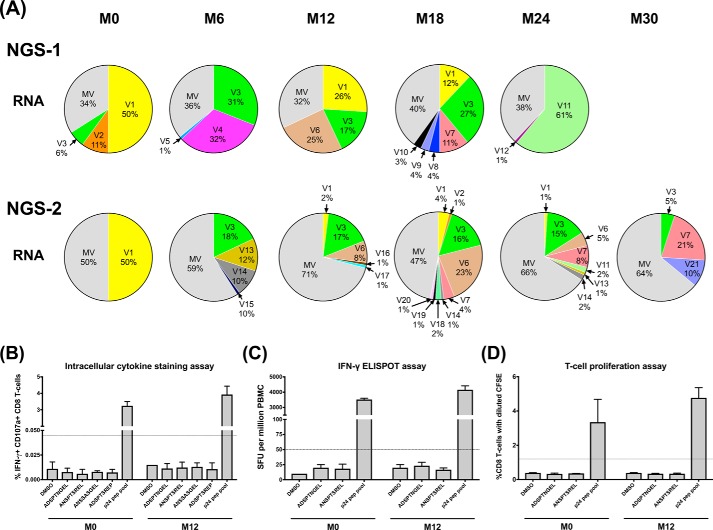
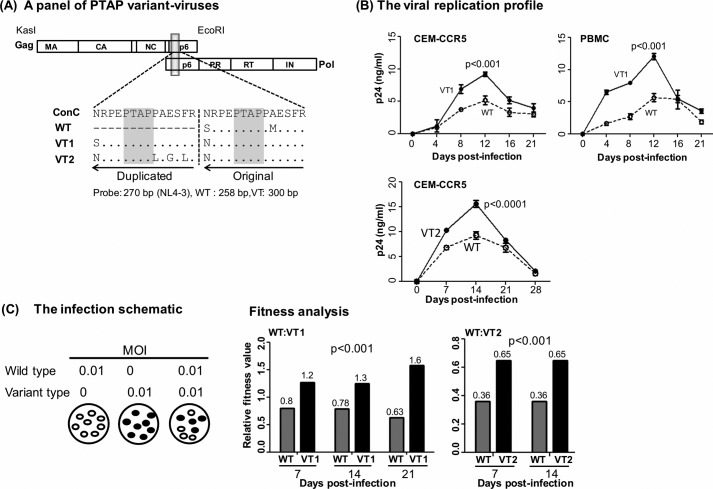
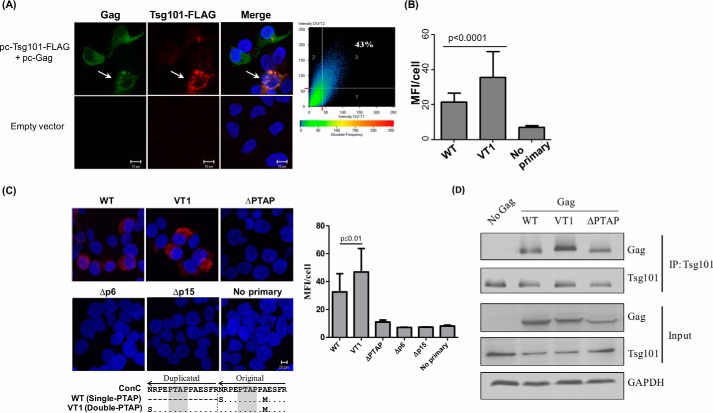
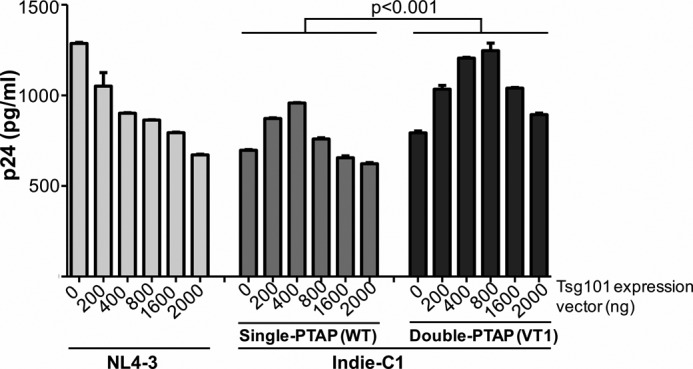
HIV-1 subtype C (HIV-1C) may duplicate longer amino acid stretches in the p6 Gag protein, leading to the creation of an additional Pro-Thr/Ser-Ala-Pro (PTAP) motif necessary for viral packaging. However, the biological significance of a duplication of the PTAP motif for HIV-1 replication and pathogenesis has not been experimentally validated. In a longitudinal study of two different clinical cohorts of select HIV-1 seropositive, drug-naive individuals from India, we found that 8 of 50 of these individuals harbored a mixed infection of viral strains discordant for the PTAP duplication. Conventional and next-generation sequencing of six primary viral quasispecies at multiple time points disclosed that in a mixed infection, the viral strains containing the PTAP duplication dominated the infection. The dominance of the double-PTAP viral strains over a genetically similar single-PTAP viral clone was confirmed in viral proliferation and pairwise competition assays. Of note, in the proximity ligation assay, double-PTAP Gag proteins exhibited a significantly enhanced interaction with the host protein tumor susceptibility gene 101 (Tsg101). Moreover, Tsg101 overexpression resulted in a biphasic effect on HIV-1C proliferation, an enhanced effect at low concentration and an inhibitory effect only at higher concentrations, unlike a uniformly inhibitory effect on subtype B strains. In summary, our results indicate that the duplication of the PTAP motif in the p6 Gag protein enhances the replication fitness of HIV-1C by engaging the Tsg101 host protein with a higher affinity. Our results have implications for HIV-1 pathogenesis, especially of HIV-1C.

Keywords: Gag; HIV-1C; NGS; PTAP duplication; Replication advantage; human immunodeficiency virus (HIV); infectious disease; viral DNA; viral protein; viral replication.


Conflict of interest statement

The authors declare that they have no conflicts of interest with the contents of this article

Figures

Figure 1.
Figure 1.
Domination of double-PTAP viral strains in subject T004 in NGS. Two independent rounds of NGS were performed using only plasma viral RNA (NGS-1) and both plasma viral RNA and genomic DNA extracted from peripheral blood (NGS-2). Whereas M0 represents the baseline at which the first sample was collected from the subject, other samples were collected at follow-up times spaced 6 months apart. The dark bars represent the percent prevalence of the double-PTAP forms of the viral quasispecies, and the gray bars represent the WT forms containing a single PTAP motif.
Figure 2.
Figure 2.
Rapidly changing profile of the double-PTAP forms in subject T004. Each pie chart represents the profile of the PTAP variant forms in the sample at a specific time point. Each slice in a pie chart represents a specific variant at a prevalence of 1% or above the total reads. All the viral variant forms present below 1% prevalence were pooled as the minority variants (MV). NGS-1 and NGS-2 analyses were performed using the plasma viral RNA alone or plasma viral RNA as well as the genomic DNA, respectively. The variant V5 represents the WT-like viral strains that contain a single-PTAP motif. See Table 2 for the sequence information of each of the major viral variants V1–V8.
Figure 3.
Figure 3.
Comparative analysis of the length and frequency association in the PTAP motif of subtypes B and C. Full-length Gag protein sequences belonging to the HIV-1 subtypes B and C were downloaded from the HIV LANL sequence database (accessed in June, 2017). One sequence per patient was selected for the analysis. Of the 3,895 and 1,879 subtype B and subtype C sequences analyzed, 548 and 505 sequences, respectively, contained a sequence insertion in the PTAP motif. The number of sequences containing an insertion is plotted against the length of duplication. The numbers and percentages of sequences with a duplication of 3, 6, 7, 12, and 14 amino acids are depicted (inset). The percentage values represent the proportion of sequences containing a PTAP duplication. The 21 amino acid windows consisting of the PTAP motif and representing the consensus sequences of subtypes B and C are presented below. The original and duplicated amino acid sequences are indicated. The arrows indicate the length of the PTAP motif and the flanking amino acids and the direction of reverse transcription. The duplicated amino acid residues are highlighted in bold. The core PTAP motifs are underlined.
Figure 4.
Figure 4.
p6 pol peptide-specific CD8 T-cell immune responses in subject T004. A, each pie chart represents the profile of the p6 pol variant viral forms at a specific time point. Each slice in a pie chart represents a specific variant at a prevalence of 1% or above of the total reads. All the viral variant forms present below 1% prevalence were pooled as the minority variants (MV). NGS-1 and NGS-2 analyses performed using the plasma viral RNA are presented. See Table S2 for the sequences of the major variant viral forms. B, frequency of antigen-specific CD8 T-cell subsets double-positive for IFN-γ secretion and CD107a degranulation as measured using the ICS assay. Stored PBMCs derived from time points M0 and M12 were used in all the three immune assays. C, number of IFN-γ spot-forming units measured using the ELISPOT assay. D, percentage of CD8 T-cells showing a diluted CFSE staining. The dotted lines indicate the cutoff value defined as three times the mean value of the DMSO control. The error bars represent the standard deviation from the mean of responses from three assay replicates.
Figure 5.
Figure 5.
Replication profile of the single- and double-PTAP viral molecular strains of the Indie-C1 molecular clone. A, panel of three PTAP-variant viral strains. WT lacks PTAP duplication. The PTAP sequences of VT1 and VT2 represent the dominant NGS forms of T004 RNA at M0 (see Fig. S1). The viral strains of the panel are genetically identical except for the differences shown in the PTAP motifs. Both the PTAP motif sequences are compared with the HIV-1C consensus sequence in the sequence alignment. The dashes represent sequence deletion, and dots represent sequence identity. B, replication profile of VT1 (top panels, CEM-CCR5 T-cells or CD8-depleted and activated PBMC of a healthy subject) and VT2 (bottom panel, CEM-CCR5 T-cells) strains was compared with that of WT. The cells were infected with 100 TCID50 units of single- or double-PTAP viral strain in duplicate wells, and the secretion of p24 into the medium was monitored up to 21–28 days. The data are presented as the mean of quadruplicate wells ± S.D. and representative of two independent experiments. A two-way ANOVA test was performed to determine the significance of the difference in proliferation between the viral strains. Comparable results were obtained with the PBMC of several other healthy donors. C, pairwise growth competition between single- and double-PTAP viral strains in HTA. The left panel shows the schematic representation of the ratios of the paired viruses used in the assay. Genomic DNA was extracted from the infected cells every week following infection and used in the assay as described under “Materials and methods.” The relative fitness values (depicted above the bars) of the competing viral strains WT versus VT1 (middle panel, days 7, 14, and 21) and WT versus VT2 (right panel, days 7 and 14) in CEM-CCR5 cells are presented. A two-way ANOVA test was performed to determine the statistical significance. Data are representative of two independent experiments.
Figure 6.
Figure 6.
Immunofluorescence analysis of interaction between Gag and TSG101. A, colocalization of Tsg101 and Gag. Representative confocal images of 293T cells expressing Tsg101-FLAG (red) and pcGag (green). The nuclei are stained with DAPI (blue). Scale bar, 10 μm. Tsg101 shows a significant level of (43%) colocalization with Gag as depicted. Inset on the right, plot shows percent colocalization within the cell marked with the white arrow. B, Gag and Tsg101 interaction in HEK293T cells quantitated using the proximity ligation assay. The cells were cotransfected with plasmids encoding Tsg101 and either the single-PTAP or double-PTAP Gag vector at a ratio of 1:2. The cells were examined by confocal microscopy 36 h after the transfection. No Primary: a negative control without the anti-Tsg101 primary antibody. The fluorescence intensities of 200 cells selected randomly were determined and presented as the mean fluorescence intensity per cell. p < 0.0001 using the Student's t test. C, representative confocal images of 293T cells cotransfected with Tsg101 and pcGag variant expression vectors at a ratio of 1:2. Five different Gag vectors were used in the assay as follows: single-PTAP Gag (WT); double-PTAP Gag (VT1); single-PTAP Gag containing a deletion of PTAP motif (ΔPTAP); p6 domain deleted (Δp6), or both p6 and p7 domains deleted (Δp15). The cells were examined by confocal microscopy 36 h after transfection. The red fluorescent signal is indicative of protein–protein interaction. Blue represents the DAPI staining of the nuclei. The PTAP sequence of the 14-amino acid residues is aligned with subtype C consensus sequence (lower panel). The dots represent sequence identity, and the dashes represent deletion. The PTAP sequences are adapted from the virus of T004 at M0. Scale bar: 20 μm. Right panel, fluorescence intensities of 30 randomly selected cells were determined and presented as the mean fluorescence intensity per cell (n = 30). p < 0.01 using the Student's t test. D, coimmunoprecipitation assay to confirm the interaction between Tsg101 and variant Gag proteins. HEK293T cells were transfected with one of the three variant Gag vectors, WT, VT1, and ΔPTAP Gag. Total cytoplasmic extracts were prepared from the transfected cells, and the endogenously expressed Tsg101 was immunoprecipitated. The immunoprecipitated samples were electroblotted and probed for Gag and Tsg101.
Figure 7.
Figure 7.
PTAP motif duplication confers higher levels of inducibility on HIV-1C. HEK293T cells were cotransfected with 200 ng of one of the three viral vectors and progressively increasing concentrations of the Tsg101–FLAG expression vector ranging from 200 to 2,000 ng. The secretion of p24 into the medium was quantitated at 48 h and normalized against the β-gal transfection control. Data presented are representative of two independent experiments performed in triplicate wells. Statistical analysis was performed using the two-way ANOVA test.

References

    1. Hemelaar J., Gouws E., Ghys P. D., Osmanov S., and WHO-UNAIDS Network for HIV Isolation and Characterisation (2011) Global trends in molecular epidemiology of HIV-1 during 2000–2007. AIDS 25, 679–689 10.1097/QAD.0b013e328342ff93 - DOI - PMC - PubMed
    1. Bachu M., Yalla S., Asokan M., Verma A., Neogi U., Sharma S., Murali R. V., Mukthey A. B., Bhatt R., Chatterjee S., Rajan R. E., Cheedarla N., Yadavalli V. S., Mahadevan A., Shankar S. K., et al. (2012) Multiple NF-κB sites in HIV-1 subtype C long terminal repeat confer superior magnitude of transcription and thereby the enhanced viral predominance. J. Biol. Chem. 287, 44714–44735 10.1074/jbc.M112.397158 - DOI - PMC - PubMed
    1. Siddappa N. B., Dash P. K., Mahadevan A., Desai A., Jayasuryan N., Ravi V., Satishchandra P., Shankar S. K., and Ranga U. (2005) Identification of unique B/C recombinant strains of HIV-1 in the southern state of Karnataka, India. AIDS 19, 1426–1429 10.1097/01.aids.0000180795.49016.89 - DOI - PubMed
    1. Ramírez d A., Soriano V., Alcamil J., and Holguín A. (2006) New findings on transcription regulation across different HIV-1 subtypes. AIDS Rev. 8, 9–16 - PubMed
    1. De Baar M. P., De Ronde A., Berkhout B., Cornelissen M., Van Der Horn K. H., Van Der Schoot A. M., De Wolf F., Lukashov V. V., and Goudsmit J. (2000) Subtype-specific sequence variation of the HIV type 1 long terminal repeat and primer-binding site. AIDS Res. Hum. Retroviruses 16, 499–504 10.1089/088922200309160 - DOI - PubMed

Publication types

MeSH terms

Substances