. 2018 Jun 15;360(6394):eaao4908.
doi: 10.1126/science.aao4908. Epub 2018 May 17.

Unresolved endoplasmic reticulum stress engenders immune-resistant, latent pancreatic cancer metastases

Affiliations

Unresolved endoplasmic reticulum stress engenders immune-resistant, latent pancreatic cancer metastases

Arnaud Pommier et al. Science. .

Abstract

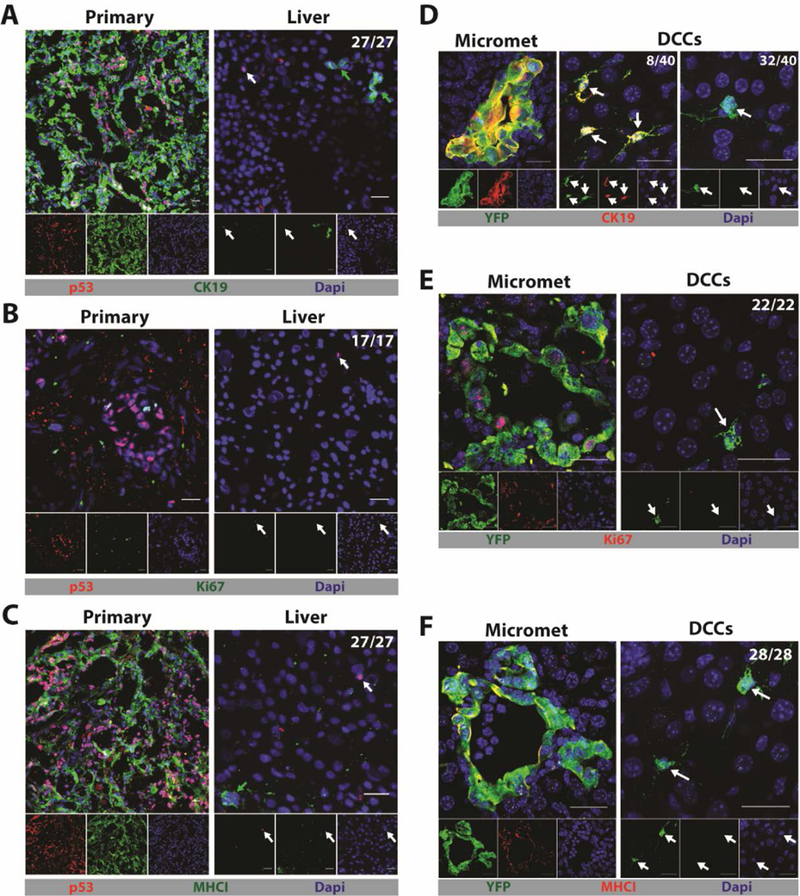
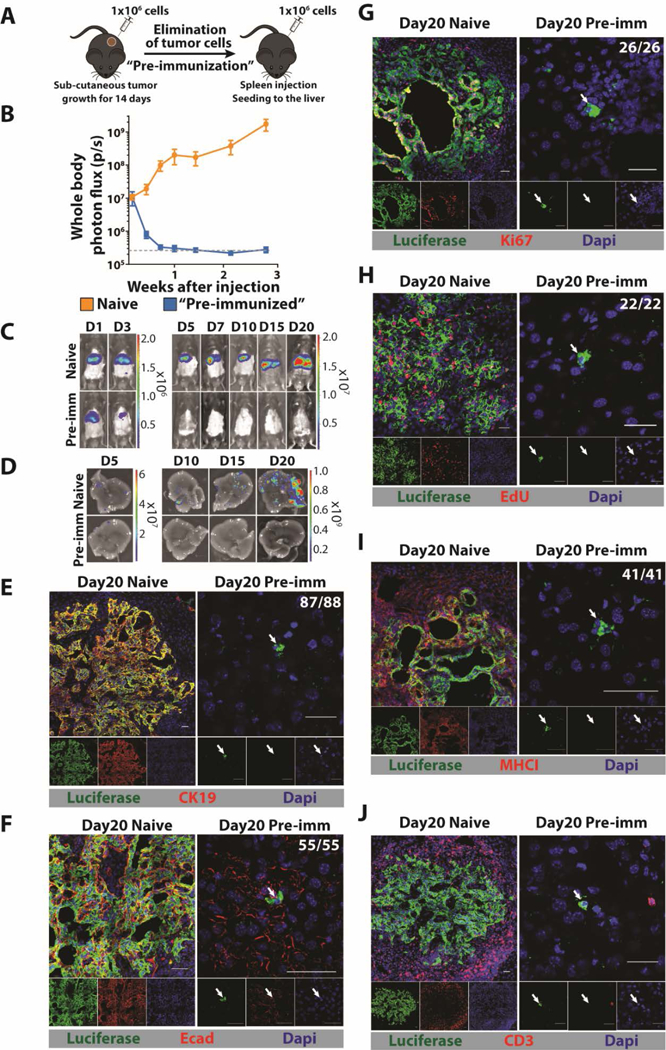
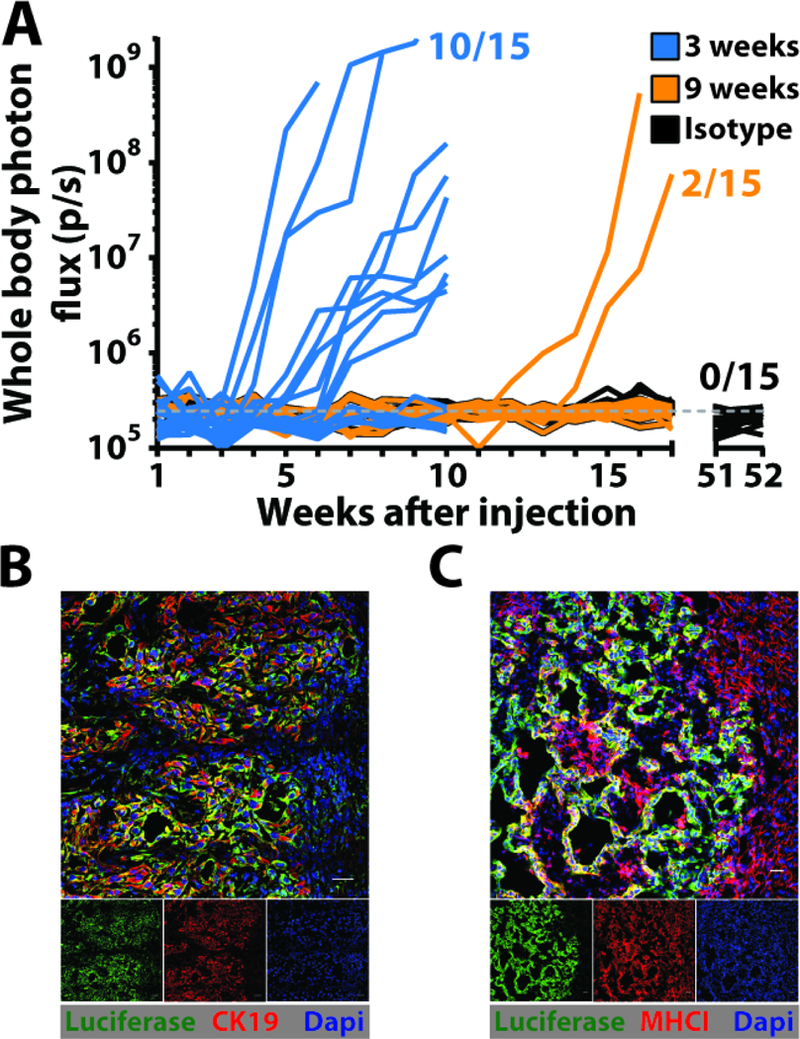
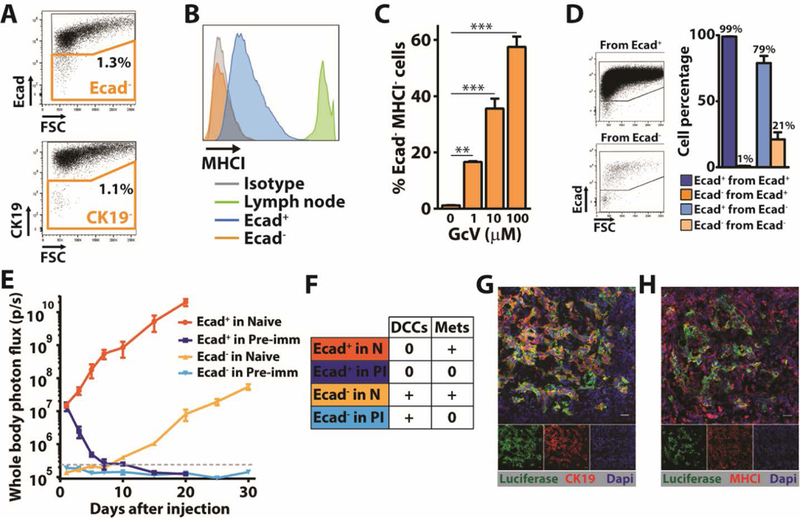
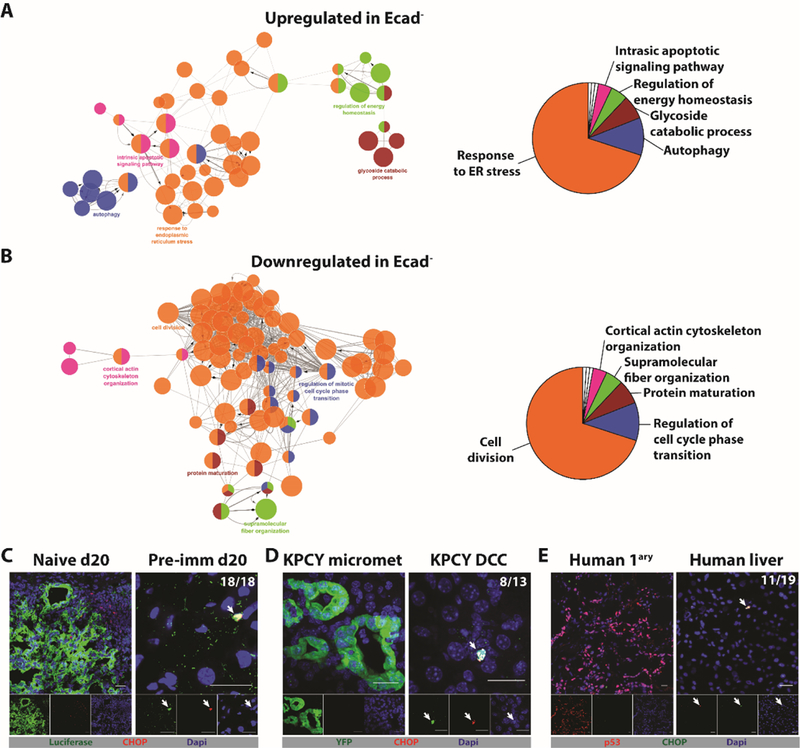
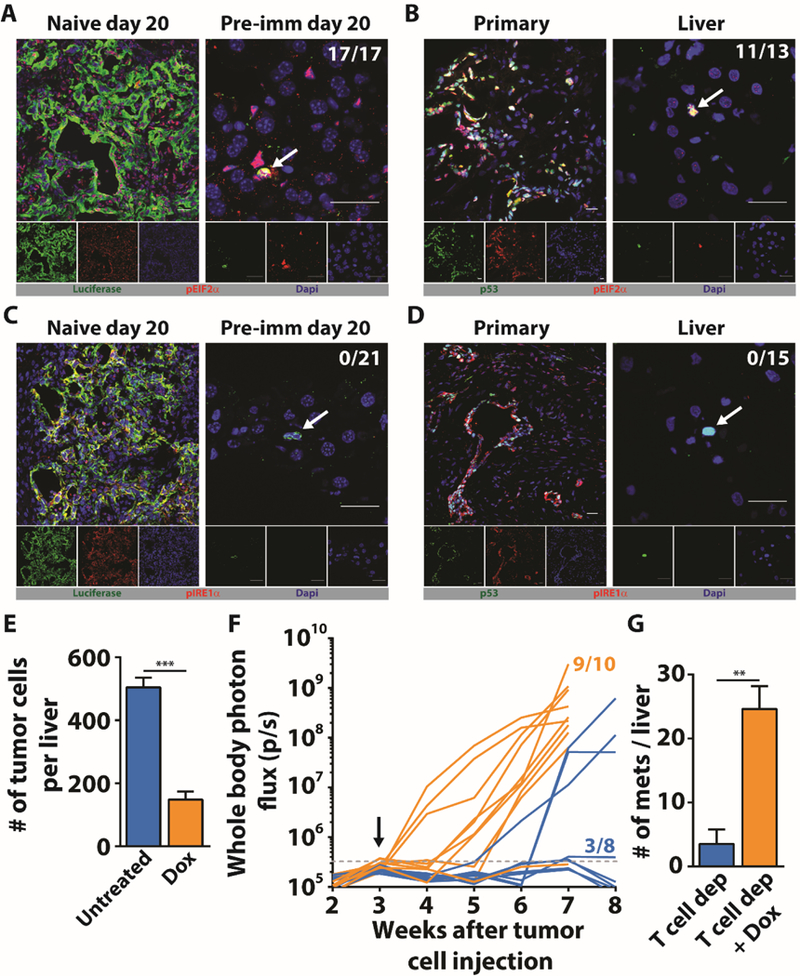
The majority of patients with pancreatic ductal adenocarcinoma (PDA) develop metastatic disease after resection of their primary tumor. We found that livers from patients and mice with PDA harbor single disseminated cancer cells (DCCs) lacking expression of cytokeratin 19 (CK19) and major histocompatibility complex class I (MHCI). We created a mouse model to determine how these DCCs develop. Intraportal injection of immunogenic PDA cells into preimmunized mice seeded livers only with single, nonreplicating DCCs that were CK19- and MHCI- The DCCs exhibited an endoplasmic reticulum (ER) stress response but paradoxically lacked both inositol-requiring enzyme 1α activation and expression of the spliced form of transcription factor XBP1 (XBP1s). Inducible expression of XBP1s in DCCs, in combination with T cell depletion, stimulated the outgrowth of macrometastatic lesions that expressed CK19 and MHCI. Thus, unresolved ER stress enables DCCs to escape immunity and establish latent metastases.


Figures

Fig. 1.
Fig. 1.. Single DCCs with a characteristic phenotype are present in the livers of humans and mice with PDA.
(A-C) Immunofluorescence (IF) of sections from the primary tumor and liver of a patient with PDA that have been stained with anti-p53 to reveal cancer cells (red) and (A) anti-CK19 (green), (B) anti-Ki67 (green) or (C) anti-MHCI (green). Photomicrographs are representative of five patients. (D-F) IF of sections from a liver of a KPCY mouse with spontaneous PDA and no hepatic macro-metastases. Sections were stained with anti-YFP to reveal cancer cells (green) and (D) anti-CK19 (red), (E) anti-Ki67 (red), and (F) anti-MHCI (red). Photomicrographs are representative of three mice. The ratios shown in the top right corners of the photomicrographs represent the frequency of the observed DCC phenotype relative to the total number of DCCs that were assessed. All frequencies are compiled in table S2. White arrows designate DCCs and, in the sections of human livers, green arrows designate normal, liver-resident CK19+ or MHCI+ cells. Scale bar = 25μm.
Fig. 2.
Fig. 2.. A mouse model for hepatic DCCs.
(A) Mice are pre-immunized by subcutaneous injection of 106 mM1DTLB PDA cells derived from a hepatic metastasis of a KPC mouse. After two weeks, tumors are eliminated by treating mice with DTx and GcV. For hepatic metastases, 106 mM1DTLB PDA cells are injected intra-splenically into naïve and pre-immunized mice, followed immediately by splenectomy. (B, C) Tumor growth was measured by whole body bioluminescence imaging. (D) Ex vivo photon flux of whole livers was measured at day 5, 10, 15 and 20 after cancer cell injection. Results are representative of three experiments with at least five mice per group. Dashed gray line represents the background luminescence in tumor-free mice. (E-J) IF of sections from a liver of a naive mouse (left panels) or a pre-immunized mouse (right panels) that have been stained with anti-luciferase (green) to identify cancer cells and (E) anti-CK19 (red), (F) anti-Ecad (red), (G) anti-Ki67 (red), (H) EdU (red), (I) anti-MHCI (red), and (J) CD3 (red). For EdU staining, mice were injected every 12 hours with EdU for three days. Photographs are representative of 20 mice from three independent experiments. The ratios shown in the top right corners of the photomicrographs represent the frequency of the observed DCC phenotype relative to the total number of DCCs that were assessed. All frequencies are compiled in table S2. White arrows designate DCCs. Scale bar = 25μm.
Fig. 3.
Fig. 3.. T cells control outgrowth of latent DCCs.
(A) The growth of hepatic metastases in pre-immunized mice that had been depleted of T cells by administration of antibodies to CD4 and CD8 beginning at three weeks or nine weeks after splenic injection of mM1DTLB PDA cells was assessed by bioluminescence imaging. One group of mice was also treated with isotype control antibody. (B and C) IF of sections containing macro-metastases from a liver of a pre-immunized mouse that had been depleted of T cells three weeks after splenic injection of mM1DTLB PDA cells. Anti-luciferase identifies cancer cells. Scale bar = 25μm.
Fig. 4.
Fig. 4.. A subpopulation of PDA cells in vitro shares phenotypic features with DCCs.
(A) Flow cytometry analysis of mM1DTLB PDA cells that have been stained with anti-CK19 or anti-Ecad. Results are representative of five independent experiments. (B) Flow cytometry measurement of anti-MHCI staining of Ecad+ and Ecad- mM1DTLB PDA cells, and of lymph node cells as a comparator. Results are representative of five independent experiments. (C) mM1DTLB PDA cells were treated in vitro for 48h with increasing doses of GcV to kill proliferating cells, and the proportion of viable cells that was Ecad-/MHCI- was measured by flow cytometry. Results are representative of two independent experiments. **=p<0.01, ***=p<0.001. (D) FACS analysis of purified Ecad+ and Ecad- mM1DTLB PDA cells, respectively, that have been cultured for three days. Dot plots (left panel) and histograms (right panel) are representative of three independent experiments. (E) Growth of hepatic metastases after intra-splenic injection of 106 Ecad+ or 104 Ecad- mM1DTLB PDA cells into naïve and pre-immunized mice was assessed by whole body bioluminescence imaging. n=5 mice per group. Dashed gray line represents the luminescence background in tumor-free mice. (F) Table summarizing the occurrence of DCCs and/or metastases in each group of mice thai had been injected with Ecad+ or Ecad- mM1DTLB cells. (G and H) IF of sections from a liver of a naïve mouse that had received an intra-splenic injection of Ecad- mM1DTLB cells. Anti-luciferase (green) identifies cancer cells. Photomicrographs are representative of five mice. Scale bar=25μm.
Fig. 5.
Fig. 5.. The ER stress response in PDA cells that share phenotypic features of DCCs.
104 Ecad+ and 98 Ecad- mM1DTLB PDA cells were subjected to single-cell RNA-Seq. (A) Network analysis, following pathway enrichment analysis, shows ontology relationships between the pathways (left panel). Their relative representation is depicted as a pie chart (right panel) for (A) Upregulated pathways and (B) Downregulated pathways in the Ecad- cells relative to Ecad+ cells. Pathways are significant with an adjusted p<0.01 after Benjamini-Hochberg false discovery rate. (C) Liver sections from a naive mouse and a pre-immunized mouse were stained with anti-luciferase (green) to identify PDA cells and anti-CHOP (red) to identify cells exhibiting an ER stress response. (D) Liver sections from a KPCY mouse were stained with anti-YFP (green) to identify PDA cells and with anti-CHOP (red). (E) Sections from the primary tumor and liver of a patient with PDA were stained with anti-p53 to identify PDA cells (red) and with anti-CHOP (green). Photomicrographs are representative of five patients who had no detectable liver metastases. The ratios shown in the top right corners of the photomicrographs represent the frequency of the observed DCC phenotype relative to the total number of DCCs that were assessed. All frequencies are compiled in table S2. White arrows designate DCCs. Scale bar = 25μm.
Fig. 6.
Fig. 6.. Absence of IRE1α pathway activation in DCCs.
(A) Liver sections from naive and pre-immunized mice were stained with anti-luciferase (green) to identify PDA cells and anti-pEIF2α (red) to assess activation of the PERK pathway. (B) Sections from the primary tumor and liver of a patient with PDA were stained with anti-p53 to identify PDA cells (green) and anti-pEIF2α (red). (C) Liver sections from naive and pre-immunized mice were stained with anti-luciferase (green) to identify PDA cells and anti-pIRE1α (red). (D) Sections from the primary tumor and liver of a patient with PDA were stained with anti-p53 to identify PDA cells (green) and anti-pIRE1α (red). Photomicrographs are representative of five patients who had no detectable liver metastases. The ratios shown in the top right corners of the photomicrographs represent the frequency of the observed DCC phenotype relative to the total number of DCCs that were assessed. All frequencies are compiled in table S2. White arrows designate DCCs. Scale bar = 25μm. (E) Pre-immunized mice (n=5) that had received splenic injections of mM1TetXBP1s PDA cells were treated with Dox starting on the day of injection. The number of hepatic DCCs was determined three weeks later and compared to that of mice not receiving Dox (n=5). (F) Pre-immunized mice that had received splenic injections of mM1TetXBP1s PDA cells were treated (n=10) or not treated (n=8) with Dox beginning three weeks later. T cells were depleted by administering anti-CD4 and anti-CD8 antibodies. Growth of hepatic metastases was assessed by whole body bioluminescence imaging (G) The mean number of bioluminescent metastases formed with or without Dox treatment was determined in resected livers. ** = p<0.01, *** = p<0.001.

Comment in

  • Balance of stresses guides metastasis.
    Thoma C. Thoma C. Nat Rev Gastroenterol Hepatol. 2018 Sep;15(9):520. doi: 10.1038/s41575-018-0047-0. Nat Rev Gastroenterol Hepatol. 2018. PMID: 29985452 No abstract available.

References

    1. Zhang Q et al. , Pancreatic Cancer Epidemiology, Detection, and Management. Gastroenterol Res Pract 2016, 8962321 (2016). - PMC - PubMed
    1. Hariharan D, Saied A, Kocher HM, Analysis of mortality rates for pancreatic cancer across the world. HPB (Oxford) 10, 58 (2008). - PMC - PubMed
    1. Groot VP et al. , Patterns, Timing, and Predictors of Recurrence Following Pancreatectomy for Pancreatic Ductal Adenocarcinoma. Ann Surg, (March 23, 2017). - PubMed
    1. Van den Broeck A et al. , Patterns of recurrence after curative resection of pancreatic ductal adenocarcinoma. Eur J Surg Oncol 35, 600 (June, 2009). - PubMed
    1. Kim R et al. , PET/CT Fusion Scan Prevents Futile Laparotomy in Early Stage Pancreatic Cancer. Clin Nucl Med 40, e501 (November, 2015). - PMC - PubMed

Publication types

MeSH terms