. 2018 May 17;14(5):e7998.
doi: 10.15252/msb.20177998.

The relative resistance of children to sepsis mortality: from pathways to drug candidates

Affiliations

The relative resistance of children to sepsis mortality: from pathways to drug candidates

Rose B Joachim et al. Mol Syst Biol. .

Abstract

Attempts to develop drugs that address sepsis based on leads developed in animal models have failed. We sought to identify leads based on human data by exploiting a natural experiment: the relative resistance of children to mortality from severe infections and sepsis. Using public datasets, we identified key differences in pathway activity (Pathprint) in blood transcriptome profiles of septic adults and children. To find drugs that could promote beneficial (child) pathways or inhibit harmful (adult) ones, we built an in silico pathway drug network (PDN) using expression correlation between drug, disease, and pathway gene signatures across 58,475 microarrays. Specific pathway clusters from children or adults were assessed for correlation with drug-based signatures. Validation by literature curation and by direct testing in an endotoxemia model of murine sepsis of the most correlated drug candidates demonstrated that the Pathprint-PDN methodology is more effective at generating positive drug leads than gene-level methods (e.g., CMap). Pathway-centric Pathprint-PDN is a powerful new way to identify drug candidates for intervention against sepsis and provides direct insight into pathways that may determine survival.

Keywords: connectivity map; drug discovery; pathways; sepsis.


Figures

Figure 1
Figure 1. Sample heatmap generated from adult vs. child comparison using Pathprint
Pathprint analysis was used to analyze adult and child transcriptomes at the pathway level. To minimize intra‐group variation and maximize inter‐group variation, two filtering criteria were set in the generation of these data: (i) to maximize homogeneity within an age group based on minimizing the standard deviation, a cutoff of SD < 0.475 in the Pathprint score was used; (ii) to maximize differences between group comparisons using t‐tests, Pathprint scores between groups were only included if P < 10−10. The heatmap above was generated using the pheatmap package.Source data are available online for this figure.
Figure EV1
Figure EV1. Benchmarking: PDN and PPI Sensitivity vs. Specificity
To provide a benchmark for new PDN methodology, we compared drug–disease relationships produced using PDNs with curated, known drug–disease relationships from the NDFRT and SPL databases. The true‐positive (TP) and false‐positive (FP) rates (Sensitivity and 1‐Specificity) of the PDN predictions were compared to those generated using an alternative approach based on gene‐level curated protein–protein interactions (PPI). The arrow points to the network cutoff parameters used in the study: TP rate, FP rate, pEdge (probability that there is an edge between any pair of nodes), and qval (q‐value or FDR).
Figure 2
Figure 2. Comparison of several methods of drug candidate identification
Five methods of transcriptome analysis/drug candidate identification were compared in their ability to successfully produce drug targets in at least one prior study showing a survival benefit from sepsis. (i) Pathprint‐PDN: Comparison of pathways by Pathprint and drug candidate analysis by pathway drug network (PDN); (ii) DEGs‐PDN: Comparison of differentially expressed genes (DEGs) by standard methods and drug candidate analysis by PDN; (iii) Random: Drugs chosen at random from the CMap database; (iv) DEGs‐LINCS: Comparison of DEGs generated by standard methods and drug candidate analysis using LINCS database; and (v) BarCode‐LINCS: Comparison of DEGs generated by BarCode method and drug candidate analysis using LINCS database. The three gene‐level methods were found to be no better at generating positive drugs than picking drugs at random. All methods produced significantly lower percent positive rates than the Pathprint‐PDN method (P < 0.02). Prism software (GraphPad) was used to compare the frequency of prior studies showing benefit for drug leads Fisher's exact tests.
Figure 3
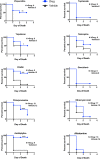
Figure 3. Validation of select PDN drug candidates in an in vivo endotoxemia model
Therapeutic leads generated using PDN were directly tested for survival benefit using a murine model of endotoxemia. Select compounds were injected 24 h before and on the day of LPS administration, using routes and doses specified in the methods. C57bl/6 female mice were injected with a high‐lethality dose of Escherichia coli LPS (38–40 μg/g) followed by a subcutaneous injection of sterile saline. Significant differences in concentration between drug and vehicle‐treated pre‐ and post‐pubertal mice are labeled with ****P < 0.0001, ***P < 0.001, **P < 0.01, or *P < 0.05. Percent survival was compared using a log‐rank Mantel–Cox test.
Figure 4
Figure 4. Summary workflow
We began by identifying publicly available datasets from transcriptome profiling experiments that analyzed blood leukocyte samples from adult and child sepsis patients. After data processing, we used Pathprint to translate these gene expression patterns to the pathway activity level. By comparing samples at the pathway level, the Pathprint method is robust to batch effect and allows for comparison across multiple array platforms. After identifying age‐associated differences in pathway activity, we used them to facilitate drug discovery by constructing targeted pathway drug networks (PDNs). This novel method works by incorporating our target pathways into a base network built upon the correlation in the expression of > 16,000 disease, pathway, and drug gene signatures across > 50,000 individual microarrays. The resultant network neighborhood was used to identify drugs with positive or negative association with high‐survival (child) or high‐mortality (adult) pathways, respectively. We validated top drug leads by curating and analyzing prior data collected in preclinical models of sepsis and also by directly testing their ability to improve survival in a mouse model of fatal endotoxemia.
Figure EV2
Figure EV2. PDN degree distribution
The degree distribution of the PDN plotted as a probability density function (PDF) and cumulative density function (CDF). The data are shown in black, together with fits to power law (red), exponential (green), and power law with exponential cutoff (blue) distributions.

Comment in

References

    1. Ahmed R, Oldstone MBA, Palese P (2007) Protective immunity and susceptibility to infectious diseases: lessons from the 1918 influenza pandemic. Nat Immunol 8: 1188–1193 - PMC - PubMed
    1. Ahn S‐H, Tsalik EL, Cyr DD, Zhang Y, van Velkinburgh JC, Langley RJ, Glickman SW, Cairns CB, Zaas AK, Rivers EP, Otero RM, Veldman T, Kingsmore SF, Lucas J, Woods CW, Ginsburg GS, Fowler J, Vance G (2013) Gene expression‐based classifiers identify Staphylococcus aureus infection in mice and humans. PLoS One 8: e48979 - PMC - PubMed
    1. Albert R (2005) Scale‐free networks in cell biology. J Cell Sci 118: 4947–4957 - PubMed
    1. Alexeyenko A, Lee W, Pernemalm M, Guegan J, Dessen P, Lazar V, Lehtio J, Pawitan Y (2012) Network enrichment analysis: extension of gene‐set enrichment analysis to gene networks. BMC Bioinformatics 13: 226 - PMC - PubMed
    1. Altschuler GM, Hofmann O, Kalatskaya I, Payne R, Sui SJH, Saxena U, Krivtsov AV, Armstrong SA, Cai T, Stein L, Hide WA (2013) Pathprinting: an integrative approach to understand the functional basis of disease. Genome Med 5: 68 - PMC - PubMed

Publication types

MeSH terms