. 2018 Jun 13;38(24):5466-5477.
doi: 10.1523/JNEUROSCI.0346-18.2018. Epub 2018 May 17.

Neural Signatures of the Processing of Temporal Patterns in Sound

Affiliations

Neural Signatures of the Processing of Temporal Patterns in Sound

Björn Herrmann et al. J Neurosci. .

Abstract

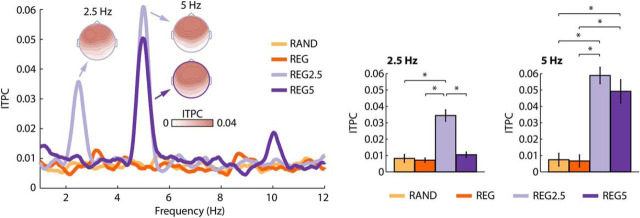
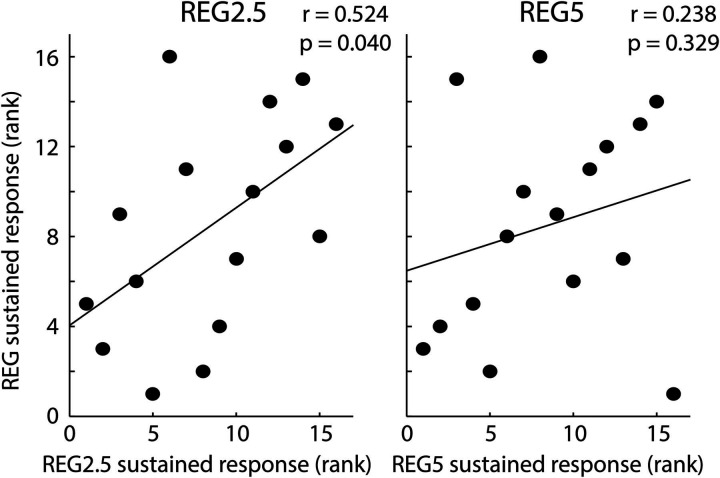
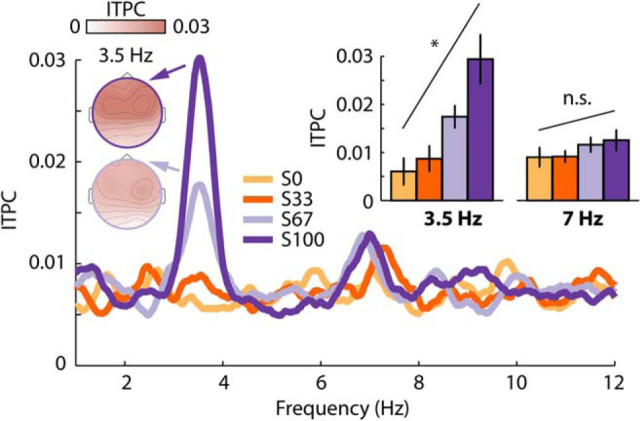
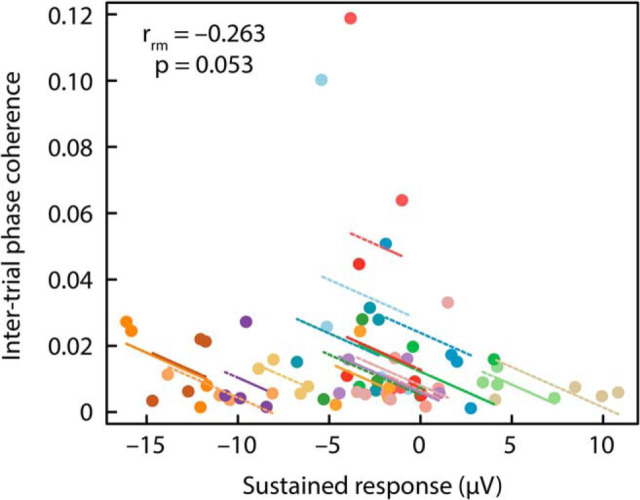
The ability to detect regularities in sound (i.e., recurring structure) is critical for effective perception, enabling, for example, change detection and prediction. Two seemingly unconnected lines of research concern the neural operations involved in processing regularities: one investigates how neural activity synchronizes with temporal regularities (e.g., frequency modulation; FM) in sounds, whereas the other focuses on increases in sustained activity during stimulation with repeating tone-frequency patterns. In three electroencephalography studies with male and female human participants, we investigated whether neural synchronization and sustained neural activity are dissociable, or whether they are functionally interdependent. Experiment I demonstrated that neural activity synchronizes with temporal regularity (FM) in sounds, and that sustained activity increases concomitantly. In Experiment II, phase coherence of FM in sounds was parametrically varied. Although neural synchronization was more sensitive to changes in FM coherence, such changes led to a systematic modulation of both neural synchronization and sustained activity, with magnitude increasing as coherence increased. In Experiment III, participants either performed a duration categorization task on the sounds, or a visual object tracking task to distract attention. Neural synchronization was observed regardless of task, whereas the sustained response was observed only when attention was on the auditory task, not under (visual) distraction. The results suggest that neural synchronization and sustained activity levels are functionally linked: both are sensitive to regularities in sounds. However, neural synchronization might reflect a more sensory-driven response to regularity, compared with sustained activity which may be influenced by attentional, contextual, or other experiential factors.SIGNIFICANCE STATEMENT Optimal perception requires that the auditory system detects regularities in sounds. Synchronized neural activity and increases in sustained neural activity both appear to index the detection of a regularity, but the functional interrelation of these two neural signatures is unknown. In three electroencephalography experiments, we measured both signatures concomitantly while listeners were presented with sounds containing frequency modulations that differed in their regularity. We observed that both neural signatures are sensitive to temporal regularity in sounds, although they functionally decouple when a listener is distracted by a demanding visual task. Our data suggest that neural synchronization reflects a more automatic response to regularity compared with sustained activity, which may be influenced by attentional, contextual, or other experiential factors.

Keywords: electroencephalography; entrainment; neural synchronization; stimulus statistics; sustained activity; temporal regularity.


Figures

Figure 1.
Figure 1.
Stimulus conditions and neural responses for Experiment I. A, Frequency of brief tones (dots) making up a 4.8 s sound. An example for each stimulus condition is shown. B, Response time courses and scalp topographies for each condition. The dotted vertical lines mark the time window of interest used for analysis (2–4.8 s). C, Mean response magnitude for the 2–4.8 s time window. Error bars reflect the SEM (removal of between-subject variance; Masson and Loftus, 2003). *pFDR ≤ 0.05. Other stimulus effects (i.e., among the 3 REG sequences) were not significant.
Figure 2.
Figure 2.
Results of the ITPC analysis for Experiment I. ITPC frequency spectrum (left) and ITPC values at the stimulus frequencies (right). Error bars reflect the SEM (removal of between-subject variance; Masson and Loftus, 2003). *pFDR ≤ 0.05. Other stimulus effects were not significant.
Figure 3.
Figure 3.
Spearman correlation between the sustained response effect for the REG condition versus the sustained response effect for the REG2.5 and REG5 conditions.
Figure 4.
Figure 4.
Repeated-measures correlations. Correlation between sustained response and ITPC. Note that the plots display negative correlations, because an increase in sustained activity reflects a negative-going signal, whereas an increase in ITPC is positive-going. Observations from the same participant are displayed in the same color, with the corresponding lines showing the fit of the repeated-measures correlation for each participant.
Figure 5.
Figure 5.
Stimulus conditions and neural responses for Experiment II. A, Examples of each of the sound conditions. Note that the representation of the auditory stimulus does not reflect the waveform of the narrow-band noise but instead the 48 frequency components (sound frequency on the y-axis). In S33, S67, and S100; 16, 32, or all 48 frequency components (respectively) become synchronized in phase at ∼2.2 s after sound onset. B, Response time courses and scalp topographies for each condition. The dotted vertical lines mark the time window of interest used for analysis (2.2–4.8 s). C, Mean response magnitude for the 2.2–4.8 s time window. Condition labels: S0, Stimulus with 0% congruent frequency components; S33, 33% congruent components; S67, 67% congruent components; S100, 100% congruent components. Error bars reflect the SEM (removal of between-subject variance; Masson and Loftus, 2003). *p < 0.05.
Figure 6.
Figure 6.
ITPC results for Experiment II. Condition labels: S0, Stimulus with 0% congruent frequency components; S33, 33% congruent components; S67, 67% congruent components; S100, 100% congruent components. Error bars reflect the SEM (removal of between-subject variance; Masson and Loftus, 2003). *p < 0.05. n.s., not significant.
Figure 7.
Figure 7.
Repeated-measures correlation between sustained response and ITPC. Note that the plots display a negative correlation, because an increase in sustained activity reflects a negative-going signal, whereas an increase in ITPC is positive-going. Observations from the same participant are displayed in the same color, with the corresponding lines showing the fit of the repeated-measures correlation for each participant.
Figure 8.
Figure 8.
Experimental design and response time course for Experiment III. A, Shows the experimental design. Participants performed either an auditory duration categorization task (half of the blocks) or a visual multiple object tracking task (the other half of the blocks). Note that the representation of the auditory stimulus does not reflect the waveform of the narrow-band noise but instead the 48 frequency components similar to Figure 5A, top. B, Response time courses and scalp topographies for each condition. The dotted vertical lines mark the time window of interest used for analysis (1.6–4 s). Bar graphs show the mean response magnitude for the 1.6–4 s time window. Condition labels: A0, Attention to auditory task, 0% congruent stimulus components; A79, attention to auditory task, 79% congruent stimulus components; V0, attention to visual task, 0% congruent stimulus components; V79, attention to visual task, 79% congruent stimulus components. Error bars reflect the SEM (removal of between-subject variance; Masson and Loftus, 2003). *p < 0.05.
Figure 9.
Figure 9.
ITPC results for Experiment III. Condition labels: A0, Attention to auditory task, 0% congruent stimulus components; A79, attention to auditory task, 79% congruent stimulus components; V0, attention to visual task, 0% congruent stimulus components; V79, attention to visual task, 79% congruent stimulus components. Error bars reflect the SEM following removal of between-subject variance (Masson and Loftus, 2003). *p < 0.05.

Similar articles

Cited by

References

    1. Alvarez GA, Konkle T, Oliva A (2007) Searching in dynamic displays: effects of configural predictability and spatiotemporal continuity. J Vis 7(14):1–12. 10.1167/7.14.12 - DOI - PubMed
    1. Baese-Berk MM, Heffner CC, Dilley LC, Pitt MA, Morrill TH, McAuley JD (2014) Long-term temporal tracking of speech rate affects spoken-word recognition. Psychol Sci 25:1546–1553. 10.1177/0956797614533705 - DOI - PubMed
    1. Bakdash JZ, Marusich LR (2017) Repeated measures correlation. Front Psychol 8:456. 10.3389/fphys.2017.00456 - DOI - PMC - PubMed
    1. Baldeweg T (2006) Repetition effects to sounds: evidence for predictive coding in the auditory system. Trends Cogn Sci 10:93–94. 10.1016/j.tics.2006.01.010 - DOI - PubMed
    1. Barascud N, Pearce MT, Griffiths TD, Friston KJ, Chait M (2016) Brain responses in humans reveal ideal observer-like sensitivity to complex acoustic patterns. Proc Natl Acad Sci U S A 113:E616–E625. 10.1073/pnas.1508523113 - DOI - PMC - PubMed

Publication types

Grants and funding

LinkOut - more resources