. 2018 May 17;9(1):1976.
doi: 10.1038/s41467-018-04261-1.

A novel small molecule chaperone of rod opsin and its potential therapy for retinal degeneration

Affiliations

A novel small molecule chaperone of rod opsin and its potential therapy for retinal degeneration

Yuanyuan Chen et al. Nat Commun. .

Abstract

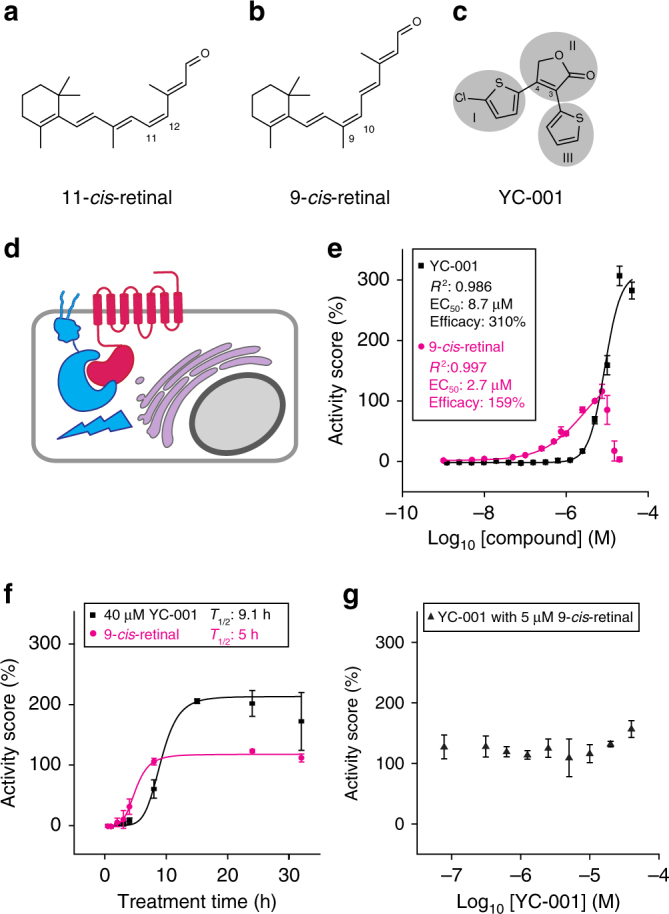
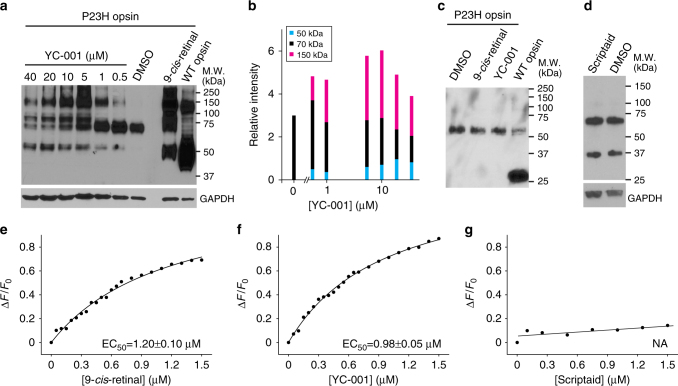
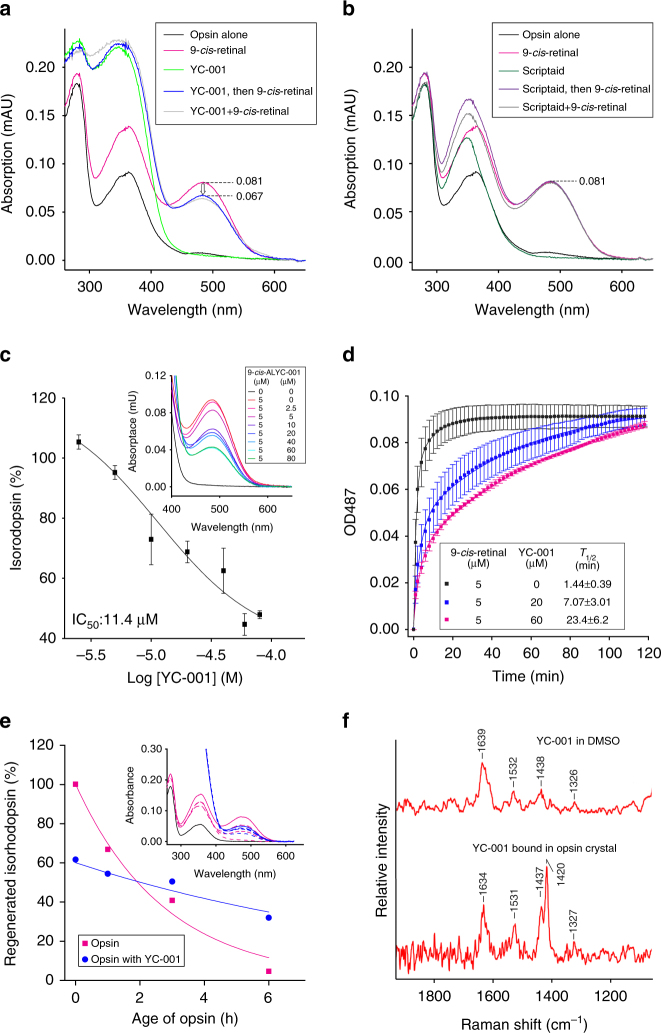
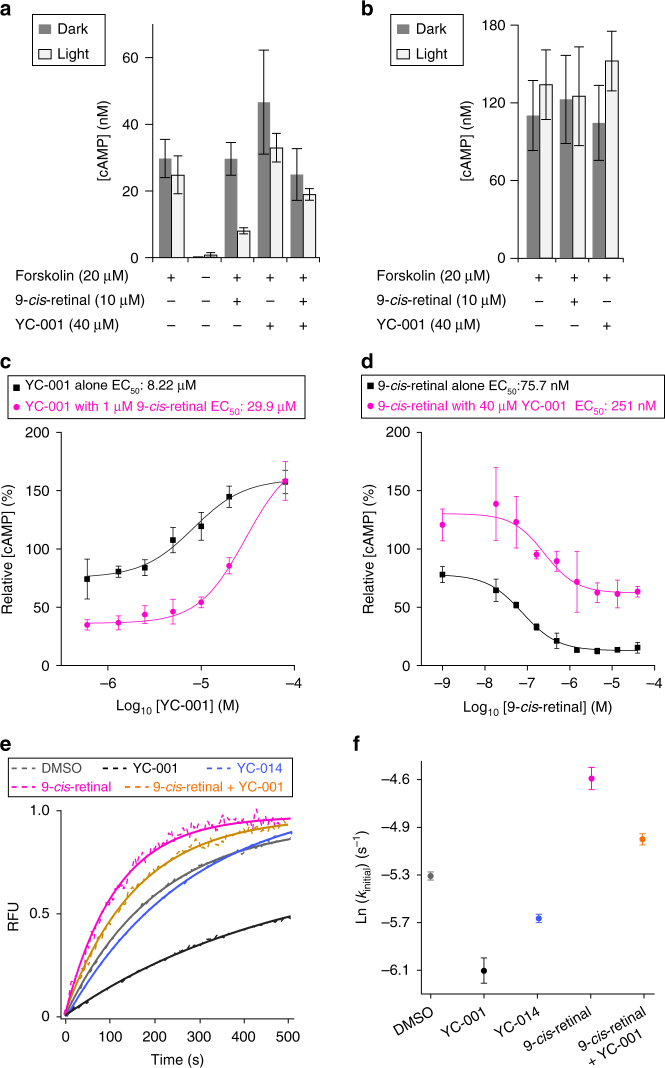
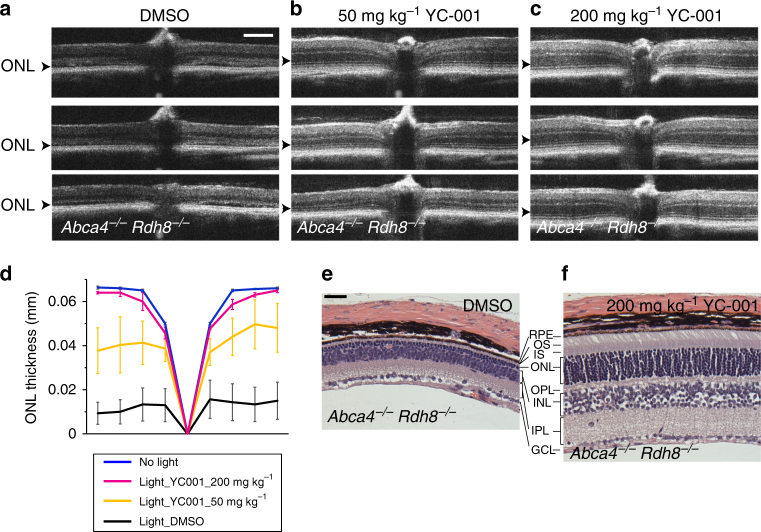
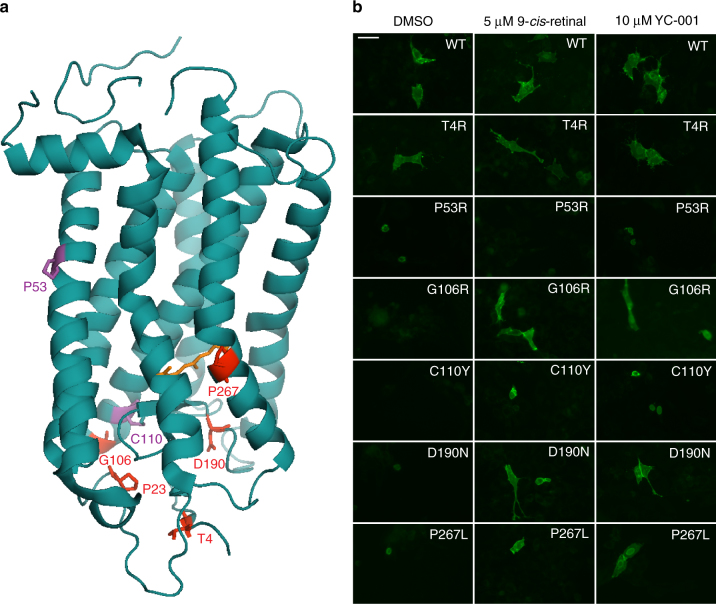
Rhodopsin homeostasis is tightly coupled to rod photoreceptor cell survival and vision. Mutations resulting in the misfolding of rhodopsin can lead to autosomal dominant retinitis pigmentosa (adRP), a progressive retinal degeneration that currently is untreatable. Using a cell-based high-throughput screen (HTS) to identify small molecules that can stabilize the P23H-opsin mutant, which causes most cases of adRP, we identified a novel pharmacological chaperone of rod photoreceptor opsin, YC-001. As a non-retinoid molecule, YC-001 demonstrates micromolar potency and efficacy greater than 9-cis-retinal with lower cytotoxicity. YC-001 binds to bovine rod opsin with an EC50 similar to 9-cis-retinal. The chaperone activity of YC-001 is evidenced by its ability to rescue the transport of multiple rod opsin mutants in mammalian cells. YC-001 is also an inverse agonist that non-competitively antagonizes rod opsin signaling. Significantly, a single dose of YC-001 protects Abca4 -/- Rdh8 -/- mice from bright light-induced retinal degeneration, suggesting its broad therapeutic potential.


Conflict of interest statement

The authors declare no competing interests.

Figures

Fig. 1
Fig. 1
YC-001 rescues P23H opsin from the ER to the plasma membrane. ac Chemical structures of 11-cis-retinal, 9-cis-retinal, and YC-001, respectively. The three chemical moieties of YC-001 are shaded and numbered. d. Diagram of the β-Gal fragment complementation assay used for the HTS. Briefly, two complementary fragments of β-Gal (EA and PK) were individually fused with a plasma membrane-anchored peptide, the pleckstrin homology domain of phospholipase C δ (PLC-EA, in cyan), and the mouse P23H-opsin mutant (P23H-PK, in magenta), respectively. A U2OS stable cell line was generated that co-expressed both PLC-EA and P23H-PK. Owing to its inherent instability, P23H-PK accumulated in the ER, whereas PLC-EA remained on the plasma membrane, leading to a loss of β-Gal activity due to the separation of the two fragments of this enzyme. Upon treatment with an active compound that rescues the folding and transport of P23H opsin to the plasma membrane, a recovery of β-Gal activity is observed due to co-localization of PK and EA. e The activities of YC-001 (black boxes) and 9-cis-retinal (magenta circles) were tested in a dose-dependent manner employing the β-Gal fragment complementation assay. Each compound was preincubated for 24 h before β-Gal activity was tested. Activity scores were standardized to the effect of 5 µM 9-cis-retinal as 100%. Dose dependence was fitted by the Hill function with Origin software. R2, EC50 (μM), and Max score for each compound were obtained from curve fitting and are listed in the graph. The experiment was repeated three times. f Activities of 40 µM YC-001 (black boxes) and 5 µM 9-cis-retinal (magenta circles) were tested as a function of time with the β-Gal fragment complementation assay. The time course graph was fitted with a Hill function and T1/2s were obtained and listed in the graph. This experiment was repeated twice. g Activities of YC-001 together with 5 µM 9-cis-retinal were tested in a dose-dependent manner and plotted in black triangles. This experiment was repeated twice. The activity scores were plotted as the averages of three biological replicates, with the error bars as the s.d.s
Fig. 2
Fig. 2
High-content imaging analysis of P23H-mutant opsin. ah are fluorescence images of NIH3T3 cells expressing mouse WT or P23H-opsin imaged with Cy3 (yellow) and DAPI (blue). Scale bar, 50 μm. Images in ad are from cells with rhodopsin immunostained on the cell surface only (non-permeabilized). Images in eh were from cells with rhodopsin immunostained in the whole cell (permeabilized). Images a, e are from NIH3T3 cells expressing WT-opsin treated with 0.1% DMSO. Images bd and fh are from NIH3T3 cells expressing P23H opsin treated with 0.1% DMSO, 10 µM YC-001 or 5 µM 9-cis-retinal, left to right, respectively. Graphs (in). Graphs i and j were quantified from cell-surface immunostaining intensities of opsin on the plasma membrane (Opsin INT); graphs k and l are ratios of opsin staining on the plasma membrane compared to the whole cell from whole-cell immunostained images (Opsin ratio PM-to-total); graphs m, n are ratios of opsin staining in the ER region compared to whole-cell staining from whole-cell immunostained images (Opsin ratio ER-to-total). i, k, m Immunofluorescence intensities of opsin in controls: 1, NIH3T3 cells expressing WT-opsin treated with 0.1% DMSO; 2, NIH3T3 cells expressing P23H opsin treated with 0.1% DMSO; 3, NIH3T3 cells expressing P23H opsin treated with 5 µm 9-cis-retinal in the dark. Graphs j, l, n are quantifications of P23H opsin on the plasma membrane (j, l) or ER (n) of NIH3T3 cells, treated with a series of doses of YC-001 (black boxes) or 9-cis-retinal (magenta boxes). Values are averages of triplicate determinations, and error bars are s.d.s from those triplicates. Dose–response curves were fitted using Origin software with EC50 (μM), A1 (low plateau) and A2 (high plateau) of each compound listed in the inset box. This experiment was repeated twice
Fig. 3
Fig. 3
YC-001 improved the glycosylation profile of P23H opsin. a Effect of different treatments on immunoblots of lysates from NIH3T3 cells expressing WT or P23H opsin. Top panel, immunoblot of opsin; bottom panel, immunoblot of GAPDH. Lanes from left to right, immunoblots from a total of 15 µg lysate from NIH3T3 cells expressing P23H opsin that were treated with 40, 20, 10, 5, 1, or 0.5 µM YC-001, 0.1% DMSO, or 5 µM 9-cis-retinal, respectively; WT-opsin, immunoblot from a total of 5 µg lysate from NIH3T3 cells expressing WT-opsin treated with 0.1 % DMSO. b Relative intensities of P23H-opsin bands at 50 kDa (blue bars), 70 kDa (black bars) and 120 kDa (magenta bars) represented in cumulative bars as a function of YC-001 dosage. The band at 50 kDa is an opsin monomer with mature glycosylation; the band at 70 kDa is an opsin dimer with immature glycosylation; the band at 120 kDa is an opsin dimer with mature glycosylation. c Immunoblot of opsin from cell lysates deglycosylated by PNGaseF. Lanes from left to right, lysates from NIH3T3 cells expressing P23H opsin treated with either 0.1% DMSO, 5 µM 9-cis-retinal or 10 µM YC-001, respectively; WT-opsin, lysate from NIH3T3 cells expressing WT-opsin treated with 0.1% DMSO. d Immunoblot of P23H opsin from cells treated with 10 µM scriptaid or 0.1% DMSO, respectively. Immunoblot of GAPDH is shown on the bottom as a loading control. eg Ligand-binding affects the chromophore-binding pocket of rod opsin. Bovine opsin within the ROS disc membranes was used for this assay. Trp fluorescence of opsin was measured both before and after addition of ligands (Supplementary Fig. 2). Changes of fluorescence intensity at 330 nm (ΔF/F0) are plotted as a function of the concentration of 9-cis-retinal (e), YC-001 (f), or scriptaid (g), respectively. Binding curves were fitted with the Hill function using Origin software. EC50s (μM) of each ligand were calculated and averaged from three biological repeats ± s.d.s and are indicated in the respective graphs. This experiment was repeated twice
Fig. 4
Fig. 4
YC-001 delays isorhodopsin pigment regeneration. Bovine opsin (2.5 µM) in ROS membranes was incubated with compounds (20 µM) for 30 min at RT. After membrane solubilization, absorbance at 487 nm was recorded to measure the amount of isorhodopsin. a UV–visible absorption spectra of opsin (black) and opsin treated with 9-cis-retinal (magenta), YC-001 (light green), YC-001 followed by 9-cis-retinal for 15 min each (blue), and a mixture of YC-001 and 9-cis-retinal (gray). b UV–visible absorption spectra of opsin treated with 9-cis-retinal (magenta), scriptaid (dark green), scriptaid followed by 9-cis-retinal for 15 min each (purple), and a mixture of 9-cis-retinal and scriptaid (gray). c Percentage of regenerated isorhodopsin from sequential treatment with YC-001 and 9-cis-retinal for 15 min each as a function of YC-001 concentration in a log format. Isorhodopsin regenerated with 9-cis-retinal alone was normalized as 100%. Values and error bars were averages and s.d.s from three biological replicates. Inset, absorption spectra of opsin with 5 μM 9-cis-retinal and 0 (red), 2.5 (pink), 5 (magenta), 10 (purple), 20 (dark blue), 40 (cyan), 60 (light blue), or 80 μM YC-001 (green), respectively. d Time course of isorhodopsin regeneration in the presence of 0, 20, or 60 μM YC-001 followed by addition 5 μM 9-cis-retinal for 15 min each (black, blue, and magenta boxes, respectively). Values and error bars were averages and s.d.s of three biological repeats. Data were fitted with second-order exponential decay and apparent half-lives (T1/2 ± standard error) are shown in the inset box. e Percentage of regenerated isorhodopsin from aged opsin (magenta) or opsin incubated with YC-001 (blue) at RT for 0, 1, 3, and 6 h before regeneration with 9-cis-retinal. Isorhodopsin regenerated from opsin at 0 h was set at 100%. Plots of regenerated isorhodopsin levels were fitted by the exponential decay function. The inset shows the absorption spectra of regenerated isorhodopsin from aged opsins. Black, opsin alone. f Raman spectrum of YC-001 in DMSO solution (top) and a difference spectrum after subtracting the spectrum of rod opsin crystal from that of opsin crystal soaked with YC-001 (bottom). Each experiment was repeated twice
Fig. 5
Fig. 5
YC-001 is an inverse agonist and antagonist to rod opsin. Rhodopsin couples to Gi/o signaling in a light-dependent manner leading to the reduction of cAMP level in mammalian cells. Forskolin was added to the cells to saturate their cAMP levels. a Levels of cAMP in NIH3T3-(Opsin/GFP) cells treated as noted under the chart. Cells treated in the dark and in light were in gray and white bars, respectively. Bar values are the averages of three replicates, and error bars are s.d.s of the replicates. b Levels of cAMP in NIH3T3-(GFP) cells treated with PBS, 10 µM 9-cis-retinal, or 40 µM YC-001, respectively. c cAMP levels in NIH3T3-(Opsin/GFP) cells treated with a series of YC-001 doses in the presence (magenta circles) or absence of 1 µM of 9-cis-retinal (black squares) under light. Doses of YC-001 tested were 80, 20, 10, 5, 2.5, 1.25, 0.625, and 0.313 µM. The cAMP level in cells treated with forskolin only was normalized as 100%, and that treated without forskolin as 0%. d cAMP levels in NIH3T3-(Opsin/GFP) cells treated with a dose series of 9-cis-retinal in the presence (magenta circles) or absence of 40 µM of YC-001 (black squares) under light. Doses of 9-cis-retinal tested were 40, 13.3, 4.44, 1.48, 0.494, 0.165, 0.055, 0.018, and 0.001 µM. e Gt activation by bovine rod opsin or isorhodopsin. Constitutive activity of bovine opsin in disc membranes or photoactivated isorhodopsin activity was recorded by fluorescence with excitation and emission at 300 and 345 nm, respectively, as a function of time, due to GTPγS-induced dissociation of the opsin/isorhodopsin: Gt complex. Dashed experimental lines were fitted by the first-order exponential decay functions shown in solid lines. Each condition was repeated in three biological replicates and initial rates and error bars were averages and s.d.s. shown in f. Opsin were treated with DMSO (gray), 40 µM YC-001 (black), 40 µM YC-014 (blue), 40 µM 9-cis-retinal (magenta), and a mixture of 40 µM 9-cis-retinal and 40 µM YC-001 (orange). Each experiment was repeated twice
Fig. 6
Fig. 6
YC-001 protects Abca4−/−Rdh8−/− mouse retinas from light damage. Owing to the loss of both ABCA4 and RDH8, all-trans-retinal cannot be efficiently cleared from the ROS of Abca4−/−Rdh8−/− mice. Thus, their retinas undergo degeneration upon exposure to intense light. Here, Abca4−/−Rdh8−/− mice were treated with either DMSO or YC-001 i.p. 30 min before exposure to 10,000 lux light for 30 min. SD-OCT images were taken seven days after light exposure (ad). Mice then were euthanized and their eyes were used for histological examination (e, f). a SD-OCT images from mice treated with 50 µL DMSO. Arrowheads indicate significantly degenerated ONL. Scale bar, 200 μm. b, c SD-OCT images from mice treated with 50 or 200 mg kg−1 bw of YC-001, respectively. d Plots of ONL thickness from SD-OCT images in (ac). Lines represent averaged ONL thicknesses from three mice and error bars are the s.d.s. n = 3. e HE staining of Abca4−/−Rdh8−/− mouse retina seven days after pre-incubation in DMSO and exposure to 10,000 lux light. Scale bar, 100 μm. f HE staining of Abca4−/−Rdh8−/− mouse retina seven days after pretreatment with 200 mg kg−1 bw YC-001 and exposure to 10,000 lux light. RPE retinal pigmented epithelium, OS outer segment, IS inner segment, ONL outer nuclear layer, OPL outer plexiform layer, INL inner nuclear layer, IPL inner plexiform layer, GCL ganglion cell layer. This experiment was repeated twice
Fig. 7
Fig. 7
YC-001 enters mouse eyes without affecting the visual cycle. a HPLC chromatogram of a YC-001 standard indicating a peak at a retention time of 13.2 min with an absorbance at 340 nm. Inset shows the standard curve of YC-001 hexane extracts with its peak area versus its weight in ng. b HPLC chromatogram of hexane extracts from four six-week-old C57BL/6 mouse eyes 0.5, 3, or 24 h after i.p. injection with YC-001 at 200 mg kg−1 bw in black, magenta, and blue, respectively. The inset is an enlarged chromatogram of the peaks with retention times from 12 to 14 min. c Amounts of YC-001 in pmol per eye plotted as a function of time after injection with YC-001. Time 0 denotes mice not injected with YC-001. d Amounts of 11-cis-retinyl-oxime representing the relative amounts of regenerated rhodopsin pigment were plotted as a function of time after bleaching. Six-week-old C57BL/6 mice were injected with 200 mg kg−1 bw YC-001 (magenta) or 50 µL DMSO i.p. 30 min before their exposure to 10,000 lux light for 10 min. Mice then were placed in the dark and euthanized at 0, 2, 4, 6, and 24 h after bleaching. Retinyl-oximes were extracted from homogenized eyes and separated by HPLC. e Recovery of mouse scotopic ERG a-wave amplitude plotted as a function of time after bleaching. Dark-adapted C57BL/6 mice received YC-001 (200 mg kg−1 bw) or DMSO by ip injection 1 h before light exposure. Mice with dilated pupils were then exposed to 2,000 lux light for 5 min. Yellow shade represents 5 min illumination. Scotopic a-wave amplitude from unbleached dark-adapted mice was shown before time 0. f Bw of YC-001 or DMSO-treated mice plotted as a function of their age. C57BL/6 mice were treated with 100 or 200 mg kg−1 bw YC-001 by daily i.p. injections, starting on Day 14. Black, DMSO; blue, 100 mg kg−1 YC-001; magenta, 200 mg kg−1 YC-001. Values and error bars were from averages and s.d.s, n = 3. Each experiment was repeated twice
Fig. 8
Fig. 8
Effect of YC-001 on the transport of rod opsin mutants. a Illustration of seven autosomal dominant retinitis pigmentosa associated mutation sites on the bovine rhodopsin crystal structure (PDB ID: 1f88). The overall structure of rhodopsin is shown in blue with 11-cis-retinal labeled in orange. Side chains of T4, P23, G106, D190, and P267 are labeled in red, and side chains of P53 and C110 are labeled in magenta. b Cell-surface immunostained images of rod opsin mutants expressed in NIH3T3 cells exposed to DMSO, 9-cis-retinal or YC-001. Cells transfected with human rhodopsin WT or mutants were treated with DMSO (0.1%) or YC-001 (10 µM) for 24 h. Cells were fixed and only rod opsin on the cell surface was immunostained with Alexa 488-conjugated B6-30 anti-rhodopsin antibody. Green fluorescence images were taken under a ×20 objective. 9-cis-retinal was tested at 5 μM and YC-001 at 10 μM, as labeled in each panel. This experiment was repeated twice
Fig. 9
Fig. 9
Synthesis of YC-001. YC-001 was synthesized by a two-step reaction. The 2-bromo-1-(5-chlorothiophen-2-yl)ethan (1) and 2-(thiophen-2-yl)acetic acid (2) were condensed in the presence of trimethylamine(Et3N) and acetonitrile (CH3CN) at room temperature (RT) for 20 min yielding the 2-(5-chlorothiophen-2-yl)-2-oxoethyl 2-(thiophen-2-yl)acetate (3), which was then treated with 1,8-diazabicycolo[5.4.0]undec-7-ene (DBU) at RT for 20 min yielding the target compound, YC-001

References

    1. Gregersen N, Bross P, Vang S, Christensen JH. Protein misfolding and human disease. Annu. Rev. Genom. Hum. Genet. 2006;7:103–124. doi: 10.1146/annurev.genom.7.080505.115737. - DOI - PubMed
    1. Thompson DA, et al. Genetics and phenotypes of RPE65 mutations in inherited retinal degeneration. Invest. Ophthalmol. Vis. Sci. 2000;41:4293–4299. - PubMed
    1. Morimura H, et al. Mutations in the RPE65 gene in patients with autosomal recessive retinitis pigmentosa or leber congenital amaurosis. Proc. Natl Acad. Sci. USA. 1998;95:3088–3093. doi: 10.1073/pnas.95.6.3088. - DOI - PMC - PubMed
    1. Zhang N, et al. Protein misfolding and the pathogenesis of ABCA4-associated retinal degenerations. Hum. Mol. Genet. 2015;24:3220–3237. doi: 10.1093/hmg/ddv073. - DOI - PMC - PubMed
    1. Rivera A, et al. A comprehensive survey of sequence variation in the ABCA4 (ABCR) gene in Stargardt disease and age-related macular degeneration. Am. J. Hum. Genet. 2000;67:800–813. doi: 10.1086/303090. - DOI - PMC - PubMed

Publication types

MeSH terms