. 2018 May 17;8(1):7764.
doi: 10.1038/s41598-018-26125-w.

Predicting transmission blocking potential of anti-malarial compounds in the Mosquito Feeding Assay using Plasmodium falciparum Male Gamete Inhibition Assay

Affiliations

Predicting transmission blocking potential of anti-malarial compounds in the Mosquito Feeding Assay using Plasmodium falciparum Male Gamete Inhibition Assay

Gonzalo Colmenarejo et al. Sci Rep. .

Abstract

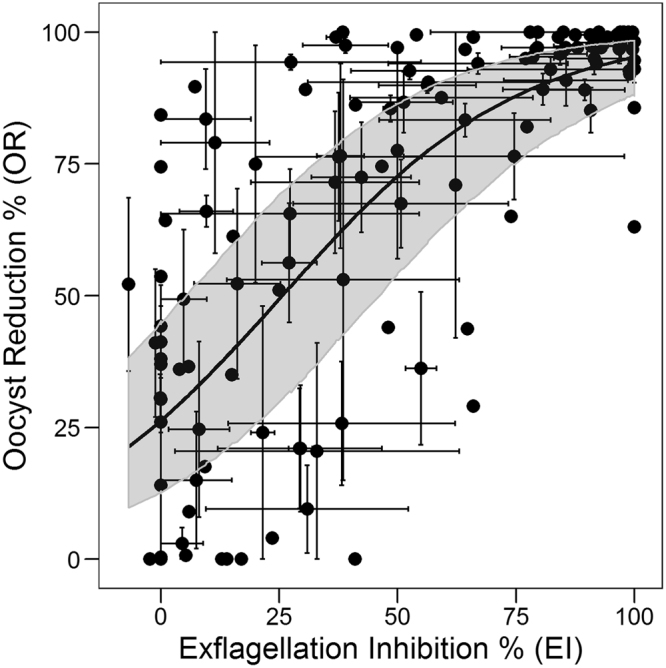
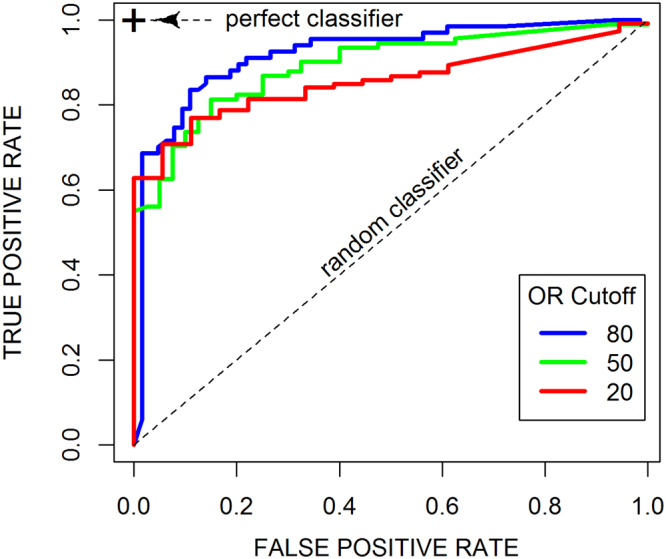
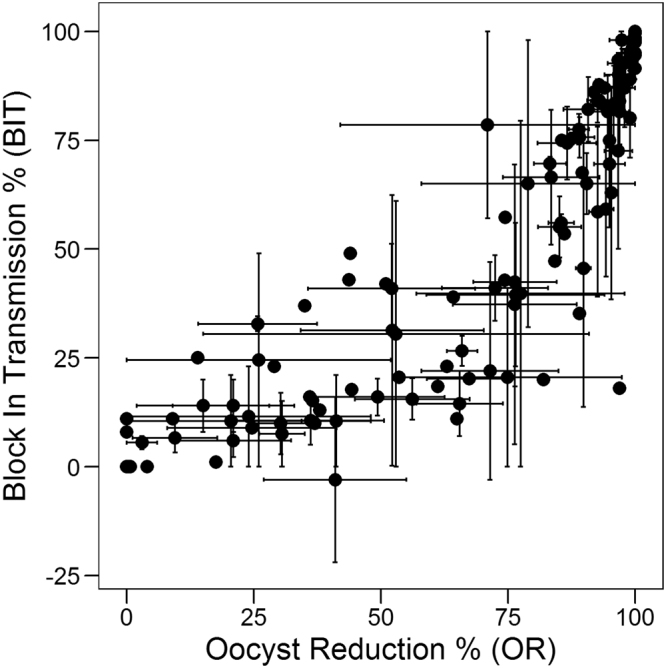
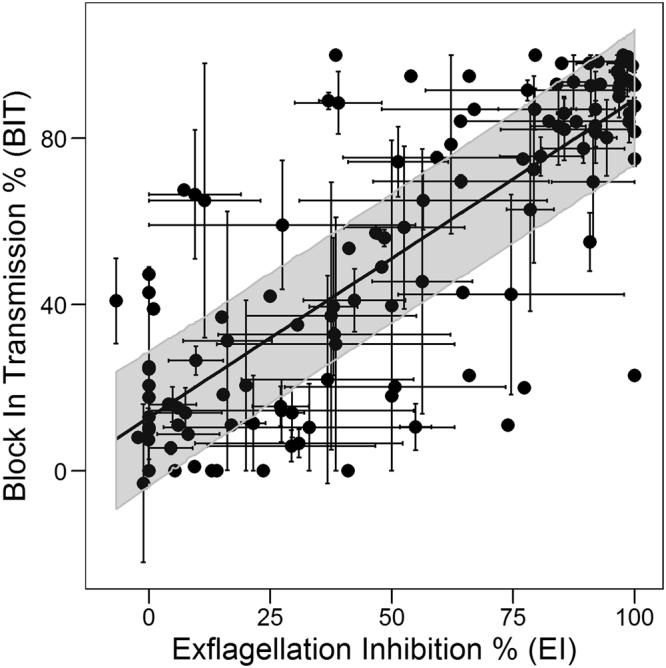
Plasmodium falciparum Standard Membrane Feeding Assay (PfSMFA) is the current gold standard mosquito based confirmatory transmission blocking (TrB) assay for human malaria. However, owing to its complexity only selected gametocytocidal molecules are progressed into SMFA. Predictive tools for evaluation of TrB behavior of compounds in SMFA would be extremely beneficial, but lack of substantially large data sets from many mosquito feeds preempts the ability to perform correlations between outcomes from in vitro assays and SMFA. Here, a total of 44 different anti-malarial compounds were screened for inhibitory effect on male gamete formation in exflagellation inhibition assay (EIA) and the same drug-treated parasites were fed to mosquitoes in SMFA. Regression analysis was performed between outcomes of the two assays and regression models were applied to a randomly selected validation set of four compounds indicating no overfitting and good predictive power. In addition, the pIC50 for 11 different compounds obtained in the EIA was also correlated with pIC50's in SMFA. Resulting regression models provided pIC50 predictions in SMFA with reasonably good accuracy thereby demonstrating the use of a simple in vitro assay to predict TrB of molecules in a complex mosquito based assay.


Conflict of interest statement

The authors declare no competing interests.

Figures

Figure 1
Figure 1
Relationship between EI and OR. Scatter plot of EI vs. OR (% of inhibition/reduction, see Eqs 1 and 2) for 40 compounds tested at different concentrations (total 131 data points and 14,882 fed mosquitoes). Each black dot represents an average measurement of one compound at one concentration, while each compound was screened either at a single concentration or up to eight different concentrations in both EIA and SMFA as described in Supplementary Table 1. Each point is the average of up to three repetitions of EIA and SMFA, with bars corresponding to standard errors. Best-fit is displayed as a black line (Eq. 4) together with the 95% confidence bands (dark grey shaded area around the curve) obtained through Monte Carlo simulations including both EI and OR errors.
Figure 2
Figure 2
ROC curves of OR classification with EI. Empirical ROC curves for OR binary classification at moving cutoffs of EI. Curves are shown for binarization cutoffs for OR of 20 (red), 50 (green), and 80 (blue).
Figure 3
Figure 3
Prediction of OR. Experimental vs. predicted OR for external set (4 compounds, 17 data points and 1747 fed mosquitoes). Predictions were obtained using Eq. 4. Diagonal line is shown in black, corresponding to perfect prediction.
Figure 4
Figure 4
Relationship between OR and BIT. Scatter plot of OR vs. BIT for the 40 different compounds and concentrations as described in Fig. 1. Each point is the average of up to three repetitions of SMFA with a total of 14,882 fed mosquitoes, with error bars corresponding to standard errors.
Figure 5
Figure 5
Relationship between EI and BIT. Scatter plot of EI vs. BIT for the compounds and concentrations as in Fig. 1. Each point is the average of up to three repetitions, with error bars corresponding to standard errors. Best-fit line is displayed as a black line (Eq. 5) together with the confidence bands (dark grey) obtained through Monte Carlo simulations including both EI and BIT errors.
Figure 6
Figure 6
ROC curves of BIT classification with EI. Empirical ROC curves for BIT binary classification at moving cutoffs of EI. Curves are shown for binarization cutoffs for BIT of 20 (red), 50 (green), and 80 (blue).
Figure 7
Figure 7
Prediction of BIT. Experimental vs predicted BIT for external set (4 compounds, 17 data points). Predictions were obtained with Eq. 5. Diagonal line is shown in black, corresponding to perfect prediction.
Figure 8
Figure 8
Relationship between EI pIC50 and OR pIC50. Scatter plot of EI pIC50 vs. OR pIC50 for 11 compounds with a total of 5761 fed mosquitoes. Each point is the mean of up to four EIA’s and SMFA’s, with error bars corresponding to the standard errors. Best-fit line (Eq. 6) is shown in black; 95% confidence bands including both pIC50-EI and pIC50-OR errors are included in dark grey.
Figure 9
Figure 9
Relationship between EI pIC50 and BIT pIC50. Scatter plot of EI pIC50 vs. BIT pIC50 for 11 compounds. Each point is the mean of up to four measurements, with error bars corresponding to the standard errors. Best-fit line (Eq. 7) is shown in black; confidence bands including both EI and BIT pIC50 errors are included in dark grey.

References

    1. World Malaria Report (WHO, 2017).
    1. World Malaria Report (WHO, 2016).
    1. A research agenda for malaria eradication: drugs. PLoS medicine8, e1000402, 10.1371/journal.pmed.1000402 (2011). - PMC - PubMed
    1. Alonso PL, et al. A research agenda to underpin malaria eradication. PLoS medicine. 2011;8:e1000406. doi: 10.1371/journal.pmed.1000406. - DOI - PMC - PubMed
    1. Burrows, J. N. et al. New developments in anti-malarial target candidate and product profiles. Malaria Journal16, 10.1186/s12936-016-1675-x (2017). - PMC - PubMed

Publication types

LinkOut - more resources