. 2018 May 17;9(1):1978.
doi: 10.1038/s41467-018-04383-6.

Distinct epigenetic landscapes underlie the pathobiology of pancreatic cancer subtypes

Affiliations

Distinct epigenetic landscapes underlie the pathobiology of pancreatic cancer subtypes

Gwen Lomberk et al. Nat Commun. .

Abstract

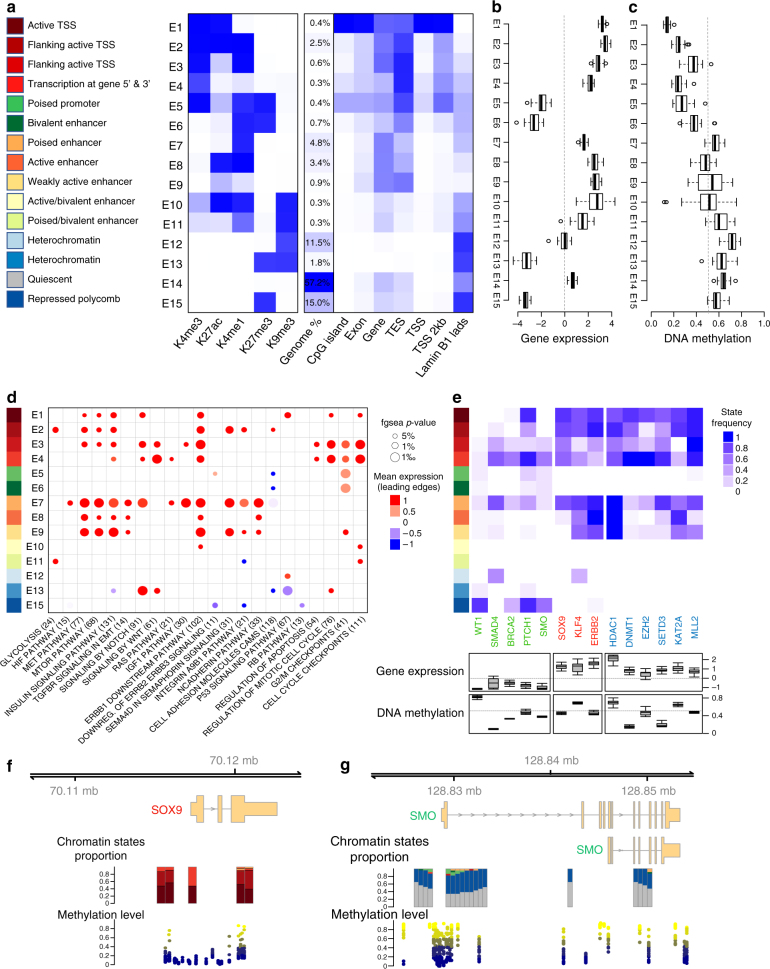
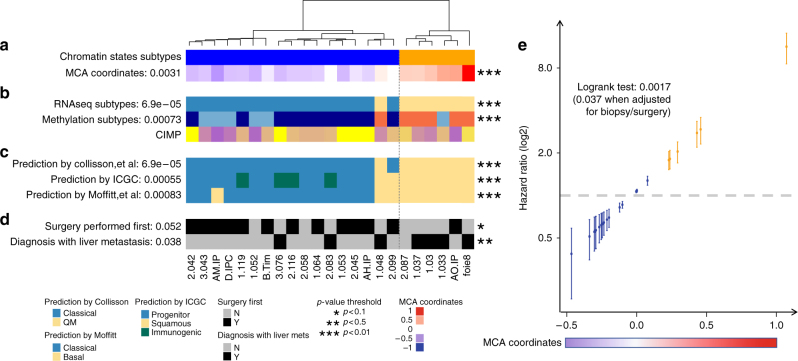
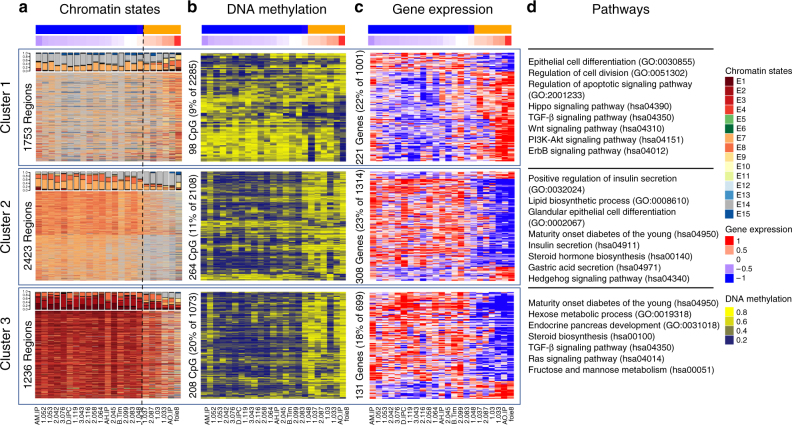
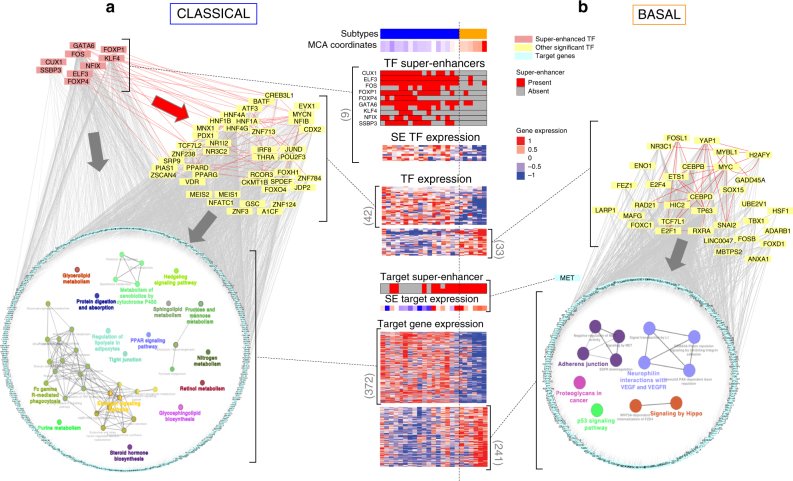
Recent studies have offered ample insight into genome-wide expression patterns to define pancreatic ductal adenocarcinoma (PDAC) subtypes, although there remains a lack of knowledge regarding the underlying epigenomics of PDAC. Here we perform multi-parametric integrative analyses of chromatin immunoprecipitation-sequencing (ChIP-seq) on multiple histone modifications, RNA-sequencing (RNA-seq), and DNA methylation to define epigenomic landscapes for PDAC subtypes, which can predict their relative aggressiveness and survival. Moreover, we describe the state of promoters, enhancers, super-enhancers, euchromatic, and heterochromatic regions for each subtype. Further analyses indicate that the distinct epigenomic landscapes are regulated by different membrane-to-nucleus pathways. Inactivation of a basal-specific super-enhancer associated pathway reveals the existence of plasticity between subtypes. Thus, our study provides new insight into the epigenetic landscapes associated with the heterogeneity of PDAC, thereby increasing our mechanistic understanding of this disease, as well as offering potential new markers and therapeutic targets.


Conflict of interest statement

The authors declare no competing interests.

Figures

Fig. 1
Fig. 1
Distinct chromatin states of human PDAC PDTXs. a Chromatin state definitions and histone mark probabilities as determined by ChromHMM. Average genome coverage. Genomic annotation enrichments for each chromatin state as calculated by ChromHMM. b Boxplots illustrate sample centered averaged gene expression of genes within regions of particular chromatin states based on RNA-seq data. c Boxplots depict sample-averaged level of DNA methylation for the overlapping CpGs with each chromatin state. Dotted line represents mean methylation cut-off (0.5). d Gene-set enrichment analysis (GSEA) pathways for each chromatin state. Circle size is proportional to − log10 p-value (showing only p-value < 5%) and colors correspond to the mean normalized expression of the genes driving the enrichment, or leading-edge genes. e Heatmap of the frequency of each state among all samples for tumor suppressors (green labels), pro-tumorigenic genes (red labels), and epigenetic regulators (blue labels). Boxplots of gene expression and methylation level are shown for each gene. f,g Visualization of chromatin state proportions on all samples and methylation levels across the SOX9 locus and the SMO locus. Stacked bars represent the proportion of each chromatin state at a given genomic position. Methylation level is represented for each sample, at each genomic position and colored by its value. For all boxplots (b,c,e), bottom and top of boxes are the first and third quartiles of the data, respectively, and whiskers represent the lowest (respectively highest) data point still within 1.5 interquartile range of the lower (respectively upper) quartile. Center line represents the median value
Fig. 2
Fig. 2
Epigenomic landscapes predict patient outcomes. a Chromatin state-based clustering using epigenetic regions associated with the second MCA component demonstrates two subtypes. Sample coordinates in this dimension and Student’s t-test p-value of the association with chromatin state-based clustering are indicated. b Clustering of RNA-seq and DNA methylation data into subtypes is shown by distinct colors and plotted according to chromatin state-based clustering from a. p-values of Fisher’s exact test demonstrate the association with chromatin state-based clustering. CIMP, CpG Island Methylator Phenotype calculated as the mean of island-CpG methylation level. c Prediction of PDAC subtypes using transcriptome-based publically available signatures, . d Clinical characteristics of PDAC samples based on status of surgical resection and presence of liver metastasis at diagnosis and p-values of Fisher’s exact test are indicated to show the association of clinical data with the chromatin state-based clustering. e Hazard Ratio (log2) estimated by a Cox model to demonstrate risk of death is shown along the MCA dimension. Dots are colored according to the chromatin state-based sample subtypes as defined in a
Fig. 3
Fig. 3
Epigenomic landscapes suggest pathobiological mechanisms. a Heatmap representing chromatin states for the regions associated with the second MCA dimension has been divided into three clusters of loci with differential epigenomic landscapes. Bar plots indicating proportion of chromatin states per sample are shown on the top of each cluster, based on the color code provided in Fig. 1a. b Blue-yellow heatmap of DNA methylation for nearby CpGs located < 1 kb upstream from regions shown in relation to the MCA coordinates (mad > 0.2 and p-value < 0.05, ANOVA test). c Blue-red heatmap of gene expression for nearby genes (mainly active TSS and mainly active enhancer regions located at < 20 kb and < 100 kb upstream from TSS, respectively) shown in relation to the MCA coordinates (mad > 0.2 and p-value < 0.05, ANOVA Test). d Pathways found to be significantly altered (p-value < 0.05, Fisher’s exact test) in each cluster as determined by specific epigenomic landscapes. Pathway definitions originate from the GO or KEGG database
Fig. 4
Fig. 4
Transcriptional regulatory networks for PDAC phenotypes. TFs found to be significant regulators of the a classical- and b basal-associated genes were used to reconstruct regulatory networks. Networks include TFs upregulated by super-enhancers (upper-left light red nodes in a only), significant TFs (yellow), and their targets arranged in a circular layout. In each circle, cellular pathways and functions over-represented among the target genes of each network (classical a, basal b) are shown and grouped by gene-set similarity. In the center of a and b, the heatmaps of TF expression and their targets, as well as the heatmaps of super-enhancers are represented. Red arrow corresponds to TF–TF regulation, and gray arrows to TF–nonTF target regulations
Fig. 5
Fig. 5
Epigenetic model for the tumor phenotype and its validation. a Genes that are in a box with red ribbon correspond to genes having an associated Super-enhancer. Yellow flash corresponds to genetic alterations. b Diagram is shown of the design for validating the model through inhibition of MET by siRNA to test the potential conversion of a basal to classical cellular phenotype. c PCA based on the differentially expressed genes from RNA-seq on basal siMET and basal control (scramble siRNA) samples. Basal samples were used as active individuals in the PCA construction, whereas the pure classical sample was projected on the two first dimensions. d GSEA plot is shown for GATA6 targets with vertical black lines corresponding to GATA6 putative targets ordered by their statistical tests of the differential analysis between siMET vs. control in basal samples. The curve illustrates the running enrichment score for the gene set ranked by the difference between the cohorts, showing global upregulation of GATA6 targets in the siMET condition. e GSEA plot for cell cycle is shown with vertical black lines corresponding to cell cycle genes (mitotic cell cycle, Reactome) ordered by their statistical tests of the differential analysis comparing siMET vs. control in basal samples. Green curve represents the running enrichment score for this gene set across the ranked list, which demonstrates global downregulation of those genes in the siMET condition

References

    1. Rahib L, et al. Projecting Cancer Incidence and Deaths to 2030: the unexpected burden of thyroid, liver, and pancreas cancers in the United States. Cancer Res. 2014;74:2913. doi: 10.1158/0008-5472.CAN-14-0155. - DOI - PubMed
    1. Hruban RH, Goggins M, Parsons J, Kern SE. Progression model for pancreatic cancer. Clin. Cancer Res. 2000;6:2969. - PubMed
    1. Lomberk GA, Urrutia R. The triple code model for pancreatic cancer: crosstalk among genetics, epigenetics, and nuclear structure. Surg. Clin. North. Am. 2015;95:935–952. doi: 10.1016/j.suc.2015.05.011. - DOI - PMC - PubMed
    1. Bailey P, et al. Genomic analyses identify molecular subtypes of pancreatic cancer. Nature. 2016;531:47–52. doi: 10.1038/nature16965. - DOI - PubMed
    1. Roadmap Epigenomics C, et al. Integrative analysis of 111 reference human epigenomes. Nature. 2015;518:317–330. doi: 10.1038/nature14248. - DOI - PMC - PubMed

Publication types

MeSH terms