. 2018 May 17;8(1):7766.
doi: 10.1038/s41598-018-25635-x.

Perlecan, a heparan sulfate proteoglycan, regulates systemic metabolism with dynamic changes in adipose tissue and skeletal muscle

Affiliations

Perlecan, a heparan sulfate proteoglycan, regulates systemic metabolism with dynamic changes in adipose tissue and skeletal muscle

Yuri Yamashita et al. Sci Rep. .

Abstract

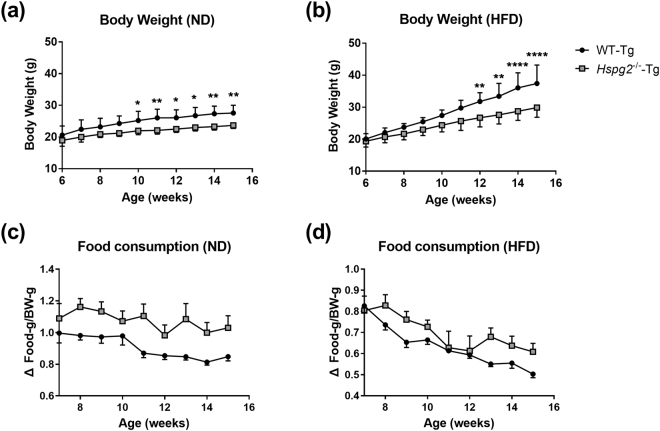
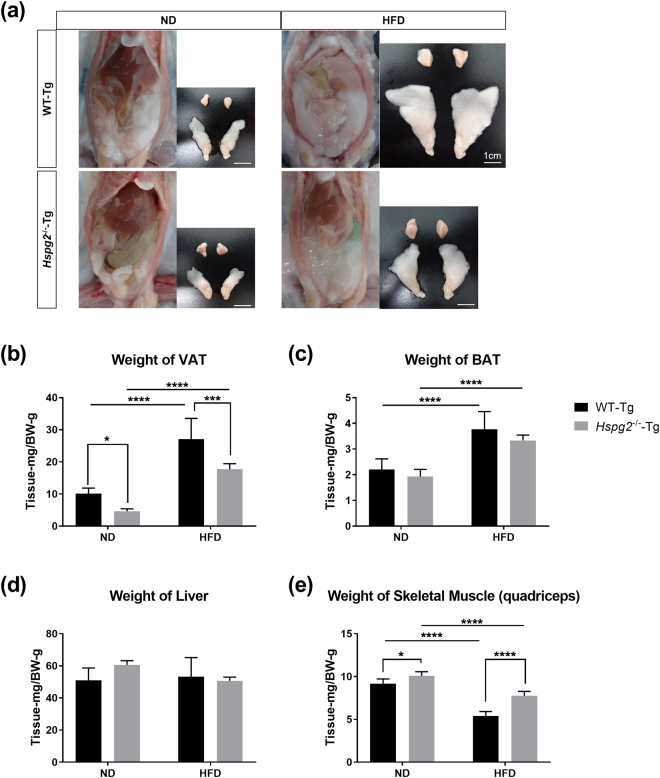
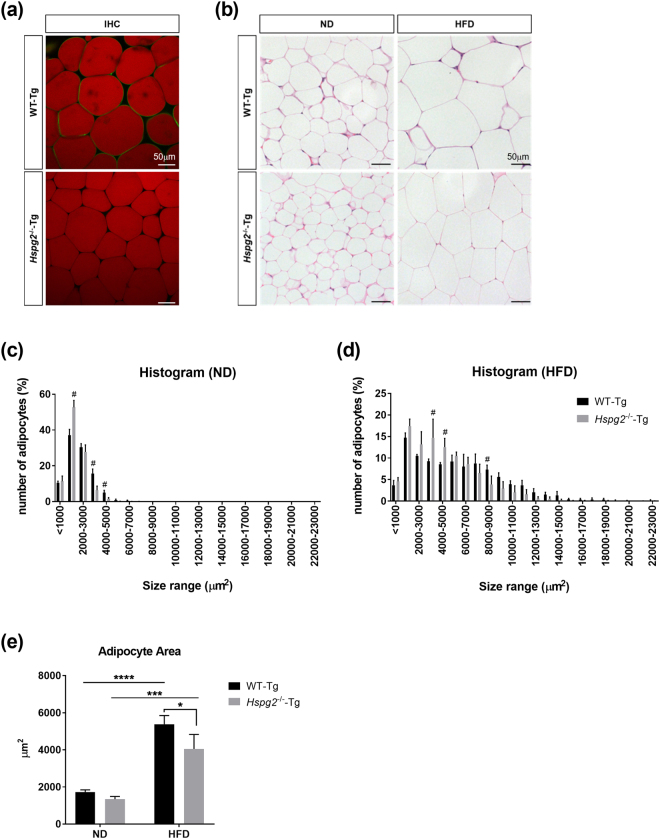
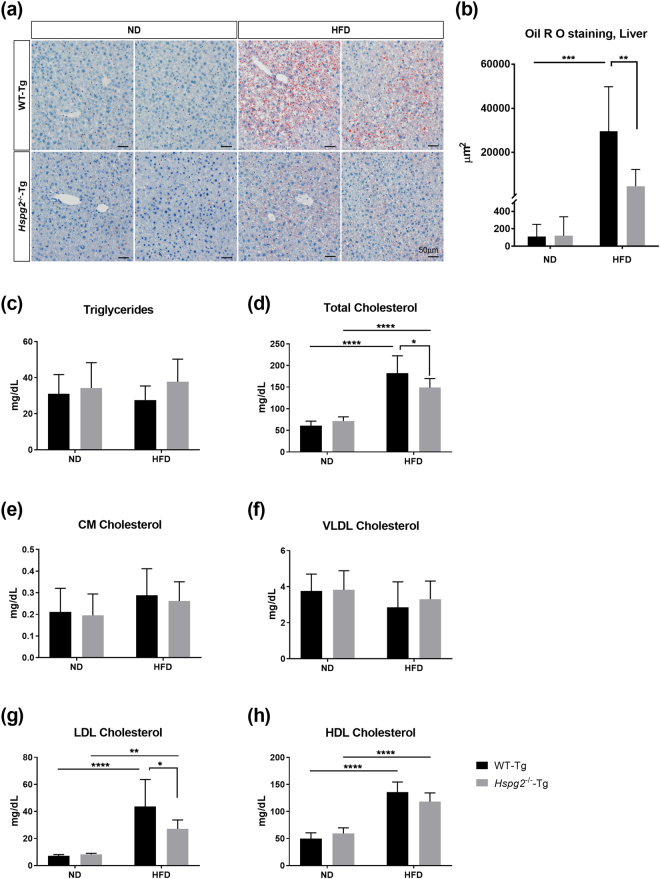
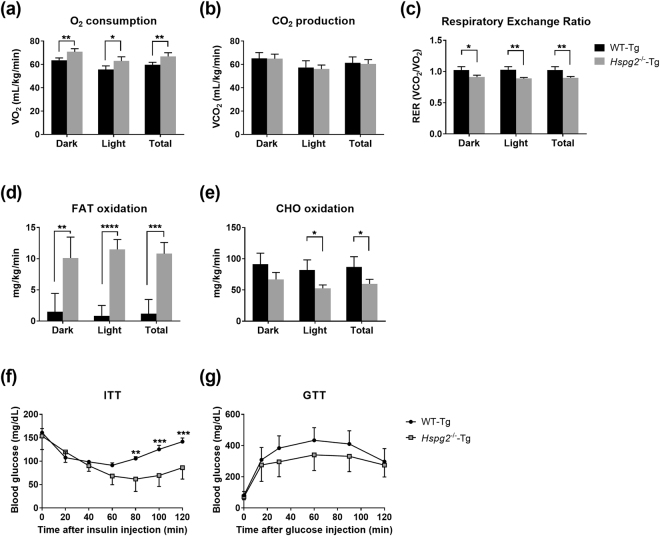
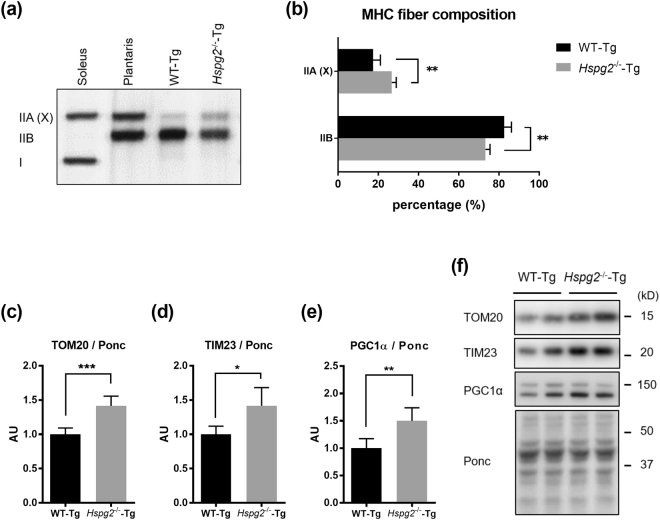
Perlecan (HSPG2), a heparan sulfate proteoglycan, is a component of basement membranes and participates in a variety of biological activities. Here, we show physiological roles of perlecan in both obesity and the onset of metabolic syndrome. The perinatal lethality-rescued perlecan knockout (Hspg2-/--Tg) mice showed a smaller mass and cell size of white adipose tissues than control (WT-Tg) mice. Abnormal lipid deposition, such as fatty liver, was not detected in the Hspg2-/--Tg mice, and those mice also consumed more fat as an energy source, likely due to their activated fatty acid oxidation. In addition, the Hspg2-/--Tg mice demonstrated increased insulin sensitivity. Molecular analysis revealed the significantly relatively increased amount of the muscle fiber type IIA (X) isoform and a larger quantity of mitochondria in the skeletal muscle of Hspg2-/--Tg mice. Furthermore, the perlecan-deficient skeletal muscle also had elevated levels of peroxisome proliferator-activated receptor gamma coactivator 1-alpha (PGC1α) protein. PGC1α expression is activated by exercise, and induces mitochondrial biosynthesis. Thus, perlecan may act as a mechano-regulator of catabolism of both lipids and glucose by shifting the muscle fiber composition to oxidative fibers. Our data suggest that downregulation of perlecan is a promising strategy to control metabolic syndrome.


Conflict of interest statement

The authors declare no competing interests.

Figures

Figure 1
Figure 1
Hspg2−/−-Tg mice are resistant to obesity. (a,b) Body weight change of perinatal lethality-rescued perlecan knockout (Hspg2−/−-Tg, gray square) and control (WT-Tg, black circle) mice under (a) normal diet (ND) and (b) high fat diet (HFD) conditions. Body weight was monitored in the mice aged 6 to 16 weeks (mean ± S.D., n = 7). (c,d) Food consumption by WT-Tg and Hspg2−/−-Tg mice under (c) ND and (d) HFD conditions. The average consumption by 1 to 3 mice reared in the same animal cage represents food consumption per mouse (mean ± S.D., n = 4–6 cages). Data were analyzed by two-way ANOVA with Sidak’s multiple comparison. *p < 0.05, **p < 0.01, ****p < 0.0001.
Figure 2
Figure 2
The mass of white adipose tissue is reduced in Hspg2−/−-Tg mice. (a) Macroscopic images of visceral fat deposition and adipose tissues of the WT-Tg (upper panels) and the Hspg2−/−-Tg (lower panels) mice at 16 weeks of age. The right-hand image of each panel represents brown adipose tissue (interscapular fats, upper row) and visceral adipose tissue (epididymal fats, bottom row). (b–e) Comparisons of tissue weight of (b) visceral adipose tissue (VAT), (c) brown adipose tissue (BAT), (d) liver, and (e) skeletal muscle (quadriceps) in mice at 16 weeks of age fed the different diets. Data points and error bars represent the mean ± S.D. (n = 7). Data were analyzed by two-way ANOVA with Tukey’s multiple comparison. *p < 0.05, ***p < 0.001, ****p < 0.0001. Scale bar, 1 cm.
Figure 3
Figure 3
Perlecan deficiency leads to a reduction in adipocyte size. (a) Immunofluorescence analysis (IFA) of perlecan in visceral adipose tissue (VAT). Note that perlecan (green) surrounded each adipocyte (red) of the WT-Tg mice, whereas perlecan was absent in that of the Hspg2−/−-Tg mice. (b) The VAT of the WT-Tg (upper panel) and Hspg2−/−-Tg (lower panel) mice fed with either a normal diet (ND) or a high-fat diet (HFD). A section was stained with hematoxylin-eosin. (c,d) A histogram of the size (μm2) of the individual adipocytes under (c) ND and (d) HFD conditions. (e) The average size of adipocytes (μm2). (c–e) 1,000 adipocytes per mouse were evaluated. Data points and error bars represent the mean ± S.D. (n = 3–4). Data were analyzed by two-way ANOVA with Sidak’s multiple comparison (c,d) and Tukey’s multiple comparison (e). #p < 0.05 including p < 0.0001, *p < 0.05, ***p < 0.001, ****p < 0.0001. Scale bar, 50  μm.
Figure 4
Figure 4
Perlecan deficiency does not affect cell turnover in white adipose tissue. (a) TUNEL staining in the VAT of the WT-Tg (upper panel) and the Hspg2−/−-Tg (lower panel) mice fed either ND or HFD. The areas containing positive nuclei of adipocytes are selected and shown. The positive control was made using DNase I. Note that TUNEL-positive nuclei are brown and negative nuclei are blue. (b) The percentage of TUNEL-positive nuclei of adipocytes. The nuclei from at least 100 adipocytes per mouse were evaluated. Data points and error bars represent the mean ± S.D. (n = 5). (c) Representative immunohistochemical staining of Ki67 in the VAT of the WT-Tg (upper panel) and the Hspg2−/−-Tg (lower panel) mice fed either ND or HFD. The tissue from human abdominal cancer was used as positive control. No nuclei were positive for Ki67 in any groups. Data were analyzed by two-way ANOVA with Tukey’s multiple comparison (b). Scale bar, 50  μm.
Figure 5
Figure 5
Perlecan deficiency is resistant to abnormal lipid deposition. (a) Histological analysis of lipid deposition in the livers of the WT-Tg (upper panel) and Hspg2−/−-Tg (lower panel) mice fed either a normal diet (ND) or a high fat diet (HFD). A section was stained with Oil Red O for detection of lipids and with hematoxylin for counterstaining. Two representative images are shown for each experimental condition. (b) The differences in the lipid deposition between the WT-Tg and the Hspg2−/−-Tg mice fed the ND and HFD. Areas (μm2) of deposited lipids per image with same magnification were calculated using ImageJ software. Sixteen-week-old mice were used in the experiments. Data points and error bars represent the mean ± S.D. (n = 7). (ch) Levels (mg/dL) of plasma (c) triglycerides, (d) total cholesterol, (e) chylomicron (CM) cholesterol, (f) very low density lipoprotein (VLDL) cholesterol, (g) low density lipoprotein (LDL) cholesterol, and (h) high density lipoprotein (HDL) cholesterol in the 16-week-old mice after fasting for 4 h (mean ± S.D., n = 8). Data were analyzed by two-way ANOVA with Tukey’s multiple comparison. *p < 0.05, **p < 0.01, ***p < 0.001, ****p < 0.0001. Scale bar, 50  μm.
Figure 6
Figure 6
Anti-obesity effects in Hspg2−/−-Tg mice depend on increased FAT oxidation. (ae) Indirect calorimetry for (a) oxygen (O2) consumption, (b) CO2 production, (c) respiratory exchange ratio, (d) FAT oxidation, and (e) carbohydrate (CHO) oxidation. Data were collected every 2.5 min for 24 h and represent the mean ± S.D. (n = 4) during 6 h light/6 h dark periods. (f,g) Changes in plasma glucose levels by (f) the insulin tolerance test (ITT) and (g) the glucose tolerance test (GTT). Data points and error bars represent the mean ± S.D. (n = 4–7). Data were analyzed by the unpaired t-test (ae) and two-way ANOVA with Sidak’s multiple comparison (f,g). *p < 0.05, **p < 0.01, ***p < 0.001, ****p < 0.0001.
Figure 7
Figure 7
Loss of perlecan modifies the composition of myosin heavy chains by activating PGC1α. Detection by (a) SDS-PAGE-coupled silver staining and (b) relative composition of myosin heavy chain isoforms in the quadriceps of the WT-Tg and Hspg2−/−-Tg mice. Soleus and plantaris represent markers for type I and II fibers, respectively. The relative intensity of the bands was quantified using ImageJ software. (c–e) Protein expression levels of (c) translocase of outer membrane 20 (TOM20), (d) translocase of inner membrane 23 (TIM23), and (e) peroxisome proliferator-activated receptor gamma coactivator 1-alpha (PGC1α) in the quadriceps of the WT-Tg and Hspg2−/−-Tg mice. (f) Representative images of proteins extracted from quadriceps and stained with Ponceau S (Ponc) after SDS-PAGE. The relative intensities of the respective bands detected by western blotting using the specific antibody to the Ponc-stained patterns were quantified using ImageJ software. Data points and error bars represent the mean ± S.D. (n = 5 in a and b; n = 5–6 in ce). Data were analyzed by two-way ANOVA with Sidak’s multiple comparison (b) and unpaired t-test (ce). *p < 0.05, **p < 0.01, ***p < 0.001.

References

    1. Cornier MA, et al. The metabolic syndrome. Endocr Rev. 2008;29:777–822. doi: 10.1210/er.2008-0024. - DOI - PMC - PubMed
    1. Grundy SM, et al. Diagnosis and management of the metabolic syndrome: an American Heart Association/National Heart, Lung, and Blood Institute Scientific Statement. Circulation. 2005;112:2735–2752. doi: 10.1161/CIRCULATIONAHA.105.169404. - DOI - PubMed
    1. Eckel RH, Grundy SM, Zimmet PZ. The metabolic syndrome. The Lancet. 2005;365:1415–1428. doi: 10.1016/S0140-6736(05)66378-7. - DOI - PubMed
    1. Bays HE, et al. Obesity, adiposity, and dyslipidemia: a consensus statement from the National Lipid Association. J Clin Lipidol. 2013;7:304–383. doi: 10.1016/j.jacl.2013.04.001. - DOI - PubMed
    1. Kershaw EE, Flier JS. Adipose tissue as an endocrine organ. J Clin Endocrinol Metab. 2004;89:2548–2556. doi: 10.1210/jc.2004-0395. - DOI - PubMed

Publication types

MeSH terms

LinkOut - more resources