. 2018 Aug;37(35):4854-4870.
doi: 10.1038/s41388-018-0296-y. Epub 2018 May 18.

NEDD9 promotes oncogenic signaling, a stem/mesenchymal gene signature, and aggressive ovarian cancer growth in mice

Affiliations

NEDD9 promotes oncogenic signaling, a stem/mesenchymal gene signature, and aggressive ovarian cancer growth in mice

Rashid Gabbasov et al. Oncogene. 2018 Aug.

Abstract

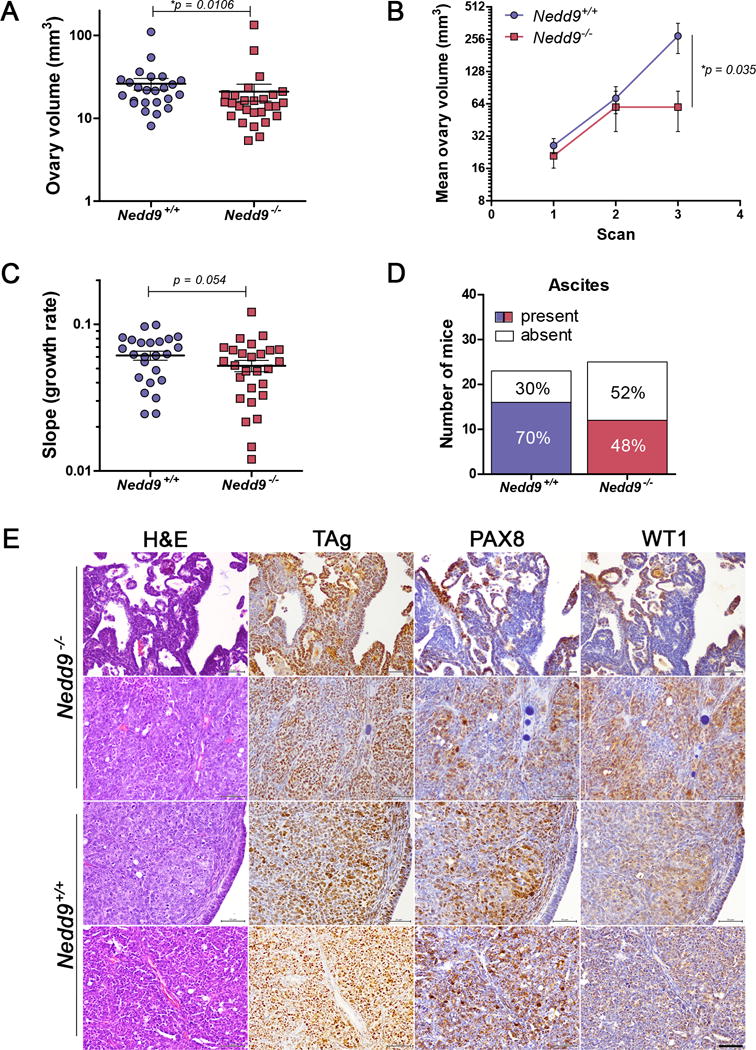
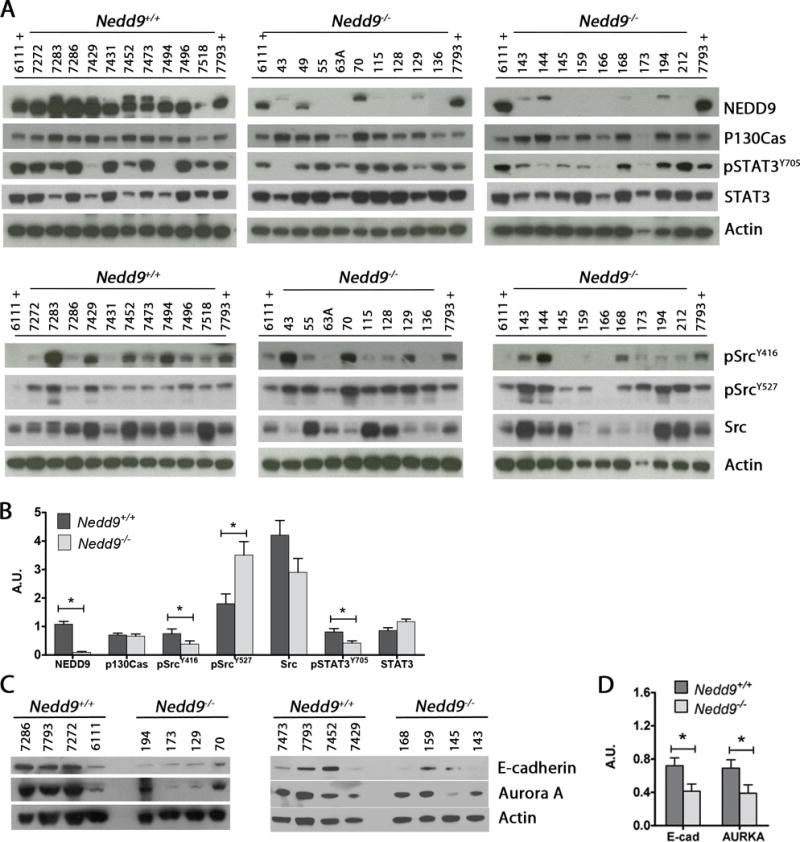
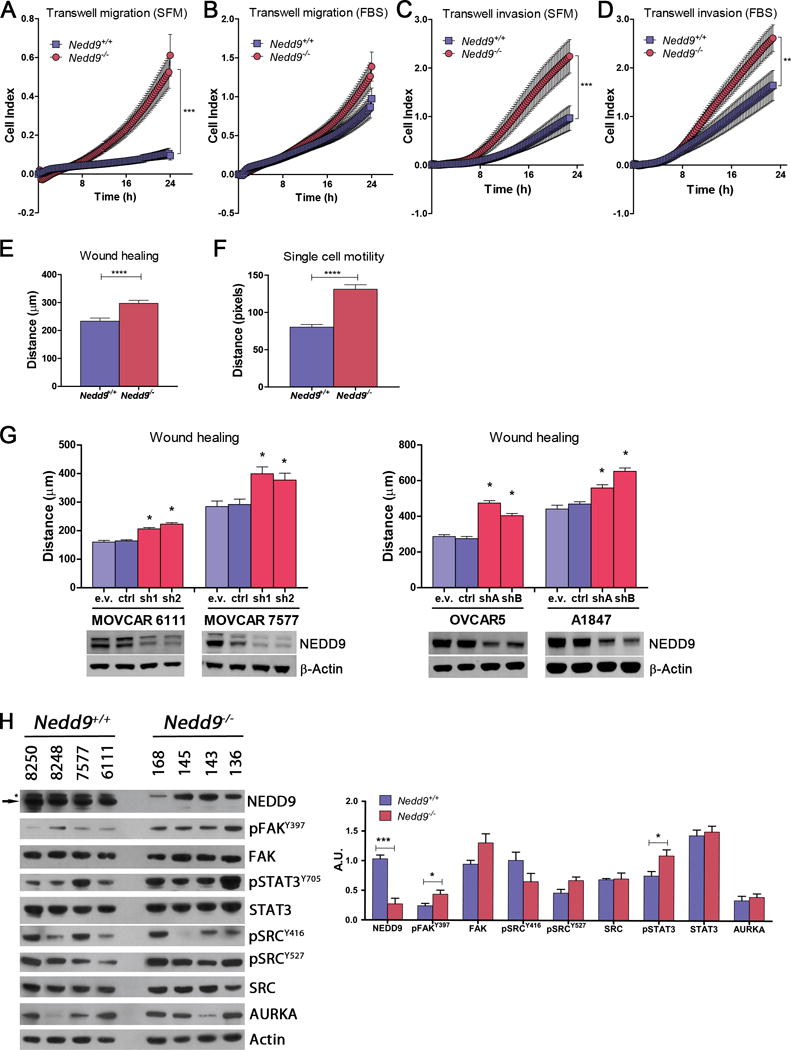
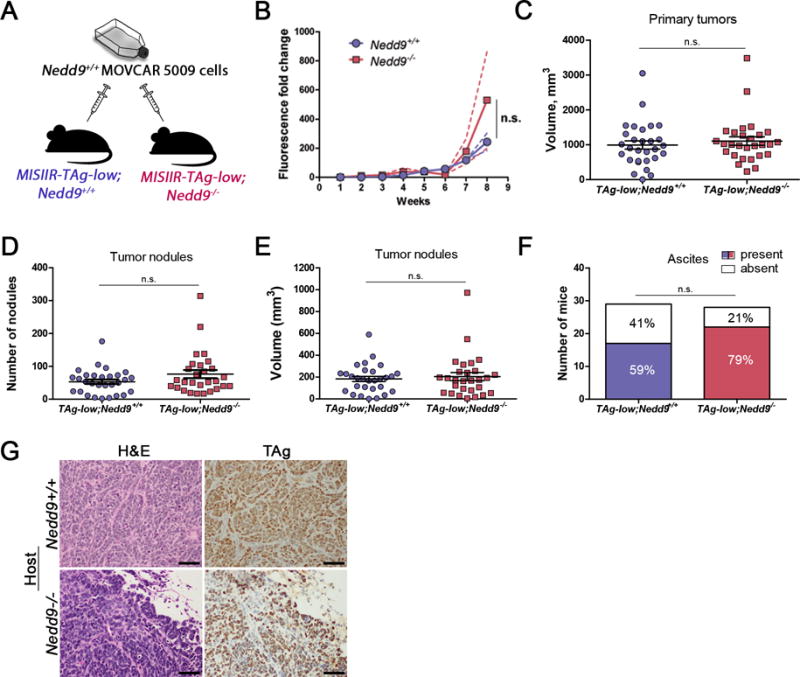
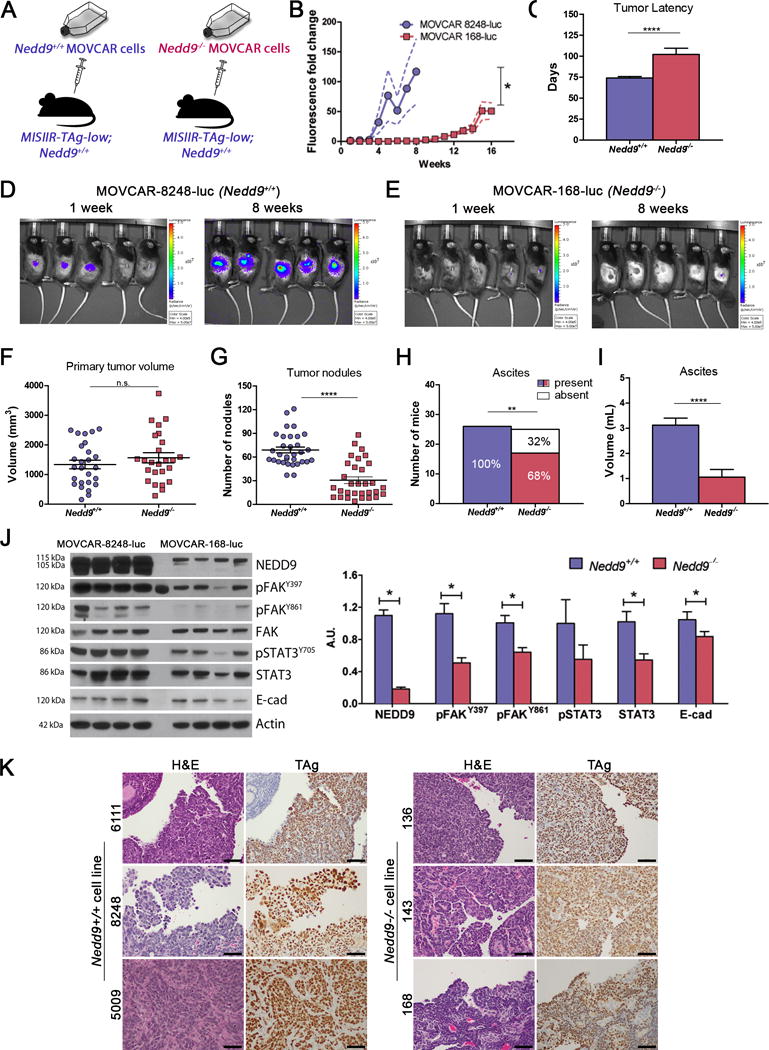
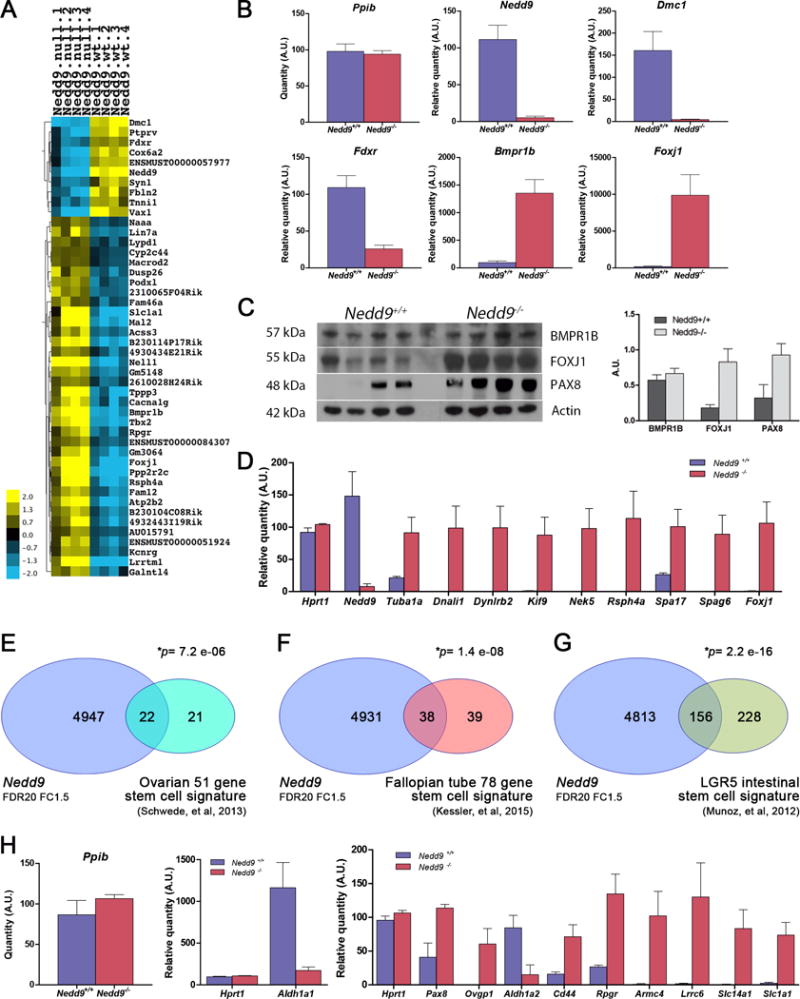
Neural precursor cell expressed, developmentally downregulated 9 (NEDD9) supports oncogenic signaling in a number of solid and hematologic tumors. Little is known about the role of NEDD9 in ovarian carcinoma (OC), but available data suggest elevated mRNA and protein expression in advanced stage high-grade cancers. We used a transgenic MISIIR-TAg mouse OC model combined with genetic ablation of Nedd9 to investigate its action in the development and progression of OC. A Nedd9-/- genotype delayed tumor growth rate, reduced incidence of ascites, and reduced expression and activation of signaling proteins including SRC, STAT3, E-cadherin, and AURKA. Cell lines established from MISIIR-TAg;Nedd9-/- and MISIIR-TAg;Nedd9+/+ mice exhibited altered migration and invasion. Growth of these cells in a syngeneic allograft model indicated that systemic Nedd9 loss in the microenvironment had little impact on tumor allograft growth, but in a Nedd9 wild-type background Nedd9-/- allografts exhibited significantly reduced growth, dissemination, and oncogenic signaling compared to Nedd9+/+ allografts. Gene expression analysis revealed that Nedd9+/+ tumors exhibited more mesenchymal "stem-like" transcriptional program, including increased expression of Aldh1a1 and Aldh1a2. Conversely, loss of Nedd9 resulted in increased expression of differentiation genes, including fallopian tube markers Foxj1, Ovgp1, and Pax8. Collectively, these data suggest that tumor cell-intrinsic Nedd9 expression promotes OC development and progression by broad induction of oncogenic protein signaling and stem/mesenchymal gene expression.


Conflict of interest statement

Conflicts of interest: The authors have no conflicts of interest to declare.

Figures

Figure 1
Figure 1. Spontaneous ovarian tumor growth in MISIIR-TAg;Nedd9+/+ and MISIIR-TAg;Nedd9−/− transgenic mice
A) Initial ovarian tumor volume determined in baseline MRI scans of age matched female MISIIR-TAg;Nedd9+/+ (n=24, average age 80.96 days) and MISIIR-TAg;Nedd9−/− (n=27, average age 79.3 days) mice shows mean tumor volume is lower in MISIIR-TAg;Nedd9−/− mice. The numbers of randomly selected mice for each genotype were based on the known variability of the spontaneous tumor induction and latency of the MISIIR-TAg model. B) Tumor volumes calculated from the first three consecutive MRI datasets, when all mice in both cohorts were alive and of comparable mean age at each scan. By the third scan, MISIIR-TAg;Nedd9−/− mice show significantly decreased mean log-transformed tumor volume compared to MISIIR-TAg;Nedd9+/+ mice at comparable ages (n=24, average age 111.9 days vs. n=27 mice, average age 109.7 days). C) Longitudinal MRI datasets from all MISIIR-TAg;Nedd9+/+ (n=24) and MISIIR-TAg;Nedd9−/− (n=27) mice were used to determine the ovarian tumor volume at each scan for all mice on study. The growth rate (log-transformed growth slope) was calculated for each individual mouse and showed a delay in MISIIR-TAg;Nedd9−/− mice (mean slope=0.0521) compared to MISIIR-TAg;Nedd9+/+ controls (mean slope=0.0612). D) The number of mice with ascites detected at necropsy was reduced in the MISIIR-TAg;Nedd9−/− compared to MISIIR-TAg;Nedd9+/+ mice. E) Ovarian tumors from MISIIR-TAg;Nedd9−/− and MISIIR-TAg;Nedd9+/+ mice collected at study endpoint and paraffin embedded sections were stained with H&E, TAg, PAX8 and WT1. Representative images from tissues isolated from MISIIR-TAg;Nedd9−/− mice #129 (163 days) and 195 (204 days) and MISIIR-TAg;Nedd9+/+ mice #7509 (135 days) and 7431 (181 days) are shown (scale bar=50μm). Ovarian volumes at baseline scans were analyzed by the nonparametric two-tailed Wilcoxon-Mann-Whitney test. Tumor volume data were analyzed using linear mixed-effects models with random intercepts to model longitudinal log-transformed volume data from the first three time points. Individual tumor growth rates throughout the study were analyzed by the two-tailed Wilcoxon signed-rank test. Results are shown as mean ± s.e.m. Investigators were blinded to the genotype of the mice for MRI imaging and analysis of tumor volume.
Figure 2
Figure 2. Expression and activation of oncogenic signaling in Nedd9 wild type and null ovarian tumors
A) Western blot analysis of snap frozen tumor tissue lysates shows the level of expression and/or activation of indicated oncogenic proteins. Samples labeled with ‘+’ are reference specimens loaded on all gels for cross comparison. B) Densitometric analysis of the representative immunoblot images to show NEDD9 (upper band on the NEDD9 blot is non-specific), Src, pSRC, STAT3, pSTAT3, E-Cadherin and AURKA levels relative to β-actin. Representative western blots from 3 experiments (arbitrary number of samples). Densitometric analysis was performed using Image J and analyzed by the nonparametric two-tailed Wilcoxon-Mann-Whitney test. Bars labeled with asterisks are statistically significant (*P<0.05) and results are summarized as mean ± s.e.m.
Figure 3
Figure 3. Effects of Nedd9 loss or depletion on in vitro migration and invasion of OC cells
Four independent MOVCAR cell lines established from Nedd9+/+ (MOVCAR-6111, -7577, -8248 and -8250) and Nedd9−/− (MOVCAR-136, -143, -145 and -168) tumor bearing mice were assayed for migration and invasion using transwell migration, transwell invasion, wound healing and single cell motility assays and the mean values are shown for each assay. A) Average transwell migration rate was significantly increased in Nedd9−/− cell lines in the absence serum (SFM). B) No significant differences in transwell migration were detected in the presence of serum. C-D) transwell invasion through matrigel was increased in Nedd9−/− cell lines in the absence (C) and presence (D) of serum. E-F) Wound closure (E) and single cell motility (F) was also significantly increased in Nedd9−/− cell lines. G) Depletion NEDD9 in murine (MOVCAR-6111 and -7577) or human (OVCAR-5 and A1847) ovarian carcinoma cell lines by RNA interference (RNAi) with two independent NEDD9 targeting short hairpin RNAs (shRNA) resulted in more rapid would closure. Depletion of NEDD9 was confirmed by western blotting with anti-NEDD9 antibody and anti-β-Actin antibody as a loading control. All assays were performed in triplicate, analyzed by the nonparametric two-tailed Wilcoxon-Mann-Whitney test and bars labeled with asterisks are statistically significant (*P<0.05, ***P<0.001, ****P<0.0001, n.s. = not significant). H) Expression of a number of proteins interacting with NEDD9 was assessed by Western blot analysis and demonstrated elevation of pFAKY397 and pSTAT3Y705 in Nedd9−/− MOVCAR cells. The anti-NEDD9 antibody recognizes the 105 kDa NEDD9 protein (indicated by the arrow) as well as a non-specific higher molecular weight band (115-120 kDa) that is indicated by an asterisk. Charts represent mean values ± s.e.m.
Figure 4
Figure 4. Loss of Nedd9 in the tumor microenvironment does not impact ovarian tumor growth or dissemination
A) Schematic showing the experimental approach to understand the role of NEDD9 expressed in tumor microenvironment on OC development and progression: Nedd9+/+ and Nedd9−/− MISIIR-TAg-low mice were used as hosts for orthotopic (intrabursal) Nedd9+/+ MOVCAR cell allografts. Investigators were not blinded to the genotype of the allograft host. B) Longitudinal bioluminescent imaging (BLI) did not reveal significant effect of Nedd9-status on tumor growth rates. C-F) Necropsy analysis of tumor allografts grown in MISIIR-TAg-low;Nedd9+/+ and MISIIR-TAg-low;Nedd9−/− hosts showed no significant differences in volume of the primary tumor at the injection site (C) or the number (76.5 ± 12.4 versus 53.3 ± 6.7 tumor nodules) (D) or volume (E) of peritoneal tumor nodules or the incidence (F) of ascites detected. Three independent allograft implantation experiments were performed (n=29 MISIIR-TAg-low;Nedd9+/+ mice and n=28 MISIIR-TAg-low;Nedd9−/− mice in total) and results were analyzed by the nonparametric two-tailed Wilcoxon-Mann-Whitney test for significance. MISIIR-TAg-low;Nedd9+/+ and MISIIR-TAg-low;Nedd9−/− hosts mice were randomly selected for allograft implantation. Charts represent mean values ± s.e.m. G) H&E and TAg stained sections of MOVCAR-5009 allografts grown in Nedd9+/+ and Nedd9−/− MISIIR-TAg-low hosts (scale bar=50μm).
Figure 5
Figure 5. Loss of Nedd9 in MOVCAR cells impairs OC dissemination
A) Schematic showing the experimental approach to confirm the tumor cell intrinsic role of NEDD9 on OC development and progression: MISIIR-TAg-low;Nedd9+/+ mice selected at random were used as hosts for orthotopic (intrabursal) Nedd9+/+ (MOVCAR-5009, -6111 and -8248) or Nedd9−/− (MOVCAR-136, -143 and -168) cell allografts. Investigators were not blinded to group identity. B) Growth of allografts monitored by weekly BLI showing delayed growth in MOVCAR 168-luc (Nedd9−/−) compared to MOVCAR-8248-luc (Nedd9+/+) allografts. C) Mice were sacrificed when they met humane criteria for euthanasia and showed significantly increased tumor latency of Nedd9−/− allografts compared to Nedd9+/+ allografts (102.2± 7.4 days versus 74.0 ± 1.8 days for controls, p=0.0004). D-E) Representative BLI images showing of MOVCAR-8248 (Nedd9+/+) allografts (D) compared to MOVCAR-168 (Nedd9−/−) controls (E). F) Necropsy analysis of tumor allografts grown in MISIIR-TAg-low;Nedd9+/+ hosts showed no significant difference in primary tumor at the injection site. G) The Nedd9−/− allografts exhibited significantly reduced mean number of peritoneal tumor nodules (30.7 ± 4.2 versus 69.0 ± 3.7, p<0.0001), and H) the incidence (17/25 [68%] versus 26/26 [100%], p<0.01) and I) mean volume (1.06 ml versus 3.12 ml, p<0.0001) of ascites detected. J) Immunoblot analysis of tumor lysates confirmed loss of NEDD9 (upper band is non-specific) and decreased activation of oncogenic signaling proteins FAK, STAT3 and E-cadherin in Nedd9−/− allografts compared to Nedd9+/+ controls. The results represent three independent experiments employing three independent Nedd9+/+ and Nedd9−/− MOVCAR cell lines each (n=10 mice/group/experiment). Data were analyzed by the nonparametric two-tailed Wilcoxon-Mann-Whitney test for significance of tumor latency, tumor and ascites volume, and tumor nodules, and the ascites fraction by the Fisher exact 2-sided test (*P<0.05, **P<0.01, ***P<0.001, ****P<0.0001). Representative western blots from MOVCAR-8248 (Nedd9+/+) and MOVCAR-168 (Nedd9−/−) allograft tumors. Densitometric analysis was performed using Image J and analyzed by the nonparametric two-tailed Wilcoxon-Mann-Whitney test and bars labeled with asterisks are statistically significant (*P<0.05). Charts represent mean ± s.e.m. K) Representative H&E and TAg stained sections of allograft tumors from Nedd9+/+ and Nedd9−/− MOVCAR cells implanted into Nedd9+/+ MISIIR-TAg-low mice show similar morphology and TAg staining (scale bar=50μm).
Figure 6
Figure 6. Gene expression differences in Nedd9+/+ and Nedd9−/− tumors
Global gene expression profiles were determined by RNA microarray analysis of Nedd9+/+ and Nedd9−/− tumor specimens, validated by quantitative RT-PCR and compared with publically available data sets. Gene expression data are accessible through Gene Expression Omnibus accession number GSE106911. A) Heat map showing 10 downregulated and 36 upregulated RNA probes in tumors isolated from Nedd9−/− mice compared to Nedd9+/+ controls (2-fold change, p<0.001 and FDR=5). B) Validation of differential gene expression of Nedd9, Dmc1, Fdxr, Bmpr1b and Foxj1 genes in individual tumors by qRT-PCR with expression of Ppib used as a normalizer. C) Western blot detection of expression of BMPR1B, FOXJ1 and PAX8 proteins in individual tumors. D) Validation of upregulation of FOXJ1 target genes regulating ciliogenesis: Tuba1a, Dnali1, Dynlrb2, Kif9, Nek5, Rsph4a, Spa17, Spag6 and Foxj1 in individual Nedd9−/− tumors by qRT-PCR with expression of Ppib and Hprt1 used as normalizer genes. Overlap of differentially expressed genes in the murine Nedd9+/+ and Nedd9−/− gene expression datasets (FDR20, FC1.5) to a 51-gene stem cell-like gene signature in human OC (E), a 78-gene stem cell-associated gene signature in fallopian tube (F) and a 384 gene stem cell signature in LGR5+ cells in murine intestinal crypt (G). H) qRT-PCR validation of individual overlapping genes identified from the above datasets in Nedd9+/+ and Nedd9−/− tumors. Ppib and Hprt were used as normalizer genes for each qRT-PCR experiment. Charts represent mean values ± s.e.m.

Similar articles

Cited by

References

    1. Siegel RL, Miller KD, Jemal A. Cancer statistics, 2016. CA: A Cancer Journal for Clinicians. 2016;66(1):7–30. - PubMed
    1. Bowtell DD, Bohm S, Ahmed AA, Aspuria PJ, Bast RC, Jr, Beral V, et al. Rethinking ovarian cancer II: reducing mortality from high-grade serous ovarian cancer. Nat Rev Cancer. 2015;15(11):668–79. - PMC - PubMed
    1. McPherson A, Roth A, Laks E, Masud T, Bashashati A, Zhang AW, et al. Divergent modes of clonal spread and intraperitoneal mixing in high-grade serous ovarian cancer. Nat Genet. 2016;48(7):758–67. - PubMed
    1. TCGA. Integrated genomic analyses of ovarian carcinoma. Nature. 2011;474(7353):609–15. - PMC - PubMed
    1. Bonome T, Levine DA, Shih J, Randonovich M, Pise-Masison CA, Bogomolniy F, et al. A gene signature predicting for survival in suboptimally debulked patients with ovarian cancer. Cancer Res. 2008;68(13):5478–86. - PMC - PubMed

Publication types