

Why local air pollution is more than daily peaks: modelling policies in a city in order to avoid premature deaths
- PMID: 29773963
- PMCID: PMC5945742
- DOI: 10.1007/s10100-018-0534-y
Why local air pollution is more than daily peaks: modelling policies in a city in order to avoid premature deaths
Abstract
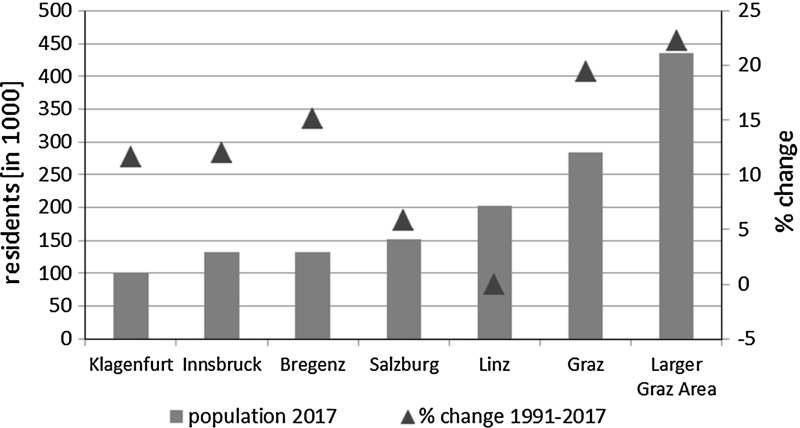
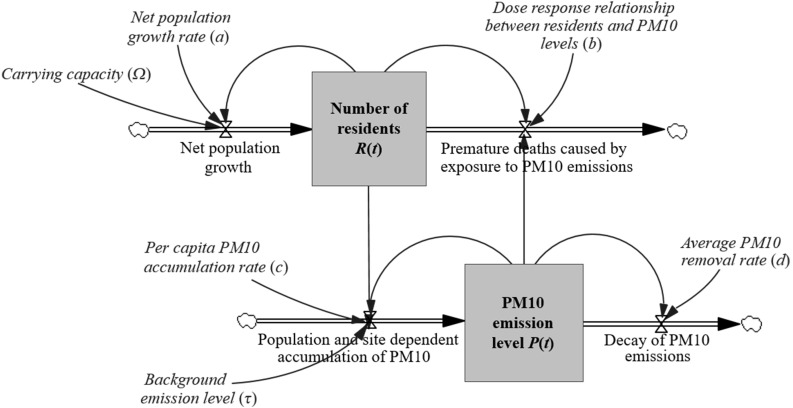
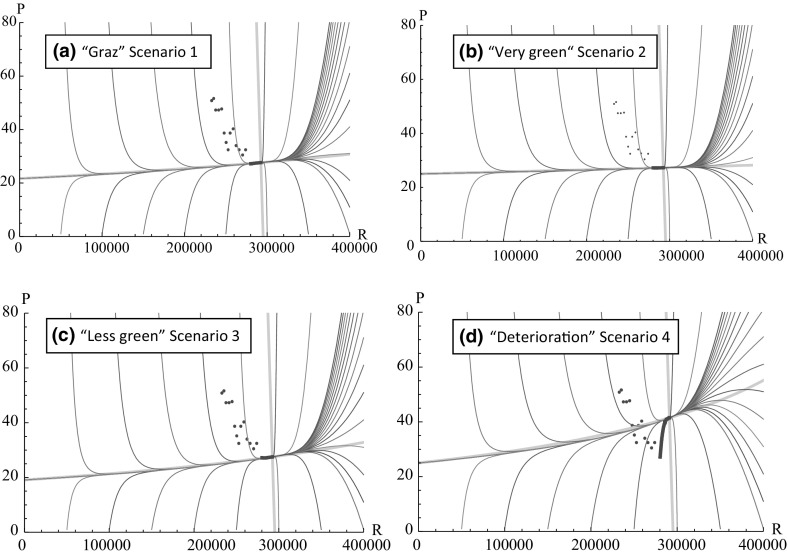
We use a predator-prey representation of an urban system to analyse how policy interventions can prevent the adverse effects of air pollution on people's health. The number of residents is treated as prey variable, and particulate matter that consists of particles with a diameter of up to 10 micrometres (PM10) as predator variable. This representation allows integration of population trends and the effects of environmental interventions on the average level of PM10 concentration (which establishes a baseline for the potential health burden for residents). For the case of Graz, Austria, we illustrate the insights generated regarding the interdependency of market-based and technological pollution controls, and propose an indicator that assesses the cost of delayed interventions by counting additional premature deaths caused by polluted environments.
Keywords: Air pollution; Environmental policy interventions; Predator–prey model.
Figures
References
-
- Andersen ZJ, Wahlin P, Raaschou-Nielsen O, Ketzel M, Scheike T, Loft S. Size distribution and total number concentration of ultrafine and accumulation mode particles and hospital admissions in children and elderly in Copenhagen. Occup Environ Med. 2008;65:458–466. doi: 10.1136/oem.2007.033290. - DOI - PubMed
-
- Baldauf RW, Thoma E, Hays M, Shores R, Kinsey J, Gullett B, Kimbrough S, Isakov V, Long T, Snow R, Khlystov A, Weinstein J, Chen F, Seila R, Olson D, Gilmour I, Cho S, Watkins N, Rowley P, Bang J. Traffic and meteorological impacts on near road air quality: summary of methods and trends from the Raleigh Near Road Study. J Air Waste Manag Assoc. 2008;58:865–878. doi: 10.3155/1047-3289.58.7.865. - DOI - PubMed
-
- Bamberg S, Fuiji S, Friman M, Gärling T. Behaviour theory and soft transport policy measures. Transp Policy. 2011;18:228–235. doi: 10.1016/j.tranpol.2010.08.006. - DOI
-
- Bannister D. The sustainable mobility paradigm. Transp Policy. 2007;15:73–80. doi: 10.1016/j.tranpol.2007.10.005. - DOI
LinkOut - more resources
Full Text Sources
Other Literature Sources