. 2018 Apr 9;8(10):2765-2781.
doi: 10.7150/thno.22904. eCollection 2018.

Placenta-specific drug delivery by trophoblast-targeted nanoparticles in mice

Affiliations

Placenta-specific drug delivery by trophoblast-targeted nanoparticles in mice

Baozhen Zhang et al. Theranostics. .

Abstract

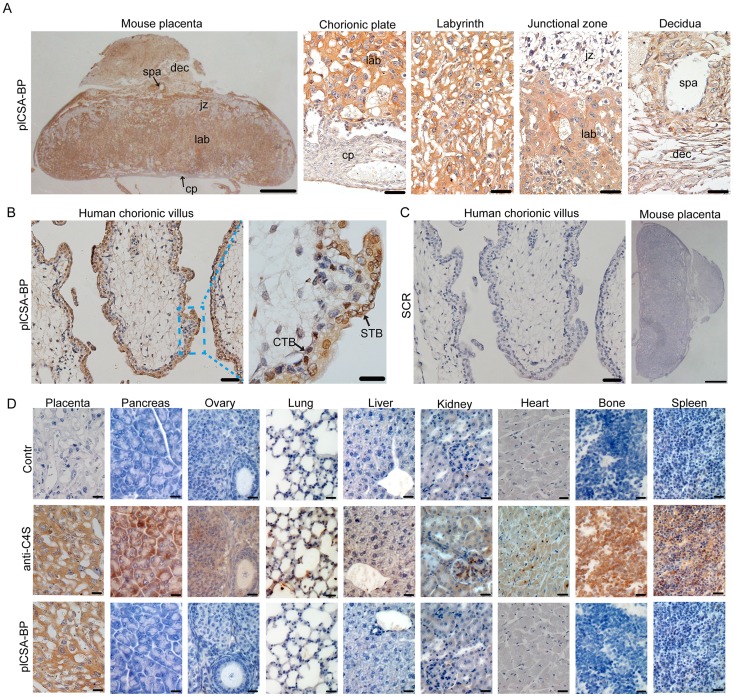
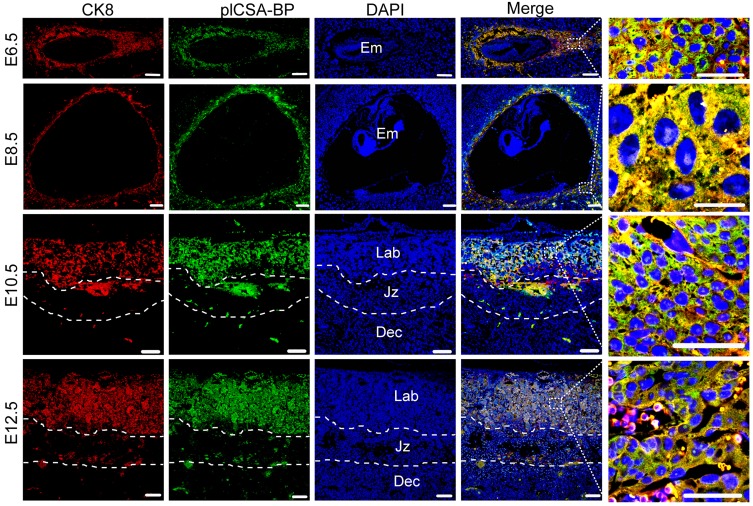
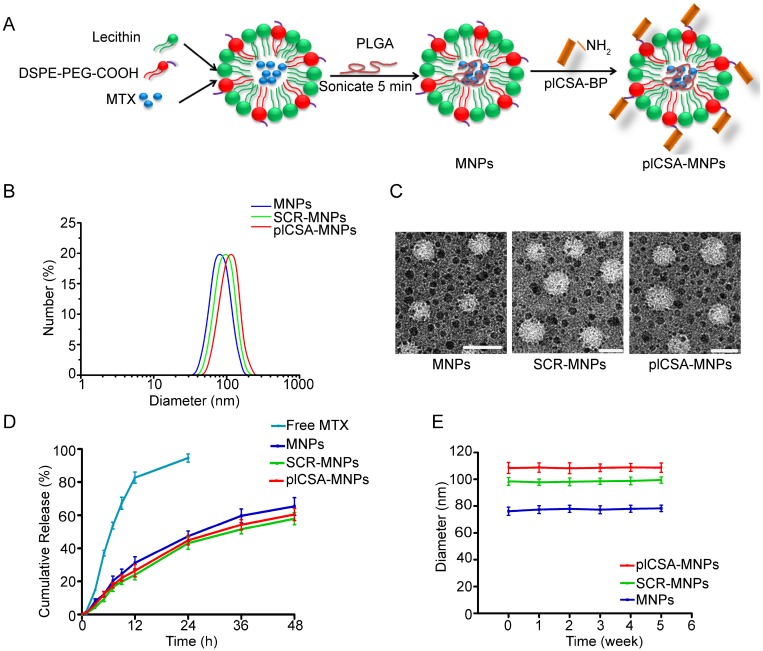
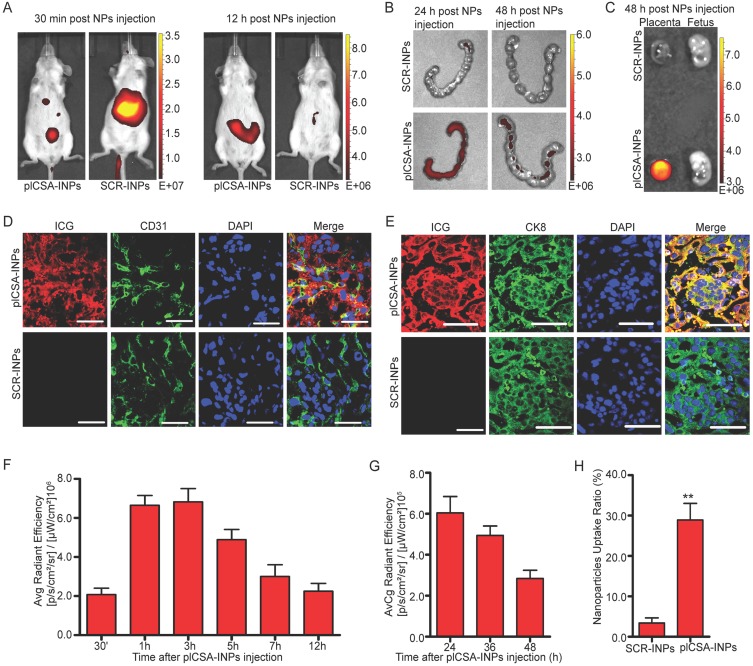
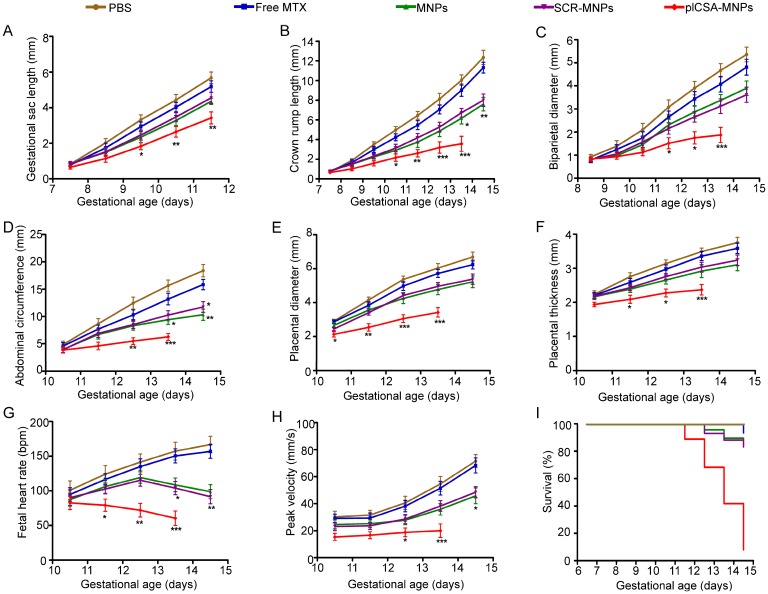
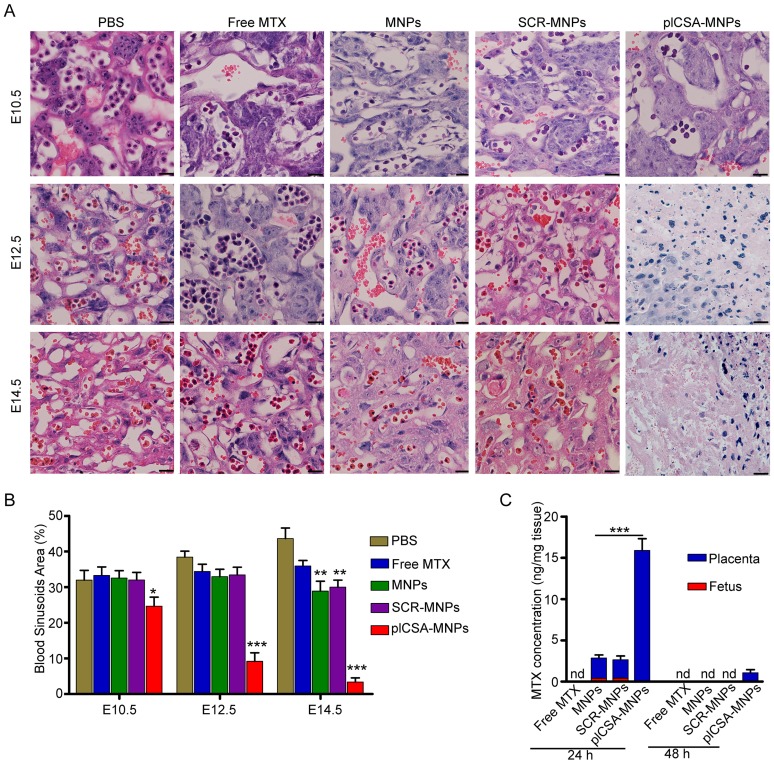
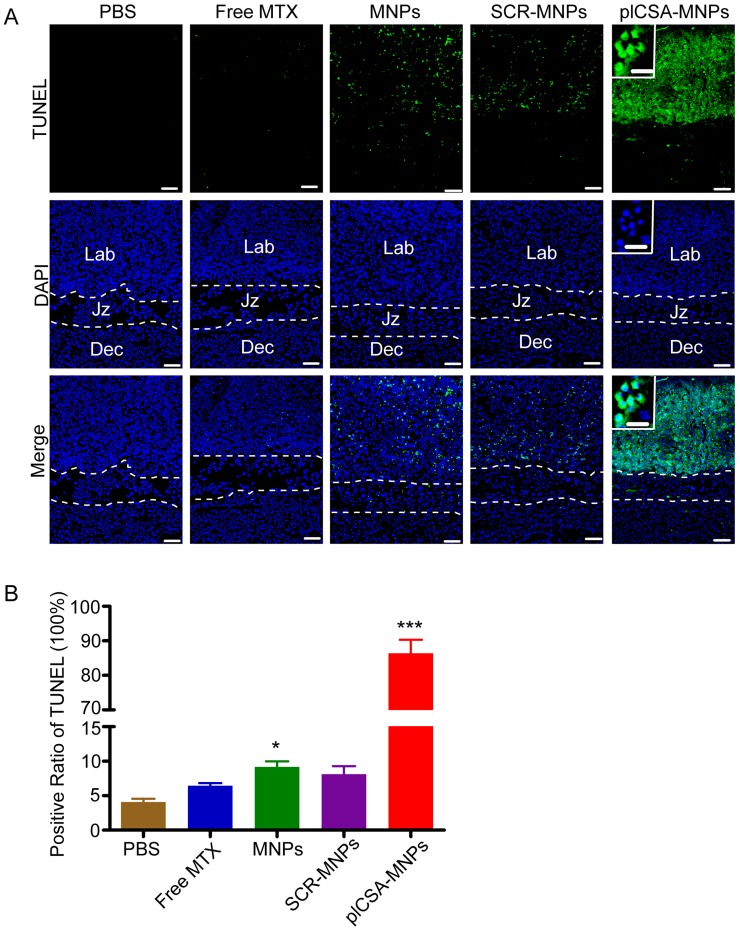
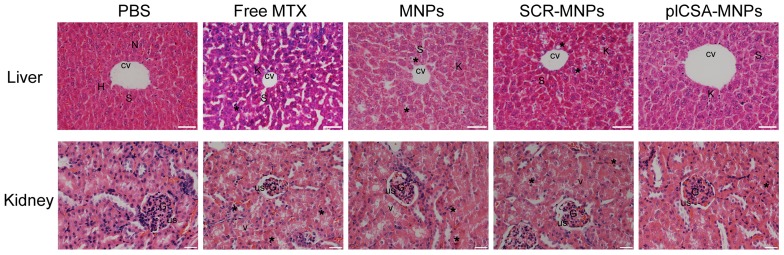
Rationale: The availability of therapeutics to treat pregnancy complications is severely lacking, mainly due to the risk of harm to the fetus. In placental malaria, Plasmodium falciparum-infected erythrocytes (IEs) accumulate in the placenta by adhering to chondroitin sulfate A (CSA) on the surfaces of trophoblasts. Based on this principle, we have developed a method for targeted delivery of payloads to the placenta using a synthetic placental CSA-binding peptide (plCSA-BP) derived from VAR2CSA, a CSA-binding protein expressed on IEs. Methods: A biotinylated plCSA-BP was used to examine the specificity of plCSA-BP binding to mouse and human placental tissue in tissue sections in vitro. Different nanoparticles, including plCSA-BP-conjugated nanoparticles loaded with indocyanine green (plCSA-INPs) or methotrexate (plCSA-MNPs), were administered intravenously to pregnant mice to test their efficiency at drug delivery to the placenta in vivo. The tissue distribution and localization of the plCSA-INPs were monitored in live animals using an IVIS imaging system. The effect of plCSA-MNPs on fetal and placental development and pregnancy outcome were examined using a small-animal high-frequency ultrasound (HFUS) imaging system, and the concentrations of methotrexate in fetal and placental tissues were measured using high-performance liquid chromatography (HPLC). Results: plCSA-BP binds specifically to trophoblasts and not to other cell types in the placenta or to CSA-expressing cells in other tissues. Moreover, we found that intravenously administered plCSA-INPs accumulate in the mouse placenta, and ex vivo analysis of the fetuses and placentas confirmed placenta-specific delivery of these nanoparticles. We also demonstrate successful delivery of methotrexate specifically to placental cells by plCSA-BP-conjugated nanoparticles, resulting in dramatic impairment of placental and fetal development. Importantly, plCSA-MNPs treatment had no apparent adverse effects on maternal tissues. Conclusion: These results demonstrate that plCSA-BP-guided nanoparticles could be used for the targeted delivery of payloads to the placenta and serve as a novel placenta-specific drug delivery option.

Keywords: chondroitin sulfate A; nanoparticles; placental CSA binding peptide; trophoblast.


Conflict of interest statement

Competing Interests: X.F., B.Z., and J.Z. are inventors on patent application PCT/CN2017/108646 submitted by SIAT that covers a placenta-specific drug delivery method and its application. All other authors declare that they have no competing interests.

Figures

Figure 1
Figure 1
plCSA-BP specifically binds to placental tissues.(A) Images of full-thickness mouse placenta (left scale bar=1 mm) at E14.5 and magnified images of the chorionic plate (cp), labyrinth (lab), junctional zone (jz), decidua (dec) and spiral artery (spa) (right scale bar=50 μm). Placenta incubated with 50 ng/mL biotin-plCSA-BP and 1:200 HRP-streptavidin. (B) Human placenta chorionic villus stained as in (A) (left scale bar= 50 μm, right scale bar=20 μm). (C) Representative images of indicated tissue specimens incubated with 50 ng/mL biotin-SCR and detected by HRP-streptavidin (left scale bar= 50 μm, right scale bar=1 mm). (D) A selection of 9 normal mouse tissues stained for total CSA using enzymatic GAG end-processing and 1:20 anti-C4S (2B6) or for CS detected by biotin-plCSA-BP as in (A). Images representative of n=4. Scale bar=20 μm. CTB: cytotrophoblasts; STB: syncytiotrophoblasts. See also Figure S1.
Figure 2
Figure 2
plCSA-BP specifically binds to trophoblasts during gestation in mice. Immunofluorescence staining of trophoblasts (CK8, red) and biotin-plCSA-BP (green) stained midline sections from mice at E6.5, E8.5, E10.5 and E12.5 showing that plCSA-BP is co-localized with trophoblasts in the placenta. Nuclei are counter-stained with DAPI, shown in blue. (n=4, scale bar=200 μm (50 μm in magnified pictures)). Dec: decidua; Em: embryo; Jz: junctional zone; Lab: labyrinth.
Figure 3
Figure 3
Synthesis and characterization of nanoparticles. (A) Schematic illustration of the single-step sonication process used to synthesize MNPs and the EDC/NHS reaction scheme used for conjugation with the plCSA-BP. (B) Diameter distributions of different nanoparticles measured by dynamic light scattering (DLS). (C) Representative TEM images of MNPs, SCR-MNPs, and plCSA-MNPs. Scale bars=100 nm. (D) Time course of MTX releasefrom MNPs, SCR-MNPs, and plCSA-MNPs in PBS (pH7.4) at 37°C. (E) Nanoparticle stability in serum (10% FBS) was evaluated by examining size changes. Data are shown as the mean±SD (n=4).
Figure 4
Figure 4
In vivo placenta targeting by using plCSA-INPs.(A) Pregnant mice at E12.5 (n=5 each) were injected with SCR-INPs or plCSA-INPs (ICG, equivalent 5 mg/kg) via the tail vein and imaged with an IVIS spectrum optical imaging system. (B) Ex vivo detection of the ICG signal in uteri by IVIS. (C) Forty-eight hours after intravenous injection of SCR-INPs or plCSA-INPs at E15.5 (n=5 each). (D-E) Representative immunofluorescence images of placental middle sections. SCR-INPs or plCSA-INPs (ICG, red, equivalent 5mg/kg) were injected into the tail vein of pregnant mice. After 48 h, mice were subjected to cardiac perfusion to remove unbound nanoparticles. Placentas were collected, and serial sections were immunostained for CD31 (green) or CK8 (green) and examined by confocal microscopy. DAPI, blue. Scale bar=50 μm. Images representative of n=6. (F-G) Quantification of the IVIS signal from pregnant mice (E12.5) after injection with plCSA-INPs at different time points from 30 min to 48 h. (H) Quantitative analysis of cell-associated nanoparticles as in (E); ICG-positive cells were counted using ImageJin ten random fields per experimental condition. Values are expressed as the mean ±SD (n=6). **p< 0.01. See also Figure S2.
Figure 5
Figure 5
Embryonic growth quantified using ultrasound parameters after various treatments. (A) Gestational sac length (n=10-30 embryos/day), (B) crown rump length (n=30-51 embryos/day), (C) biparietal diameter (n=30-51embryos/day), (D) abdominal circumference (n=30-51embryos/day), (E) placental diameter (30-51 embryos/day), (F) placental thickness (30-51 embryos/day), (G) fetal heart rate (n=20-33 embryos/day) and (H) umbilical artery peak velocity (n=12-36 embryos/day) measured non-invasively by ultrasound in vivo. (I) Fetal survival curves for different treatments (n=45-55 embryo). At pregnancy day 6.5, mice received intravenous injections of different nanoparticles; treatment was administered every 2 days. Values are expressed as the mean ±SD. *p<0.05, **p< 0.01, ***p<0.001 vs. the free MTX group.
Figure 6
Figure 6
HFUS evaluation of embryo morphology after the administration of free MTX and different nanoparticles. At E6.5, mice (n=6 each) received intravenous injections of free MTX or MTX-containing different nanoparticles (1 mg/kg MTX equivalent); treatment was administered every 2 days. Embryonic growth was measured using a Vevo 2100 ultrasound imaging system. (A-B) The embryonic cavity and the embryo (Em) are visible. (C-F) Note the small embryonic cavity (arrows). (G-J) The embryonic heart (He) could be distinguished by ultrasound. (K)The placenta displays hyperechogenic calcification deposits (Ca, arrows) at the fetal-maternal boundary. (L) A resorption site with a small embryonic cavity (arrow). (M-P) An embryo enlarged in size. The placenta (Pl) could be differentiated by its pulsating blood vessels. (Q) An embryo exhibiting a reduced heart rate. Pericardial (Pc) effusion is evident. The placenta has a high echodensity spot and smaller size. (R) A dead embryo. (S-V) Progressive ossification is observed in the fetus. (W-X) Embryos with high echodensity spots are resorbed. Al: allantois; Am: amnion; UC: umbilical connection. Scale bars=1 mm. See also Figure S3.
Figure 7
Figure 7
Methotrexate delivered by plCSA-MNPs significantly reduces placental vascular density. Pregnant mice (n=6 for each group) received intravenous injections of different nanoparticles on E6.5. (A) Histological cross sections of the labyrinth layers from placentas (n=10-14 each) of different groups stained with H&E. (B) The vascular areas in the labyrinthine regions were estimated from at least 3 non-consecutive sections from each placenta using ImageJ. Blood sinusoid cross-sectional areas were calculated as the ratio between the numbers of pixels within the area defined using the threshold function and the overall number of pixels in the image. Scale bar=20 μm. All data are expressed as the mean±SD. ***p< 0.001 vs. PBS group. (C) HPLC measurement of MTX concentrations in placentas (n=15 for each group) and fetuses (n=15 for each group) 24 h and 48 h after a single injection of free MTX or MTX-containing different nanoparticles (1 mg/kg MTX equivalent) in pregnant mice (n=5 for each group) at gestational stage E13.5. Values are expressed as the mean±SD. ***p< 0.001 vs. the MNPs group. nd: not detected. See also Figure S4.
Figure 8
Figure 8
Apoptosis is induced by plCSA-MNPs in the placenta, confirmed by TUNEL assay. (A) Middle sections viewed by fluorescence microscopy. TUNEL-positive cells are stained in green, whereas blue indicates DAPI-stained nuclei. (B) The percentages of TUNEL-positive cells from different treatment groups. Dec, decidua; Jz, junctional zone; Lab: labyrinth. Scale bar=100 μm and white boxes represent magnifications of the indicated areas (scale bar=20 μm). Data are presented as mean ±SD (n=6). *p< 0.05, ***p< 0.001 vs. the PBS group. See also Figure S5.
Figure 9
Figure 9
Free MTX induces renal and hepatic toxicity but plCSA-MNPs do not. The livers from the PBS group had normal histology with the central vein (CV) and hepatic cords of hepatocytes (H) having prominent nuclei (N) separated by blood sinusoids (S). The free MTX group exhibited necrosis of hepatocytes (star), the most dilated blood sinusoids (S) and the highest rate of Kupffer cell activation (K). In addition, liver images from the free MTX group reveal distortion in the cell arrangement around the central vein. Livers from the MNP and SCR-MNP groups had pyknotic nuclei (star) and like the free MTX group had dilated blood sinusoids (S). These images demonstrate moderate improvement with little necrosis of hepatocytes, dilation of blood sinusoids, or activation of Kupffer cells. Mouse livers treated with plCSA-MNPs displayed normal hepatic cells with few Kupffer cells (scale bar=50 μm). Sections of normal kidney tissue from the PBS group verify normal architecture of glomeruli (G), urinary spaces (US), and renal tubules. In the free MTX group, the kidneys displayed vacuolation and pyknotic nuclei (star) in some tubules, glomerular atrophy and dilated urinary spaces. Kidneys from the MNP and SCR-MNP groups exhibited moderate vacuolation and pyknotic nuclei in renal epithelia, while kidneys from the plCSA-MNP group appeared nearly normal. Images representative of n=5. Scale bar= 20 μm

References

    1. Stillbirth Collaborative Research Network Writing Group. Causes of death among stillbirths. Jama. 2011;306:2459–68. - PMC - PubMed
    1. Berg CJ, Atrash HK, Koonin LM, Tucker M. Pregnancy-related mortality in the United States, 1987-1990. Obstet Gynecol. 1996;88:161–7. - PubMed
    1. Cantwell R, Clutton-Brock T, Cooper G, Dawson A, Drife J, Garrod D. et al. Saving Mothers' Lives: Reviewing maternal deaths to make motherhood safer: 2006-2008. The Eighth Report of the Confidential Enquiries into Maternal Deaths in the United Kingdom. BJOG. 2011;118(Suppl 1):1–203. - PubMed
    1. Fisk NM, Atun R. Market failure and the poverty of new drugs in maternal health. PLoS Med. 2008;5:e22. - PMC - PubMed
    1. Fisk NM, McKee M, Atun R. Relative and absolute addressability of global disease burden in maternal and perinatal health by investment in R&D. Trop Med Int Health. 2011;16:662–8. - PubMed

Publication types