. 2018 Mar 23:3:33.
doi: 10.12688/wellcomeopenres.14265.2. eCollection 2018.

Evaluation of phylogenetic reconstruction methods using bacterial whole genomes: a simulation based study

Affiliations

Evaluation of phylogenetic reconstruction methods using bacterial whole genomes: a simulation based study

John A Lees et al. Wellcome Open Res. .

Abstract

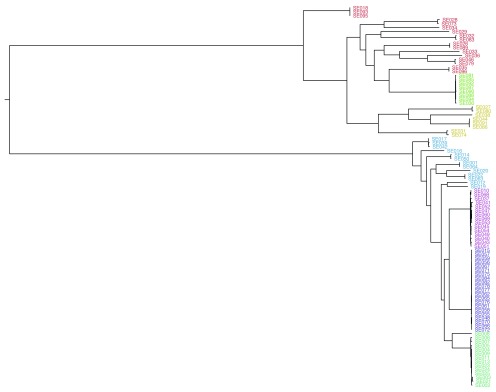
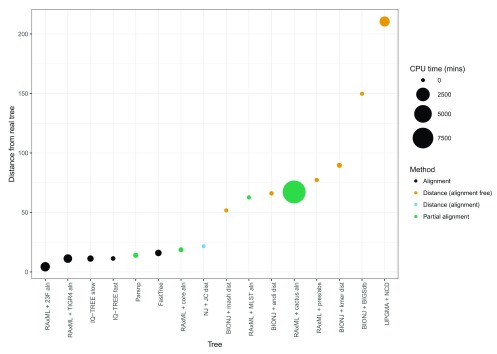
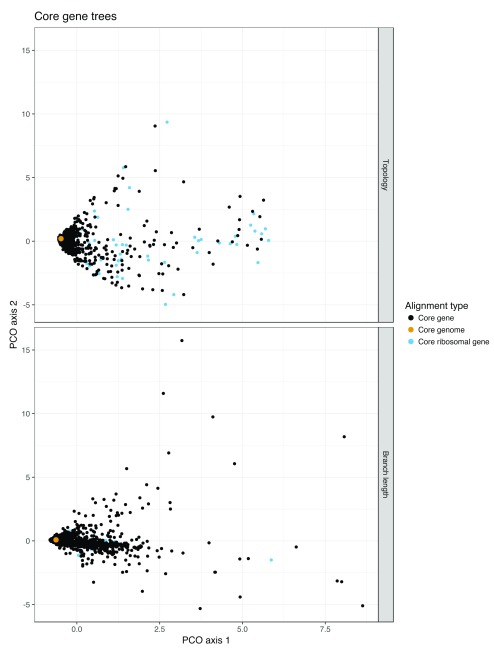
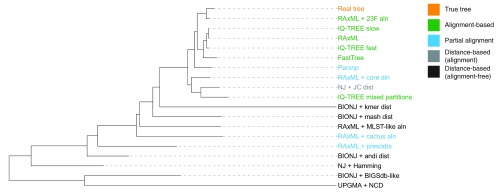
Background: Phylogenetic reconstruction is a necessary first step in many analyses which use whole genome sequence data from bacterial populations. There are many available methods to infer phylogenies, and these have various advantages and disadvantages, but few unbiased comparisons of the range of approaches have been made. Methods: We simulated data from a defined "true tree" using a realistic evolutionary model. We built phylogenies from this data using a range of methods, and compared reconstructed trees to the true tree using two measures, noting the computational time needed for different phylogenetic reconstructions. We also used real data from Streptococcus pneumoniae alignments to compare individual core gene trees to a core genome tree. Results: We found that, as expected, maximum likelihood trees from good quality alignments were the most accurate, but also the most computationally intensive. Using less accurate phylogenetic reconstruction methods, we were able to obtain results of comparable accuracy; we found that approximate results can rapidly be obtained using genetic distance based methods. In real data we found that highly conserved core genes, such as those involved in translation, gave an inaccurate tree topology, whereas genes involved in recombination events gave inaccurate branch lengths. We also show a tree-of-trees, relating the results of different phylogenetic reconstructions to each other. Conclusions: We recommend three approaches, depending on requirements for accuracy and computational time. Quicker approaches that do not perform full maximum likelihood optimisation may be useful for many analyses requiring a phylogeny, as generating a high quality input alignment is likely to be the major limiting factor of accurate tree topology. We have publicly released our simulated data and code to enable further comparisons.

Keywords: bacteria; phylogenetic methods; phylogeny; simulation; tree distance.


Conflict of interest statement

No competing interests were disclosed.

Figures

Figure 1.
Figure 1.. The phylogeny inferred by Kremer et al. used as the true tree in simulations.
Tips are coloured by BAPS cluster inferred from the core genome alignment.
Figure 2.
Figure 2.. Ordered accuracies from Table 1, showing the CPU time required for each tree.
There are large changes in accuracy between the alignment and distance methods, and again between two inaccurate distance methods.
Figure 3.
Figure 3.. A multidimensional scaling plot of the KC distances between all core gene trees from a real population of 616 S. pneumoniae genomes.
Top: topology distances ( λ = 0); bottom: branch length distances ( λ = 0). The core genome tree from the concatenated alignment is shown in yellow; trees from ribosomal proteins, which tended to have different topologies due to their lack of variation, are shown in blue. The top twenty divergent trees by branch length are listed in Supplementary Table 2 ( Supplementary File 1). The full list of distances by gene can be accessed at https://gist.github.com/johnlees/da164a4260e13528e8315e266a46bf3f.
Figure 4.
Figure 4.. Tree of tree methods.
Using the KC metric between all the inferred phylogenies in Table 1 to create a pairwise distance matrix, an NJ tree created from this matrix. This shows how the topologies from all methods are related to each other (a tree-of-trees, or supertree). The true tree is in orange at the top, and four classes of methods are labeled. For alignment-based methods the mapping of reads to the TIGR4 reference was used, unless explicitly stated. We also performed multi-dimensional scaling of these distances in two dimensions to show how the methods clustered (see interactive treespace plots or static Supplementary Figure 6; Supplementary File 1).

References

    1. Yang Z: Computational Molecular Evolution. OUP Oxford.2006. 10.1093/acprof:oso/9780198567028.001.0001 - DOI
    1. Tang P, Gardy JL: Stopping outbreaks with real-time genomic epidemiology. Genome Med. 2014;6(11):104. 10.1186/s13073-014-0104-4 - DOI - PMC - PubMed
    1. Felsenstein J: The number of evolutionary trees. Syst Biol. 1978;27(1):27–33. 10.2307/2412810 - DOI
    1. Liu K, Linder CR, Warnow T: RAxML and FastTree: comparing two methods for large-scale maximum likelihood phylogeny estimation. PLoS One. 2011;6(11):e27731. 10.1371/journal.pone.0027731 - DOI - PMC - PubMed
    1. Zhou X, Shen XX, Hittinger CT, et al. : Evaluating Fast Maximum Likelihood-Based Phylogenetic Programs Using Empirical Phylogenomic Data Sets. Mol Biol Evol. 2018;35(2):486–503. 10.1093/molbev/msx302 - DOI - PMC - PubMed