

Healthcare Cost and Utilization in Nonalcoholic Fatty Liver Disease: Real-World Data From a Large U.S. Claims Database
- PMID: 29774589
- PMCID: PMC6240503
- DOI: 10.1002/hep.30094
Healthcare Cost and Utilization in Nonalcoholic Fatty Liver Disease: Real-World Data From a Large U.S. Claims Database
Abstract
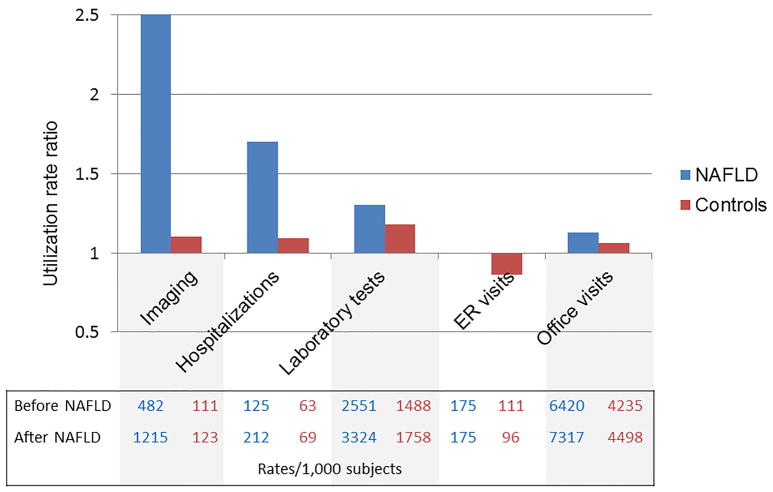
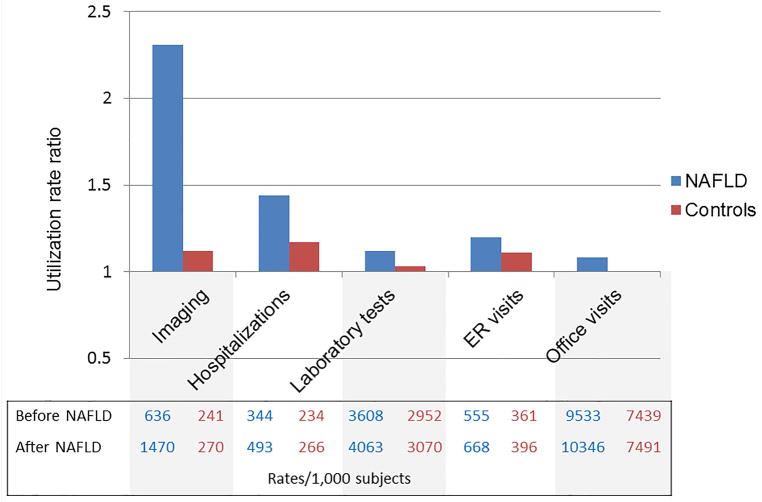
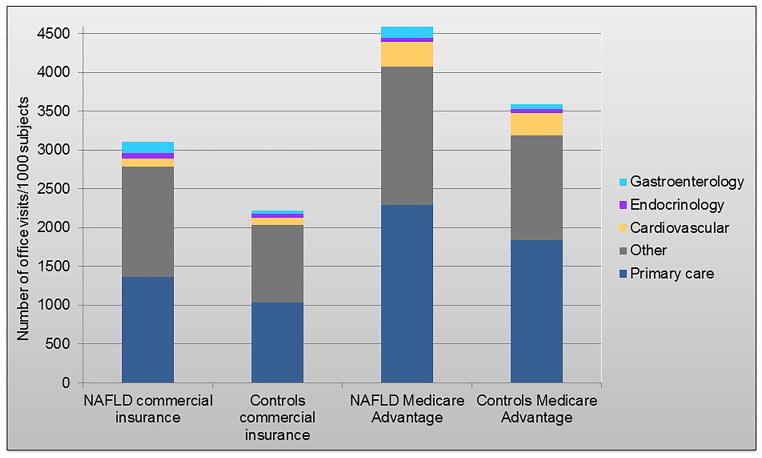
The prevalence of nonalcoholic fatty liver disease (NAFLD) is increasing. The health care burden resulting from the multidisciplinary management of this complex disease is unknown. We assessed the total health care cost and resource utilization associated with a new NAFLD diagnosis, compared with controls with similar comorbidities. We used OptumLabs Data Warehouse, a large national administrative claims database with longitudinal health data of over 100 million individuals enrolled in private and Medicare Advantage health plans. We identified 152,064 adults with a first claim for NAFLD between 2010 and 2014, of which 108,420 were matched 1:1 by age, sex, metabolic comorbidities, length of follow-up, year of diagnosis, race, geographic region, and insurance type to non-NAFLD contemporary controls from the OptumLabs Data Warehouse database. Median follow-up time was 2.6 (range 1-6.5) years. The final study cohort consisted of 216,840 people with median age 55 (range 18-86) years, 53% female, 78% white. The total annual cost of care per NAFLD patient with private insurance was $7,804 (interquartile range [IQR] $3,068-$18,688) for a new diagnosis and $3,789 (IQR $1,176-$10,539) for long-term management. These costs are significantly higher than the total annual costs of $2,298 (IQR $681-$6,580) per matched control with similar metabolic comorbidities but without NAFLD. The largest increases in health care utilization that may account for the increased costs in NAFLD compared with controls are represented by liver biopsies (relative risk [RR] = 55.00, 95% confidence interval [CI] 24.48-123.59), imaging (RR = 3.95, 95% CI 3.77-4.15), and hospitalizations (RR = 1.87, 95% CI 1.73-2.02). Conclusion: The costs associated with the care for NAFLD independent of its metabolic comorbidities are very high, especially at first diagnosis. Research efforts shouldfocus on identification of underlying determinants of use, sources of excess cost, and development of cost-effective diagnostic tests.
© 2018 by the American Association for the Study of Liver Diseases.
Conflict of interest statement
Figures

Comment in
-
Economic burden and healthcare utilization in nonalcoholic fatty liver disease.Hepatobiliary Surg Nutr. 2019 Apr;8(2):181-183. doi: 10.21037/hbsn.2018.12.11. Hepatobiliary Surg Nutr. 2019. PMID: 31098375 Free PMC article. No abstract available.
-
Reply.Hepatology. 2019 Oct;70(4):1493-1494. doi: 10.1002/hep.30796. Hepatology. 2019. PMID: 31152591 No abstract available.
-
Letter to the Editor: Suggestions for Rational Management of Nonalcoholic Fatty Liver Disease.Hepatology. 2019 Oct;70(4):1492-1493. doi: 10.1002/hep.30797. Hepatology. 2019. PMID: 31152594 No abstract available.
-
Understanding the risks and benefits of policy action in NAFLD.J Hepatol. 2023 Jul;79(1):22-24. doi: 10.1016/j.jhep.2023.03.034. Epub 2023 Apr 5. J Hepatol. 2023. PMID: 37023965 No abstract available.
References
-
- Younossi ZM, Blissett D, Blissett R, Henry L, Stepanova M, Younossi Y, Racila A, et al. The economic and clinical burden of nonalcoholic fatty liver disease in the United States and Europe. Hepatology. 2016;64:1577–1586. - PubMed
-
- Williams CD, Stengel J, Asike MI, Torres DM, Shaw J, Contreras M, Landt CL, et al. Prevalence of nonalcoholic fatty liver disease and nonalcoholic steatohepatitis among a largely middle-aged population utilizing ultrasound and liver biopsy: a prospective study. Gastroenterology. 2011;140:124–131. - PubMed
-
- Rinella ME. Nonalcoholic fatty liver disease: a systematic review. Jama. 2015;313:2263–2273. - PubMed
Publication types
MeSH terms
Grants and funding
LinkOut - more resources
Full Text Sources
Other Literature Sources
Medical
