. 2018 Dec;80(6):2573-2585.
doi: 10.1002/mrm.27347. Epub 2018 May 17.

In vivo characterization of 3D skull and brain motion during dynamic head vibration using magnetic resonance elastography

Affiliations

In vivo characterization of 3D skull and brain motion during dynamic head vibration using magnetic resonance elastography

Ziying Yin et al. Magn Reson Med. 2018 Dec.

Abstract

Purpose: To introduce newly developed MR elastography (MRE)-based dual-saturation imaging and dual-sensitivity motion encoding schemes to directly measure in vivo skull-brain motion, and to study the skull-brain coupling in volunteers with these approaches.

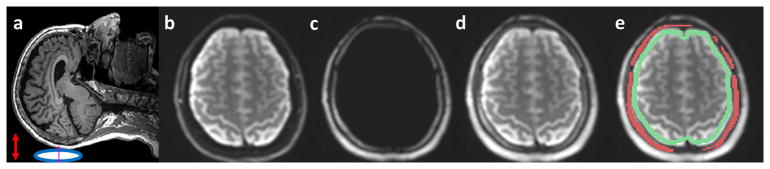
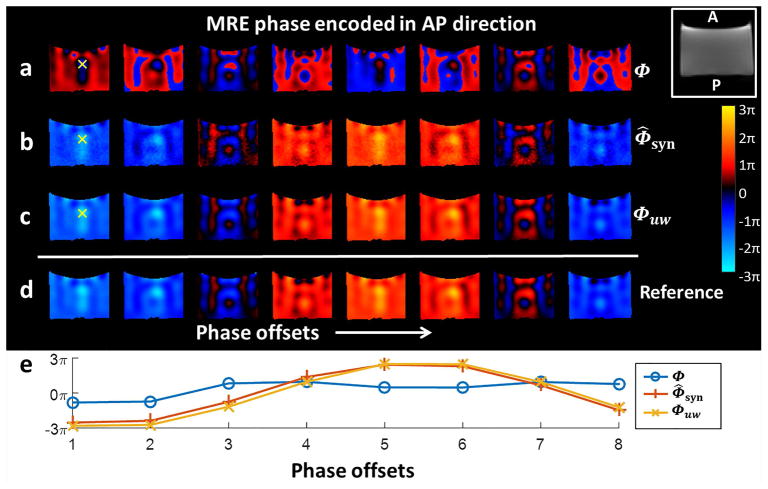
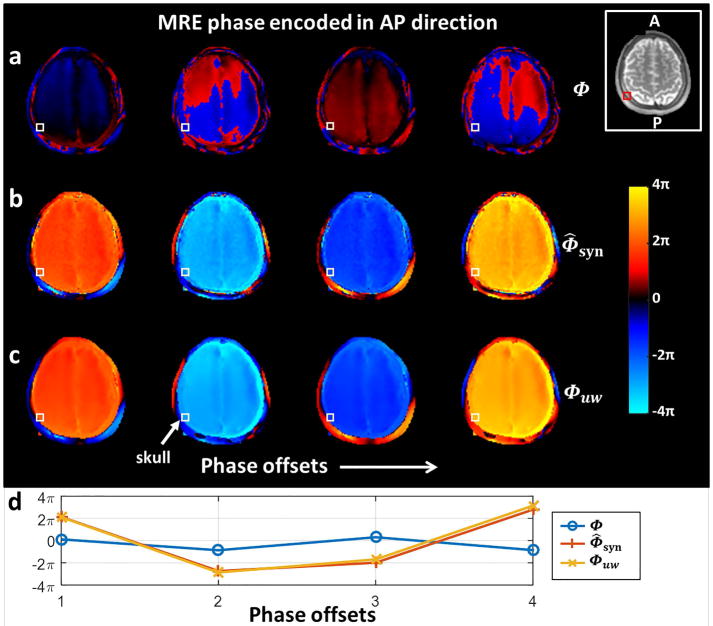
Methods: Six volunteers were scanned with a high-performance compact 3T-MRI scanner. The skull-brain MRE images were obtained with a dual-saturation imaging where the skull and brain motion were acquired with fat- and water-suppression scans, respectively. A dual-sensitivity motion encoding scheme was applied to estimate the heavily wrapped phase in skull by the simultaneous acquisition of both low- and high-sensitivity phase during a single MRE exam. The low-sensitivity phase was used to guide unwrapping of the high-sensitivity phase. The amplitude and temporal phase delay of the rigid-body motion between the skull and brain was measured, and the skull-brain interface was visualized by slip interface imaging (SII).

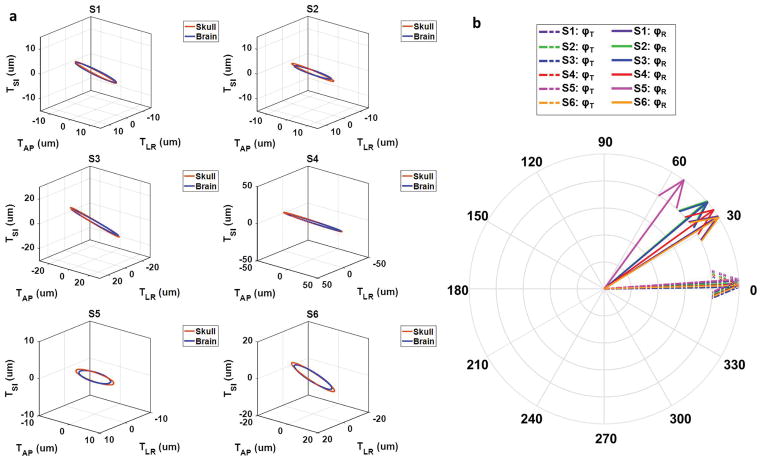
Results: Both skull and brain motion can be successfully acquired and unwrapped. The skull-brain motion analysis demonstrated the motion transmission from the skull to the brain is attenuated in amplitude and delayed. However, this attenuation (%) and delay (rad) were considerably greater with rotation (59 ± 7%, 0.68 ± 0.14 rad) than with translation (92 ± 5%, 0.04 ± 0.02 rad). With SII the skull-brain slip interface was not completely evident, and the slip pattern was spatially heterogeneous.

Conclusion: This study provides a framework for acquiring in vivo voxel-based skull and brain displacement using MRE that can be used to characterize the skull-brain coupling system for understanding of mechanical brain protection mechanisms, which has potential to facilitate risk management for future injury.

Keywords: magnetic resonance elastography; mechanical characterization; motion; skull and brain coupling; skull and brain interface; tissue.


Figures

Figure 1
Figure 1
The pulse sequence diagram of spin-echo (SE) echo-planar-imaging (EPI)-based MRE incorporating the dual-sensitivity motion encoding scheme. The amplitude of the negative motion encoding gradients (MEGs) (orange plot) is smaller than the amplitude of the positive MEGs (blue plot) in x- and y-directions to create the low-sensitivity encoding. The z-axis flow-compensation gradient (green oval) was used for the low-sensitivity encoding in the z-direction.
Figure 2
Figure 2
(a) Brain MRE soft pillow driver positioned beneath the head (blue oval) induces vibrations in anterior-posterior (AP) direction (red arrow). (b–d) Illustration of dual-saturation imaging of a healthy volunteer in a representative slice. (b) MRE magnitude brain image acquired with the water-selective spatial-spectral (SPSP) excitation. (c) MRE magnitude image of scalp-skull acquired with the fat-selective SPSP excitation. (d) MRE magnitude image generated by combining (a) and (b). The recombined image demonstrates excellent depiction of both the skull and brain. (e) Illustration of the skull (red) and brain surface (green) ROIs for motion analysis.
Figure 3
Figure 3
MRE phase data of the phantom showing the 8 phase offsets of (a) the wrapped high-sensitivity phase Φ encoded in AP direction (coronal plane), (b) the synthesized high-sensitivity phase Φ̂syn estimated from the low-sensitivity phase data according to Equation [9], and (c) the unwrapped phase Φuw guided by Φ̂syn according to Equation [11]. (d) The unwrapped high-sensitivity phase guided by the separate low-MEG scan as the reference standard. (e) A plot of the phase values at a single voxel (the yellow cross) over the 8 MRE phase offsets. It shows the correct harmonic nature of the phase signal in the unwrapped phase images compared to the wrapped phase.
Figure 4
Figure 4
MRE phase data from a normal volunteer encoded in the AP direction (axial plane). The 4 MRE phase offsets of (a) the wrapped high-sensitivity phase Φ, (b) the synthesized high-sensitivity phase Φ̂syn estimated from the low-sensitivity phase data according to Equation [9], and (c) the unwrapped phase Φuw guided by Φ̂syn according to Equation [11]. (d) The plot of the skull phase at a single voxel (the white box) over the 4 phase offsets. It shows the correct harmonic nature of the phase signal in the unwrapped phase images compared to the wrapped phase.
Figure 5
Figure 5
The amplitude of the rigid body (a) translational and (b) rotational motion of the skull and the brain at the x- (LR: left-right), y- (AP: anterior-posterior), and z- (SI: superior-inferior)-directions for six volunteers. (c) The brain-to-skull amplitude ratio of the dominant components of translation (TAP) and rotation (θLR).
Figure 6
Figure 6
(a) The 3D translational motion trajectories of the skull and brain for each volunteer. (b) The temporal phase delays (translation: φT and rotation: φR) between the skull and brain motion for each volunteer.
Figure 7
Figure 7
Slip interface imaging (SII) results of 6 volunteers. Two representative slices are shown for each volunteer. The low-intensity lines in shear line images (right column) at the scalp-skull interface (yellow arrows) and skull-brain interface (green arrows) indicate a relatively slippery interface where large differential motion exists between the two sides of the interface. The loss of signal in scalp tissue in volunteers 3–5 may be partly due to apparent slip occurring throughout the subcutaneous fatty tissue, which is often observed in subjects with thicker scalp tissue, and partly due to large intravoxel phase dispersion induced by the higher wave amplitude in the scalp tissue.

References

    1. Hyder AA, Wunderlich CA, Puvanachandra P, Gururaj G, Kobusingye OC. The impact of traumatic brain injuries: a global perspective. NeuroRehabilitation. 2007;22(5):341–353. - PubMed
    1. Centers for Disease Control and Prevention (CDC) Report to congress on traumatic brain injury in the United States: epidemiology and rehabilitation. Atlanta (GA): National Center for Injury Prevention and Control; Division of Unintentional Injury Prevention; 2015.
    1. Post A, Hoshizaki TB. Mechanisms of brain impact injuries and their prediction: A review. Trauma. 2012;14(4):327–349.
    1. Xiong Y, Mahmood A, Chopp M. Animal models of traumatic brain injury. Nat Rev Neurosci. 2013;14(2):128–142. - PMC - PubMed
    1. Dixit P, Liu GR. A review on recent development of finite element models for head injury simulations. Arch Computat Methods Eng. 2017;24(4):979–1031.

Publication types