Probability of Heat Intolerance: Standardized Interpretation of Heat-Tolerance Testing Results Versus Specialist Judgment
- PMID: 29775421
- PMCID: PMC5967286
- DOI: 10.4085/1062-6050-519-16
Probability of Heat Intolerance: Standardized Interpretation of Heat-Tolerance Testing Results Versus Specialist Judgment
Abstract
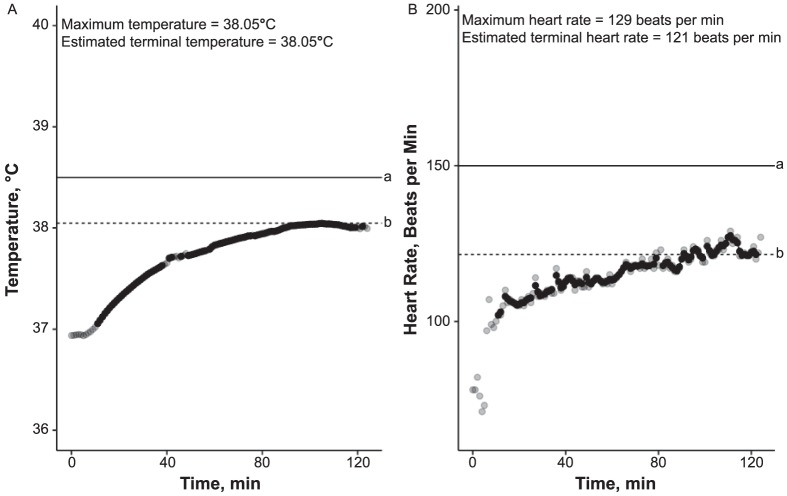
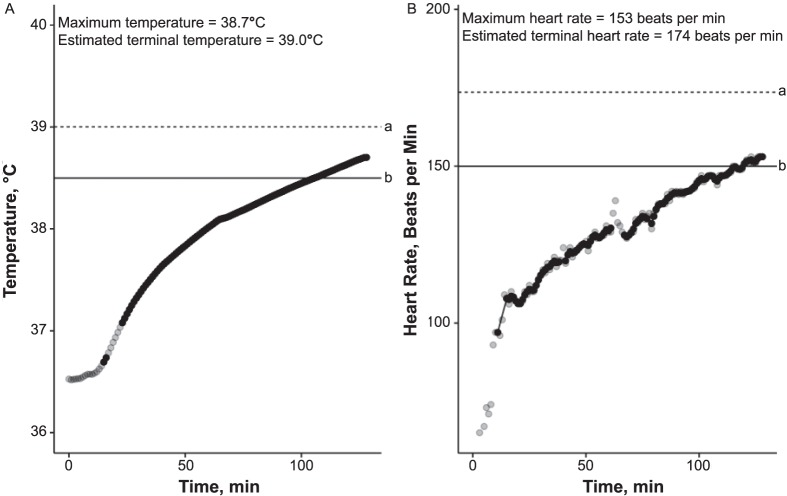
Context: The heat-tolerance test (HTT) is a screening tool for secondary prevention of exertional heat illness by the Israel Defense Forces. To discern participant tolerance, recruits are exposed to intermediate environmental and exercise stresses, and their physiological responses, core temperature, and heart rate are monitored. When their physiological measures rise at a higher rate or exceed the upper levels of absolute values compared with other participants, heat intolerance (HI) is diagnosed.
Objective: To develop a mathematical model to interpret HTT results and provide a quantitative estimate of the probability of heat tolerance (PHT).
Design: Cross-sectional study.
Setting: Warrior Health Research Institute.
Patients or other participants: The HTT results of 175 random individuals tested after an episode of exertional heat illness were classified qualitatively and then divided into training (n = 112) and testing (n = 63) datasets. All individuals were male soldiers (age range = 18-22 years) who had sustained an episode of definitive or suspected exertional heat stroke.
Main outcome measure(s): Based on the decision algorithm used by the Israel Defense Forces for manual interpretation of the HTT, we designed a logistic regression model to predict the heat-tolerance state. The model used a time series of physiological measures (core temperature and heart rate) of individuals to predict the manually assigned diagnosis of HT or HI. It was initially fitted and then tested on 2 separate, random datasets. The model produced a single value, the PHT, and its predictive ability was demonstrated by prediction-density plots, receiver operating characteristic curve, contingency tables, and conventional screening test evaluation measures.
Results: According to prediction-density plots of the testing set, all HT patients had a PHT of 0.7 to 1. The receiver operating characteristic curve plot showed that PHT was an excellent predictor of the manual HT interpretations (area under the curve = 0.973). Using a cutoff probability of 0.5 for the diagnosis of HI, we found that PHT had sensitivity, specificity, and accuracy of 100%, 90%, and 92.06%, respectively.
Conclusions: The PHT has the potential to be substituted for manual interpretation of the HTT and to serve in a variety of clinical and research applications.
Keywords: exertional heat illness; exertional heat stroke; heat-tolerance test; return to duty.
Figures


References
-
- Shapiro Y., Magazanik A., Udassin R., Ben-Baruch G., Shvartz E., Shoenfeld Y. Heat intolerance in former heatstroke patients. . 1979; 90 6: 913– 916. - PubMed
-
- Shapiro Y., Seidman DS. Field and clinical observations of exertional heat stroke patients. . 1990; 22 1: 6– 14. - PubMed
-
- Moran DS., Erlich T., Epstein Y. The heat tolerance test: an efficient screening tool for evaluating susceptibility to heat. . 2007; 16 3: 215– 221. - PubMed
-
- Strydom NB. Heat intolerance: its detection and elimination in the mining industry. . 1980; 76 4: 154– 156.
-
- Schermann H., Heled Y., Fleischmann C., et al. The validity of the heat tolerance test in prediction of recurrent exertional heat illness events [published online October 12, 2017]. . doi: 10.1016/j.jsams.2017.10.001. - DOI - PubMed
MeSH terms
LinkOut - more resources
Full Text Sources
Other Literature Sources
Medical