

Analytical scaling relations to evaluate leakage and intrusion in intermittent water supply systems
- PMID: 29775462
- PMCID: PMC5959068
- DOI: 10.1371/journal.pone.0196887
Analytical scaling relations to evaluate leakage and intrusion in intermittent water supply systems
Abstract
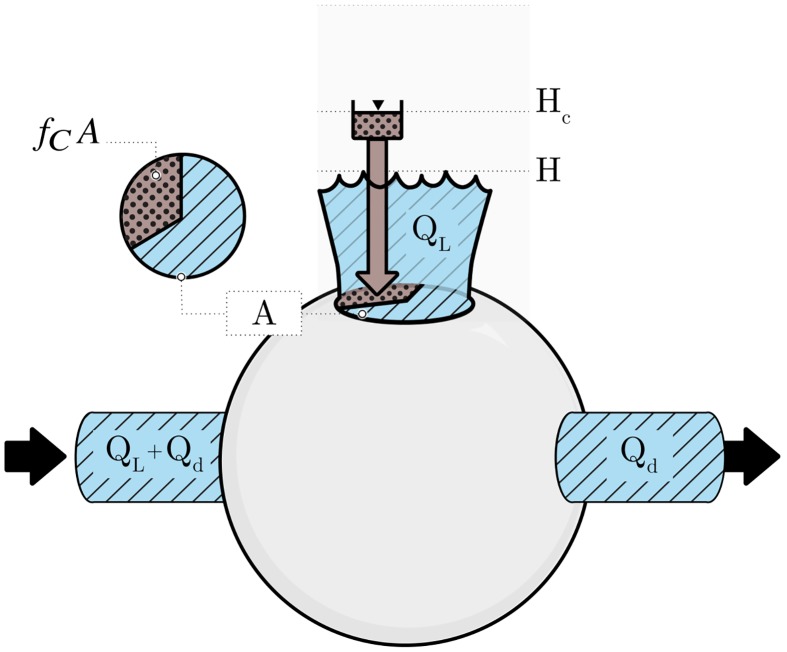
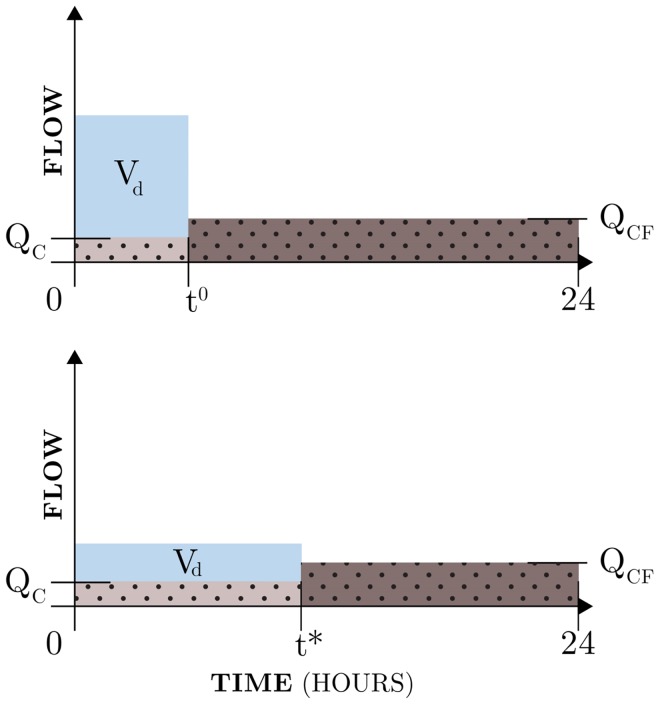
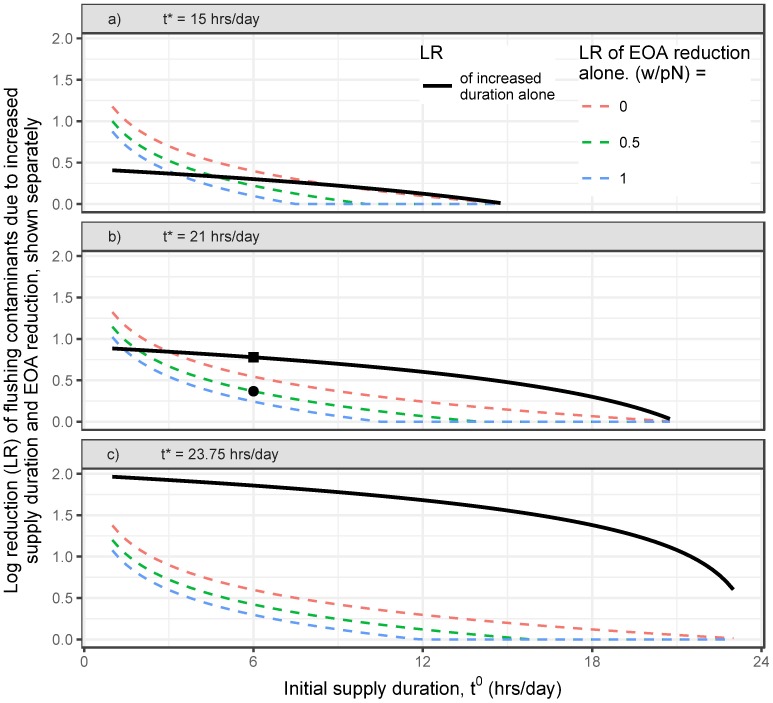
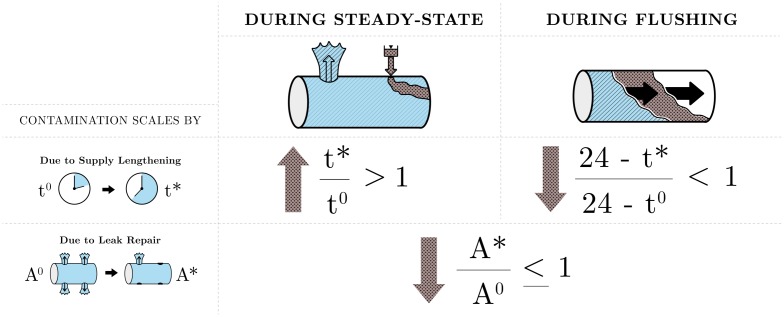
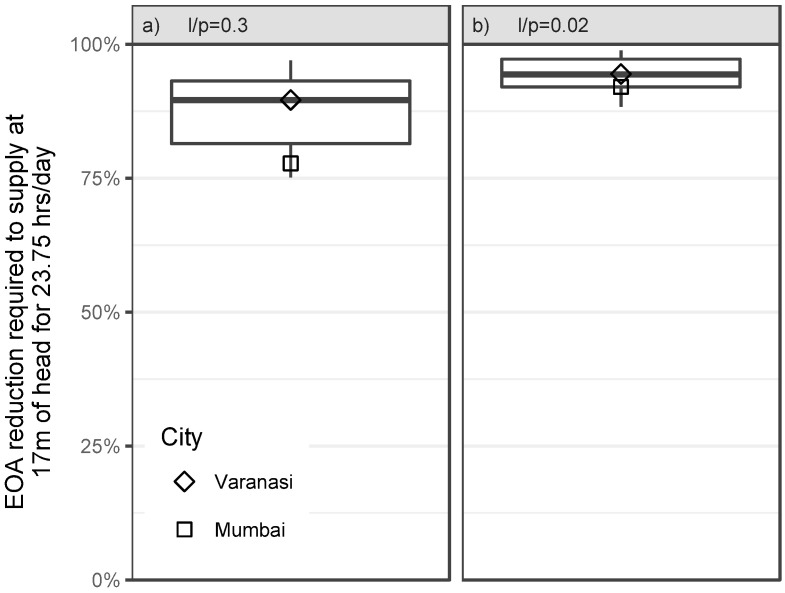
Intermittent water supplies (IWS) deliver piped water to one billion people; this water is often microbially contaminated. Contaminants that accumulate while IWS are depressurized are flushed into customers' homes when these systems become pressurized. In addition, during the steady-state phase of IWS, contaminants from higher-pressure sources (e.g., sewers) may continue to intrude where pipe pressure is low. To guide the operation and improvement of IWS, this paper proposes an analytic model relating supply pressure, supply duration, leakage, and the volume of intruded, potentially-contaminated, fluids present during flushing and steady-state. The proposed model suggests that increasing the supply duration may improve water quality during the flushing phase, but decrease the subsequent steady-state water quality. As such, regulators and academics should take more care in reporting if water quality samples are taken during flushing or steady-state operational conditions. Pipe leakage increases with increased supply pressure and/or duration. We propose using an equivalent orifice area (EOA) to quantify pipe quality. This provides a more stable metric for regulators and utilities tracking pipe repairs. Finally, we show that the volume of intruded fluid decreases in proportion to reductions in EOA. The proposed relationships are applied to self-reported performance indicators for IWS serving 108 million people described in the IBNET database and in the Benchmarking and Data Book of Water Utilities in India. This application shows that current high-pressure, continuous water supply targets will require extensive EOA reductions. For example, in order to achieve national targets, utilities in India will need to reduce their EOA by a median of at least 90%.
Conflict of interest statement
The authors have declared that no competing interests exist.
Figures
Similar articles
-
Mechanisms affecting water quality in an intermittent piped water supply.Environ Sci Technol. 2014;48(5):2766-75. doi: 10.1021/es405054u. Epub 2014 Feb 20. Environ Sci Technol. 2014. PMID: 24459990
-
Understanding the impacts of intermittent supply on the drinking water microbiome.Curr Opin Biotechnol. 2019 Jun;57:167-174. doi: 10.1016/j.copbio.2019.04.003. Epub 2019 May 14. Curr Opin Biotechnol. 2019. PMID: 31100615 Review.
-
Microbial water quality improvement associated with transitioning from intermittent to continuous water supply in Nagpur, India.Water Res. 2021 Aug 1;201:117301. doi: 10.1016/j.watres.2021.117301. Epub 2021 May 30. Water Res. 2021. PMID: 34139512
-
Intermittent Water Supply Impacts on Distribution System Biofilms and Water Quality.Water Res. 2021 Aug 1;201:117372. doi: 10.1016/j.watres.2021.117372. Epub 2021 Jun 17. Water Res. 2021. PMID: 34198200
-
Intermittent Water Supply: Prevalence, Practice, and Microbial Water Quality.Environ Sci Technol. 2016 Jan 19;50(2):542-53. doi: 10.1021/acs.est.5b03973. Epub 2016 Jan 5. Environ Sci Technol. 2016. PMID: 26670120 Review.
Cited by
-
Effects of hydraulically disconnecting consumer pumps in an intermittent water supply.Water Res X. 2021 Jun 18;12:100107. doi: 10.1016/j.wroa.2021.100107. eCollection 2021 Aug 1. Water Res X. 2021. PMID: 34345814 Free PMC article.
-
Biofilm detachment significantly affects biological stability of drinking water during intermittent water supply in a pilot scale water distribution system.Sci Rep. 2025 Jul 1;15(1):22408. doi: 10.1038/s41598-025-03535-1. Sci Rep. 2025. PMID: 40594086 Free PMC article.
-
The Bacterial Urban Resistome: Recent Advances.Antibiotics (Basel). 2022 Apr 12;11(4):512. doi: 10.3390/antibiotics11040512. Antibiotics (Basel). 2022. PMID: 35453263 Free PMC article. Review.
References
-
- Bivins AW, Sumner T, Kumpel E, Howard G, Cumming O, Ross I, et al. Estimating infection risks and the global burden of diarrheal disease attributable to intermittent water supply using QMRA. Environmental Science & Technology. 2017;51(13):7542–7551. doi: 10.1021/acs.est.7b01014 - DOI - PubMed
-
- Laspidou C, Spyropoulou A. Global dimensions of IWS—number of people affected worldwide In: Dealing with the complex interrelation of intermittent supply and water losses. London: IWA Publishing; 2017. p. 5–16.
-
- Health of Towns Association. Report of the committee to the members of the association, on Lord Lincoln’s sewerage, drainage, etc., of town’s bill. London: Health of Towns Association; 1846. Available from: https://babel.hathitrust.org/cgi/pt?id=uc1.$b93318;view=1up;seq=241. - PMC - PubMed
-
- Solgi M, Bozorg Haddad O, Seifollahi-Aghmiuni S, Loáiciga HA. Intermittent operation of water distribution networks considering equanimity and justice principles. Journal of Pipeline Systems Engineering and Practice. 2015; doi: 10.1061/(ASCE)PS.1949-1204.0000198 - DOI
-
- Kumpel E, Nelson KL. Comparing microbial water quality in an intermittent and continuous piped water supply. Water Research. 2013;47(14):5176–5188. doi: 10.1016/j.watres.2013.05.058 - DOI - PubMed
Publication types
MeSH terms
Substances
LinkOut - more resources
Full Text Sources
Other Literature Sources
Medical
Molecular Biology Databases
Research Materials
