Widespread anatoxin-a detection in benthic cyanobacterial mats throughout a river network
- PMID: 29775481
- PMCID: PMC5959195
- DOI: 10.1371/journal.pone.0197669
Widespread anatoxin-a detection in benthic cyanobacterial mats throughout a river network
Abstract
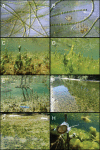
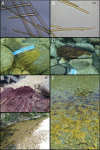
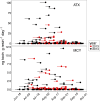
Benthic algae fuel summer food webs in many sunlit rivers, and are hotspots for primary and secondary production and biogeochemical cycling. Concerningly, riverine benthic algal assemblages can become dominated by toxic cyanobacteria, threatening water quality and public health. In the Eel River in Northern California, over a dozen dog deaths have been attributed to cyanotoxin poisonings since 2000. During the summers of 2013-2015, we documented spatial and temporal patterns of cyanotoxin concentrations in the watershed, showing widespread distribution of anatoxin-a in benthic cyanobacterial mats. Solid phase adsorption toxin tracking (SPATT) samplers were deployed weekly to record dissolved microcystin and anatoxin-a levels at 10 sites throughout the watershed, and 187 Anabaena-dominated or Phormidium-dominated cyanobacterial mat samples were collected from 27 locations to measure intracellular anatoxin-a (ATX) and microcystins (MCY). Anatoxin-a levels were higher than microcystin for both SPATT (mean MCY = 0.8 and ATX = 4.8 ng g resin-1 day-1) and cyanobacterial mat samples (mean MCY = 0.074 and ATX = 1.89 μg g-1 DW). Of the benthic mats sampled, 58.9% had detectable anatoxin-a (max = 70.93 μg g-1 DW), while 37.6% had detectable microcystins (max = 2.29 μg g-1 DW). SPATT cyanotoxin levels peaked in mid-summer in warm mainstem reaches of the watershed. This is one of the first documentations of widespread anatoxin-a occurrence in benthic cyanobacterial mats in a North American watershed.
Conflict of interest statement
The authors have declared that no competing interests exist.
Figures


References
-
- Garcia-Pichel F, Belnap J, Neuer S, Schanz F. Estimates of global cyanobacterial biomass and its distribution. Arch Hydrobiol Suppl Algol Stud. 2003;109: 213–227. doi: 10.1127/1864-1318/2003/0109-0213 - DOI
-
- Whitton BA, editor. Ecology of Cyanobacteria II: their diversity in space and time. Dordrecht: Springer Netherlands; 2012. doi: 10.1007/978-94-007-3855-3 - DOI
-
- Paerl HW. Nuisance phytoplankton blooms in coastal, estuarine, and inland waters. Limnol Oceanogr. 1988;33: 823–847.
-
- Chorus I, Bartram J. Toxic cyanobacteria in water: a guide to their public health consequences, monitoring, and management. Chorus I, Bartram J, editors. London: E & FN Spon; 1999.
-
- Wood R. Acute animal and human poisonings from cyanotoxin exposure—a review of the literature. Environ Int. 2016;91: 276–282. doi: 10.1016/j.envint.2016.02.026 - DOI - PubMed
Publication types
MeSH terms
Substances
LinkOut - more resources
Full Text Sources
Other Literature Sources

