. 2018 May 17;70(4):663-678.e6.
doi: 10.1016/j.molcel.2018.04.011.

p300-Mediated Lysine 2-Hydroxyisobutyrylation Regulates Glycolysis

Affiliations

p300-Mediated Lysine 2-Hydroxyisobutyrylation Regulates Glycolysis

He Huang et al. Mol Cell. .

Erratum in

Abstract

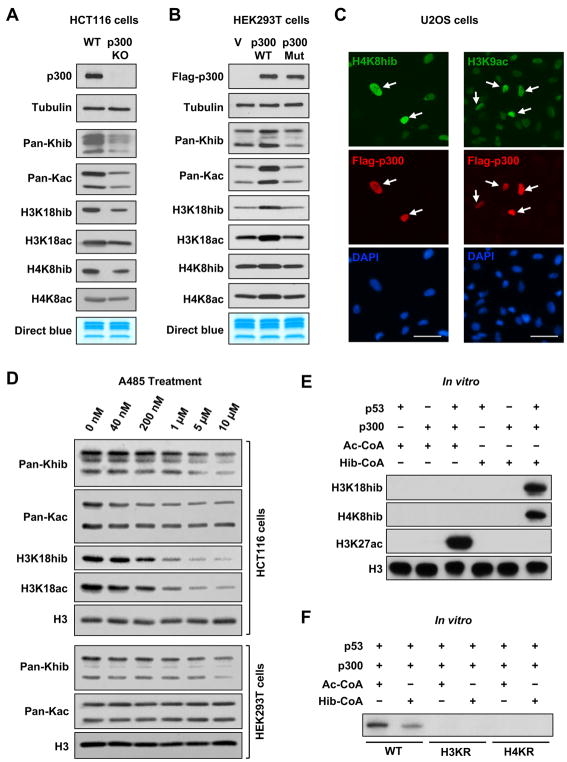
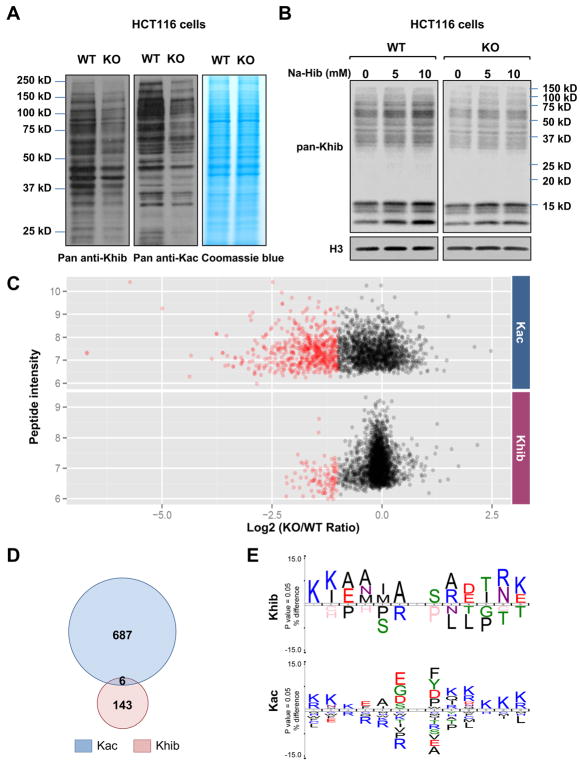
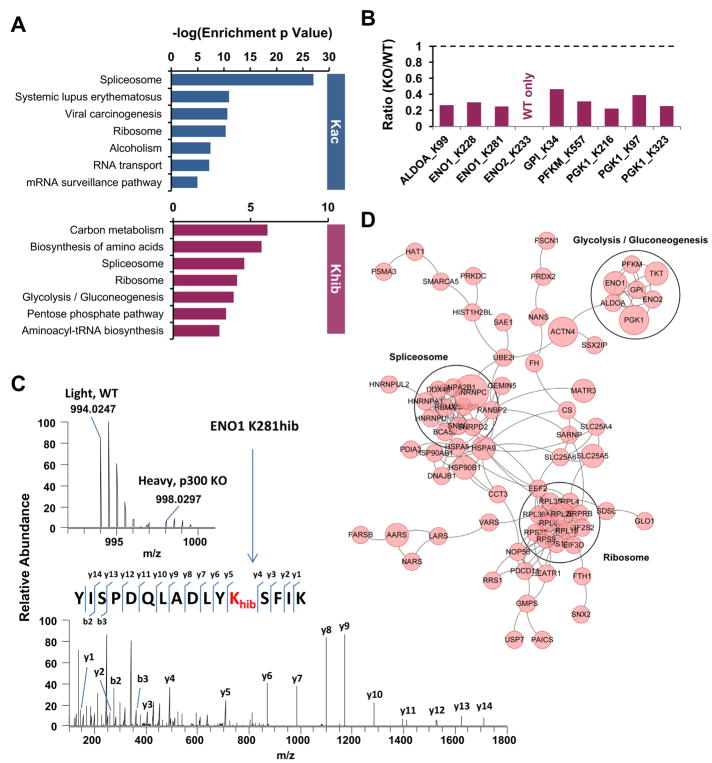
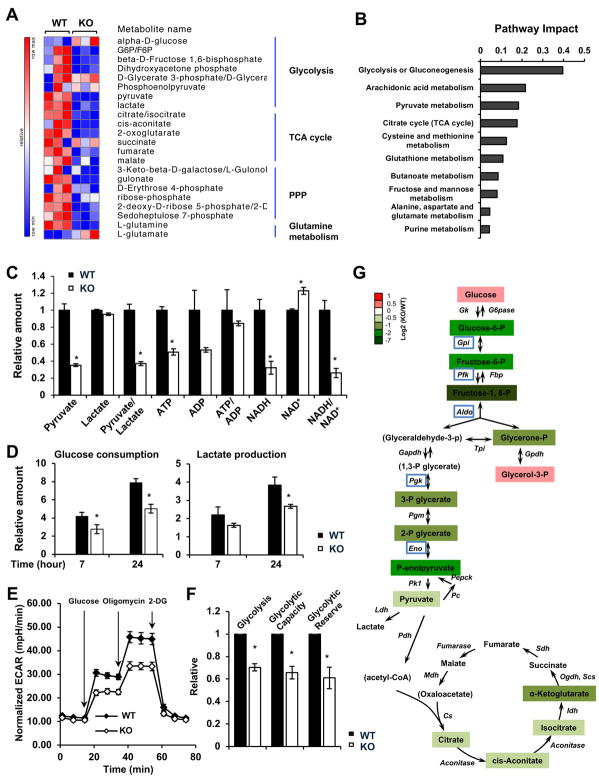
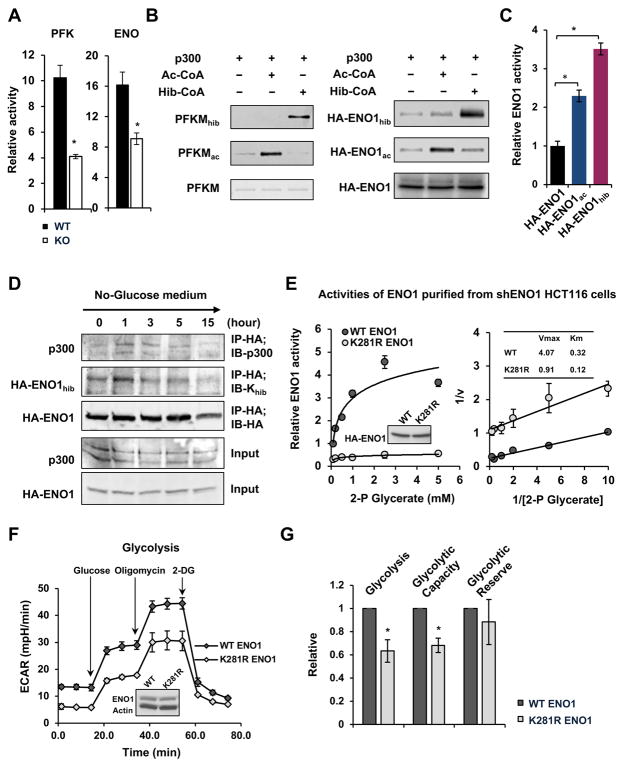
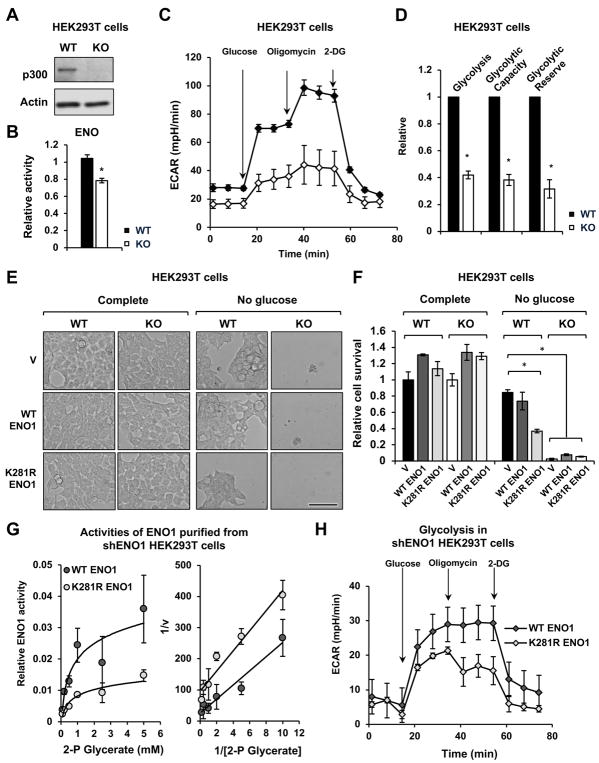
Lysine 2-hydroxyisobutyrylation (Khib) is an evolutionarily conserved and widespread histone mark like lysine acetylation (Kac). Here we report that p300 functions as a lysine 2-hyroxyisobutyryltransferase to regulate glycolysis in response to nutritional cues. We discovered that p300 differentially regulates Khib and Kac on distinct lysine sites, with only 6 of the 149 p300-targeted Khib sites overlapping with the 693 p300-targeted Kac sites. We demonstrate that diverse cellular proteins, particularly glycolytic enzymes, are targeted by p300 for Khib, but not for Kac. Specifically, deletion of p300 significantly reduces Khib levels on several p300-dependent, Khib-specific sites on key glycolytic enzymes including ENO1, decreasing their catalytic activities. Consequently, p300-deficient cells have impaired glycolysis and are hypersensitive to glucose-depletion-induced cell death. Our study reveals an p300-catalyzed, Khib-specific molecular mechanism that regulates cellular glucose metabolism and further indicate that p300 has an intrinsic ability to select short-chain acyl-CoA-dependent protein substrates.

Keywords: EP300; cell survival; glycolysis; lysine 2-hydroxyisobutyrylation.


Conflict of interest statement

DECLARATION OF INTERESTS

Y. Z. is on the science advisory board of PTM Biolabs.

Figures

Figure 1
Figure 1. p300 Catalyzes Histone Khib
(A) p300 deficiency impairs both Khib and Kac of histones in cells. Histone Khib and Kac levels were analyzed in WT and p300 KO HCT116 cells by immuno-blotting with indicated antibodies. (B) Overexpression of WT but not a mutant p300 increases both Khib and Kac levels on histones. HEK293T cells were transfected with either empty vector (V), or constructs expressing Flag-p300 (WT) or Flag-p300D1399Y (Mut) for 48 hours. The indicated histone modification marks were analyzed by immuno-blotting. (C) Overexpression of WT p300 enhances both Khib and Kac of histones in U2OS cells. U2OS cells transfected with WT p300 were immuno-stained with anti-H4K8hib and anti-H3K9ac antibodies, respectively. Please note that cells overexpressing FLAG-p300 have higher levels of H4K8hib (left) and H3K9ac (right) than untransfected cells. Bars, 50 μm. (D) Inhibition of p300 dose-dependently reduces Khib and Kac levels of histones in cells. HCT116 and HEK293T cells were treated with a p300 inhibitor A485 for 24 hours, and the Khib and Kac levels of histones were analyzed by immuno-blotting with indicated antibodies. (E) p300 2-hydroxyisobutyrates histone octamers in actively transcribed chromatin in vitro. p300-dependent in vitro transcription system was set up as described in STAR Methods, and the Khib and Kac levels of histones were analyzed by immuno-blotting with indicated antibodies. (F) p300-mediated histone 2-hydroxyisobutyration activates p53-dependent transcription in vitro. p300-dependent in vitro transcription system was set up using WT histones and K-R mutant histones. RNA products were visualized by autoradiography. See also Figure S1.
Figure 2
Figure 2. Deletion of p300 alters Khib levels on various protein substrates
A) Deletion of p300 reduces Kac and Khib levels on various non-histone proteins. Total cell lysate from WT and p300 KO HCT116 cells were analyzed for Khib and Kac levels by immuno-blotting with indicated pan anti-Khib or anti-Kac antibody. (B) 2-hydroxyisobutyrate dose-dependently increases total Khib levels on various cellular proteins in part through p300. WT and p300 KO HCT116 cells were treated with 2-hydroxyisobutyrate (Na-Hib) at indicated concentrations for 24 hours. Please note that Na-Hib treatment dose-dependently increased the Khib levels in WT cells, but this trend was blunted in p300 KO cells. (C) p300 deficiency leads to systemic reduction of Khib and Kac on a number of protein substrates. The scatter plots show the ratio of Khib and Kac peptides in p300 KO vs WT cells in relation to average peptide intensities. (D) p300 catalyzes Khib and Kac on distinct lysine residues in a variety of protein substrates. The Venn diagrams show overlap between p300-targeted Khib and Kac sites. (E) The consensus sequence logos show enrichment of amino acid residues among the p300-targeted Khib and Kac sites. See also Figure S2, Tables S1 and S2.
Figure 3
Figure 3. p300-mediated Khib specifically targets glycolytic enzymes
(A) p300-catalyzed Khib has a unique impact on cellular metabolism. The bar graphs show KEGG pathways enriched in p300-targeted Khib and Kac proteomes. (B) Deletion of p300 reduces Khib levels on 5 key glycolytic enzymes. The bar graphs show the KO/WT ratio of p300-targeted Khib sites on the key enzymes in the glycolysis pathway. (C) The full MS and MS/MS spectra of ENO1 K281hib peptide for its identification and quantification. The b and y ions indicate peptide backbone fragment ions containing the N and C terminals, respectively. (D) p300-mediated Khib specifically target glycolytic enzymes. Interaction Network of p300-regulated Khib Proteome Based on STRING Database (v10). The network is visualized in Cytoscape, and the size of the node is positively corresponded to the number of Khib sites per protein. See also Table S2.
Figure 4
Figure 4. p300 Deficiency Results in Defective Glycolysis
(A) p300 KO HCT116 cells have altered glycolysis, TCA cycle, and glutamine metabolism. WT and p300 KO HCT116 cells cultured in complete medium were used for metabolomics analysis. The relative abundance of metabolites involved in glycolysis, TCA cycle, PPP, and glutamine pathway was displayed by the heat map (n=3 independent experiments). (B) Deletion of p300 significantly impairs glycolysis or gluconeogenesis. The metabolites significantly reduced in p300 KO cells (fold change: KO/WT < 0.5, and p<0.05) were analyzed by pathway enrichment analysis and pathway topology analysis in the Pathway Analysis module of MetaboAnalyst 3.0, and the pathway impact scores of the top ten pathways were shown. (C) p300 KO HCT116 cells have reduced levels of many metabolites related to glycolysis when cultured in complete medium. The relative amounts of indicated metabolites were quantified by metabolomics (n=3, *p<0.05, values are expressed as mean ±SEM). (D) p300 KO HCT116 cells have reduced glucose consumption and lactate production when cultured in complete medium. The decrease of glucose and increase of lactate in culture medium were measured for indicated times (n=4, *p<0.05, values are expressed as mean ±SEM). (E) p300 KO HCT116 cells have reduced glycolytic activities. The glycolysis activity was analyzed by the Seahorse analyzer as described in STAR Methods (n=4 technical repeats, values are expressed as mean ±SEM). (F) p300 KO HCT116 cells have reduced glycolysis, glycolytic capacity, and glycolytic reserve (n=4 independent experiments from 2 pairs of WT and p300 KO HCT116 cells, *p<0.05, values are expressed as mean ±SEM). (G) p300 KO HCT116 cells display reduced glycolysis after 6 hours of glucose depletion. WT and p300 KO HCT116 cells were cultured in medium without glucose for 6 hours, and the relative amounts of metabolites were quantified by metabolomics analysis (n=3). Metabolites not detected in the experiment were designated inside the parentheses. Five hypo-2-hydroxyisobutyrylated proteins in p300 KO cells were highlighted with blue boxes. See also Figure S3 and Table S3.
Figure 5
Figure 5. p300 Regulates the Activities of Key Glycolytic Enzymes through Khib
(A) Both PFK and ENO1 enzymes display reduced activities in p300 KO HCT116 cells. WT and p300 KO HCT116 cells were cultured in complete medium. The activities of PFK and ENO1 from total cell lysates were measured using colorimetric assay kits (n=3, *p<0.05, values are expressed as mean ±SEM). (B) p300 2-hydroxyisobutyrylates PKFM and ENO1 in vitro. Immuno-purified HA-ENO1 proteins from p300 KO HCT116 cells and recombinant PFKM proteins were in vitro 2-hydroxyisobutyrylated by recombinant p300 as described in the STAR Methods. (C) p300-mediated Khib activates ENO1 in vitro. Immuno-purified HA-ENO1 proteins from p300 KO HCT116 cells were in vitro 2-hydroxyisobutyrylated by recombinant p300, and their activities were then analyzed in vitro as described in the STAR Methods (n=3, *p<0.05, values are expressed as mean ±SEM). Please note that in addition to Khib on K228 and K281, ENO1 also had a number of Kac sites that were dynamically regulated by p300, including K228, K335, and K343 (Table S2). It appeared that p300-mediated Kac on these sites also activated ENO1 in vitro. (D) Khib levels of ENO1 are dynamically regulated upon glucose depletion in cells. The Khib levels of HA-ENO1 and the interaction between ENO1 and p300 were analyzed at different time points after glucose depletion. (E) An ENO1 mutant that cannot be 2-hydroxyisobutyrylated has reduced enzymatically activity when expressed in WT HCT116 cells where endogenous ENO1 was knocked down by shRNAs. The HA-ENO1 proteins were immuno-purified by anti-HA and the enzymatic activity of purified proteins were analyzed in vitro as described in the STAR Methods (n=3, values are expressed as mean ±SEM). (F) HCT116 cells expressing K281R ENO1 have reduced glycolysis. The glycolysis activity was analyzed by the Seahorse analyzer (n=5 technical repeats, values are expressed as mean ±SEM). (G) Overexpression of K281R ENO1 decreases glycolysis and glycolytic capacity in cells (n=3 independent experiments, *p<0.05, values are expressed as mean ±SEM). See also Figure S4.
Figure 6
Figure 6. p300 Deficiency leads to hyper-sensitivity to glucose depletion
(A) p300 KO HCT116 cells have reduced proliferation in different culture media. Cells were plated in the complete medium and switched to the indicated medium at day 1 (n=3, *p<0.05, values are expressed as mean ±SEM). (B) p300 KO HCT116 cells are sensitive to glucose but not glutamine depletion. Cells were plated in the complete medium and switched to the indicated medium 24 hours later, and were then analyzed after 24 hour-incubation at the indicated media. Bar, 200 μm. (C–D) p300 KO HCT116 cells display reduced cell survival and enhanced cell death upon glucose depletion. Cells were cultured as in (A) in indicated medium, and cell death was analyzed by FACS as described in STAR Methods (n=3, *p<0.05, values are expressed as mean ±SEM). (E–F) HCT116 cells expressing K281R ENO1 have reduced cell survival upon glucose depletion. WT and p300 KO HCT116 cells, and WT HCT116 cells expressing WT ENO1 or K281R ENO1 proteins were incubated in complete medium or glucose-free medium for 24 hours, the cell survival was measured by the WST-1 reagent (n=3, *p<0.05, values are expressed as mean ±SEM). Bar in (E), 100 μm. (G–H) Adding back pyruvate in culture medium rescues p300 deficiency-induced sensitivity to glucose depletion. WT and p300 KO HCT116 cells were cultured in complete medium, no glucose medium, or no glucose medium plus 1 mM pyruvate for 24 hours. Bar in (G), 100 μm.
Figure 7
Figure 7. p300-mediated 2-hydroxyisobutyrylation regulates glycolysis in HEK293T cells
(A) Deletion of p300 in HEK293T cells by the CRISPR/Cas9 gene editing technology. The protein levels of p300 in WT and p300 KO HEK293T cells were analyzed by immuno-blotting. (B) p300 KO HEK293T cells have reduced activity of ENO1 (n=3, values are expressed as mean ±SEM). (C) p300 KO HEK293T cells have reduced glycolysis. Representative ECAR profile from WT and p300 KO HEK293T cells is shown (n=5 technical repeats, values are expressed as mean ±SEM). (D) p300 KO HEK293T cells have reduced glycolysis, glycolytic capacity, and glycolytic reserve (n=4 independent experiments, *p<0.05, values are expressed as mean ±SEM). (E–F) p300 KO HEK293T cells are hypersensitive to glucose depletion. WT and p300 KO HEK293T cells transfected with constructs expressing indicated proteins were plated in the complete medium and switched to the indicated medium 24 hours later, and were then analyzed after 24 hour-incubation at the indicated media (n=3, values are expressed as mean ±SEM). Bar in (E), 100 μm. (G) The ENO1 K281R has reduced enzymatically activity when expressed in HEK293T cells where endogenous ENO1 was knocked down by shRNAs. The HA-ENO1 proteins were immuno-purified by anti-HA beads from HEK293T cells and the enzymatic activity of purified proteins were analyzed in vitro as described (n=3, values are expressed as mean ±SEM). (H) HEK293T cells expressing K281R ENO1 have reduced glycolysis (n=5 technical repeats, values are expressed as mean ±SEM). See also Figure S5.

References

    1. An W, Roeder RG. Reconstitution and transcriptional analysis of chromatin in vitro. Methods Enzymol. 2004;377:460–474. - PubMed
    1. Anderson KA, Huynh FK, Fisher-Wellman K, Stuart JD, Peterson BS, Douros JD, Wagner GR, Thompson JW, Madsen AS, Green MF, et al. SIRT4 Is a Lysine Deacylase that Controls Leucine Metabolism and Insulin Secretion. Cell Metab. 2017;25:838–855. e815. - PMC - PubMed
    1. Bheda P, Jing H, Wolberger C, Lin H. The Substrate Specificity of Sirtuins. Annu Rev Biochem. 2016;85:405–429. - PubMed
    1. Bouatra S, Aziat F, Mandal R, Guo AC, Wilson MR, Knox C, Bjorndahl TC, Krishnamurthy R, Saleem F, Liu P, et al. The human urine metabolome. PLoS One. 2013;8:e73076. - PMC - PubMed
    1. Bowers EM, Yan G, Mukherjee C, Orry A, Wang L, Holbert MA, Crump NT, Hazzalin CA, Liszczak G, Yuan H, et al. Virtual ligand screening of the p300/CBP histone acetyltransferase: identification of a selective small molecule inhibitor. Chem Biol. 2010;17:471–482. - PMC - PubMed

Publication types