. 2018 May 17;173(5):1265-1279.e19.
doi: 10.1016/j.cell.2018.03.037.

The Neuropeptide Tac2 Controls a Distributed Brain State Induced by Chronic Social Isolation Stress

Affiliations

The Neuropeptide Tac2 Controls a Distributed Brain State Induced by Chronic Social Isolation Stress

Moriel Zelikowsky et al. Cell. .

Abstract

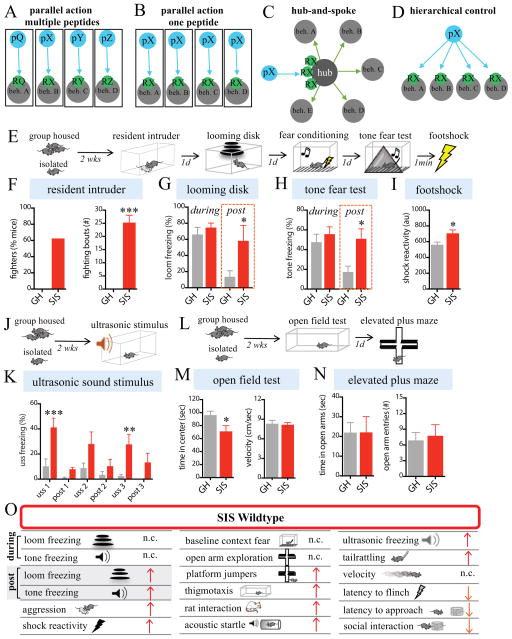
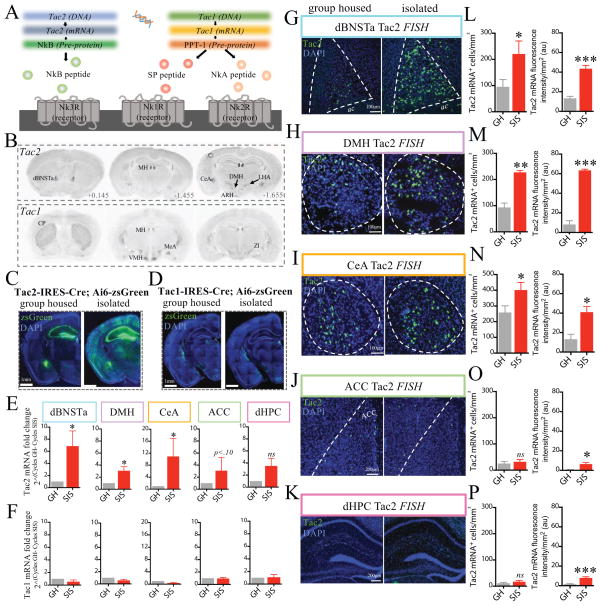
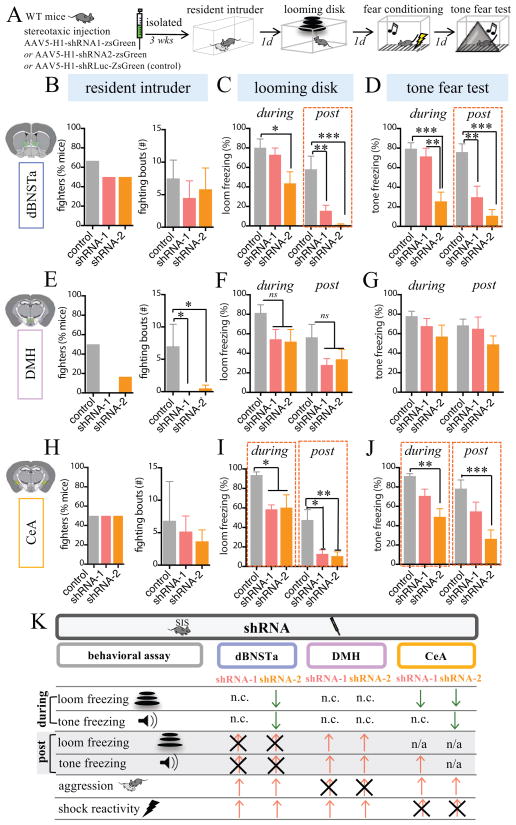
Chronic social isolation causes severe psychological effects in humans, but their neural bases remain poorly understood. 2 weeks (but not 24 hr) of social isolation stress (SIS) caused multiple behavioral changes in mice and induced brain-wide upregulation of the neuropeptide tachykinin 2 (Tac2)/neurokinin B (NkB). Systemic administration of an Nk3R antagonist prevented virtually all of the behavioral effects of chronic SIS. Conversely, enhancing NkB expression and release phenocopied SIS in group-housed mice, promoting aggression and converting stimulus-locked defensive behaviors to persistent responses. Multiplexed analysis of Tac2/NkB function in multiple brain areas revealed dissociable, region-specific requirements for both the peptide and its receptor in different SIS-induced behavioral changes. Thus, Tac2 coordinates a pleiotropic brain state caused by SIS via a distributed mode of action. These data reveal the profound effects of prolonged social isolation on brain chemistry and function and suggest potential new therapeutic applications for Nk3R antagonists.

Keywords: BNST; DMH; Nk3R; NkB; Tac2; aggression; amygdala; fear; neuropeptides; social isolation; stress.


Conflict of interest statement

DECLARATION OF INTERESTS

The authors declare no competing interests. B.E.D. and V.G. are listed as inventors on a patent related to AAV-PHP.B (#US9585971B2).

Figures

Figure 1
Figure 1. Prolonged SIS alters behavior
(A–D) Alternative models for peptidergic control of an internal state influencing multiple behaviors controlled by different brain regions (gray circles, beh. A, beh. B, etc.). Control could be achieved by multiple (A) or a single (B–D) neuropeptide (pQ, pX, etc.) acting directly on multiple regions (A–B, D) expressing receptors (RX, RY, etc) for the peptides, or on a single peptide-responsive “hub” region (C). In (B) the same peptide (pX) is expressed in different regions (blue circles) that control different behaviors in different peptide-responsive regions (gray circles). (E–N) Comparison between wild-type (WT) group housed (GH) control mice and isolated (SIS) mice (n=8 mice/condition) in the assays indicated (E, J, L, schematics). (F) Aggression (resident-intruder test). (G, H), freezing responses during (“during”) or immediately after (“post”) presentations of an overhead looming disk (G) or conditioned tone (H). (I), Reactivity to footshock following tone test. (J) Freezing to a 17–20kHz ultrasonic sound stimulus (USS). (M, N) Anxiety assays. (M), open field test (OFT), (N) elevated plus maze (EPM) test. (O) Summary of results. Red up-pointing arrows indicate isolation-induced increases in behavior; orange down-pointing arrows indicate isolation-reduced behavioral responding. “n.c.”, no change. In this and in all subsequent figures, data are represented as mean ± SEM. *p<0.05, **p<0.01, ***p<0.001. Pairwise contrasts were tested and corrections for multiple comparisons were applied for post-hoc comparisons; bars without asterisks did not reach significance (p>0.05). ANOVA’s, F values, t values, as well as additional statistical information for this and subsequent figures can be found in Table S1. See related Figure S1.
Figure 2
Figure 2. SIS causes an increase in Tac2 expression
(A) Illustration summarizing tachykinin ligand-receptor specificities. (B) Tac2 (top panels) and Tac1 (bottom panels) mRNA expression (coronal sections) revealed by in situ hybridization (ISH) (data from Mouse Brain Atlas, Allen Institute of Brain Science; Tac2, Exp. 72339556; Tac1, Exp.1038). Abbreviations: dBNSTa, anterodorsal bed nucleus of the stria terminalis; MH, medial habenula; CeA, central amygdala; DMH, dorsomedial hypothalamus; ARH, arcuate nucleus; LHA, lateral hypothalamus; CP, caudate putamen; MeA, medial amygdala; VMH, ventral medial hypothalamus; ZI, zona incerta. (C–D) Coronal sections of expression of zsGreen in GH vs. 2 week-isolated Tac2-IRES-Cre (C) or Tac1-IRES-Cre (D) mice crossed to Ai6 (zsGreen) Cre reporter mice. (E–F) Quantification of Tac2 or Tac1 mRNAs by qRT-PCR in the indicated regions, hand-dissected from the brains of GH or SIS mice (n=4 mice/condition). (G–K) Tac2 mRNA detected by FISH in GH or SIS mice in the indicated regions (n= 3–4 mice/condition, 1–4 sections/region/mouse); representative sections from each area are shown. Dashed lines indicate regions of interest (ROIs) used for quantification. (L–P) Left, avg. number of Tac2 mRNA+ cells/mm2 in ROIs; Right, avg. fluorescence intensity/mm2 in the regions shown in (I–M), respectively. Fold- increases in Tac2 mRNA fluorescence intensity are greater than increases in cell number, indicating an increase in expression level per cell. See related Figure S2.
Figure 3
Figure 3. Systemic Nk3R antagonism attenuates effects of SIS
(A) Experimental protocol. Following isolation, SIS or GH mice were injected (i.p.) with osanetant or vehicle and tested for the indicated behaviors (n=6 mice/condition). (B–E) Osanetant blocked SIS-induced aggression (B), post-loom freezing (C), post-tone freezing (D), and increased shock reactivity (E). (F) Experiment to test whether osanetant delivered daily during SIS can protect against its behavioral effects. “osan last” indicates an additional control group given just the last dose of osan 24 hours before testing to control for carry-over of the drug (n=6/condition). (G–J) Effect of osanetant administered during SIS on (G) aggression, (H) post-loom freezing, (I) post-tone freezing. (J) Shock reactivity; a trend to protection (SIS-veh vs. osan during) was observed but did not reach our significance threshold (p>.05). (K) Summary of results. “osan pre-test” indicates osanetant was given 20 min prior to each assay (B–E) but not during SIS, “osan during SIS” indicates osanetant was given during SIS only (G–J), and not 20 min before each assay. Faint red arrows indicate original effects produced by SIS. Black X’s indicate SIS-induced effects that were blocked by the manipulation. See related Figure S3.
Figure 4
Figure 4. Targeted NK3R antagonism in dBNSTa, DMH, or CeA attenuates different effects of SIS in a dissociable manner
(A) Experimental protocol. Mice were implanted with bilateral cannulae in dBNSTa, DMH, or CeA, isolated, and given osanetant or vehicle microinfusions (300nl) 20 min before testing (n= 6–7/condition). (B–J) Effect of osanetant infusion into dBNSTa (B–D), DMH (E–G), or CeA (H–J) on indicated assays. Osanetant (green bars) selectively blocked persistent freezing in dBNSTa (“post”; C–D), aggression in DMH (E), and acute freezing in CeA (“during”; I–J). (K) Summary of results. Notations as in Fig. 3K. n/a, not applicable (secondary to lack of freezing during stimulus). Green down-pointing arrows indicate manipulation-induced reduction in a behavior not altered by SIS. See related Figure S4.
Figure 5
Figure 5. Targeted chemogenetic silencing of Tac2+ cells attenuates the effects of SIS
(A) Experimental protocol. Tac2-Cre mice were bilaterally injected in the indicated regions with a Cre-dependent AAV expressing hM4DREADD-mCherry, isolated, and injected (i.p.) with CNO or vehicle prior to testing (n=7–8 mice/condition). (B–J) Effect of vehicle or CNO on mice expressing Tac2-hM4DREADD in dBNSTa (B–D), DMH (E–G), or CeA (H–J) on indicated assays. CNO blocked persistent freezing in dBNSTa (“post”; C–D), aggression in DMH (E), and acute freezing in CeA (“during”; I–J). (K) Summary of results. Notations as in Fig. 4K. CNO had no effect in mCherry-expressing mice (Fig. S5E). See related Figure S5.
Figure 6
Figure 6. Targeted knockdown of Tac2 attenuates the effects of SIS
(A) Experimental protocol. 3 weeks prior to testing, wildtype (WT) mice were injected with an AAV expressing shRNA-zsGreen for specific knockdown of Tac2 (shRNA-1 or shRNA-2), or with an shRNA virus targeting the luciferase gene (control) (n=6–7/mice condition), and maintained in isolation until testing. (B–J) Effect of shRNA’s in dBNSTa (B–D); DMH (E–G), or CeA (H–J) on indicated assays. shRNA-1 (red bars) blocked persistent freezing in dBNSTa (“post”; C–D); aggression in DMH (E) and freezing in CeA (I–J). shRNA-2 (orange bars) yielded similar effects but additionally reduced acute freezing in dBNSTa (“during”; C, D). (K) Summary of results. The effects of shRNA-1 (left column) and shRNA-2 (right column) are presented for each region. See related Figure S6.
Figure 7
Figure 7. Activation of Tac2+ neurons plus Tac2 overexpression mimics the effects of SIS in GH Mice
(A) Experimental protocol. GH Tac2-IRES-Cre mice were intravenously injected with Cre-dependent, human Synapsin I promoter- driven, AAV-PHP.B serotyped viruses expressing the chemogenetic activator hM3DREADD, a Tac2 cDNA, both, or just mCherry (controls). Mice remained group housed (5 weeks) with CNO-spiked drinking water provided during the final 2 weeks (for hM3DREADD activation). Mice received an injection of CNO (i.p.) 20 min prior to each assay (n=6 mice/condition). (B–E) Effect of each manipulation on the indicated assays. All animals were treated with CNO and received the same total amount of virus. Only mice receiving both the hM3DREADD and Tac2 cDNA viruses showed an “SIS-like” phenotype (dark blue bars), including increased aggression (B), post loom freezing (C), and post-tone freezing (D). (E) Reactivity to the footshock. (F) Summary of results. Blue arrows indicate effects of perturbations to generate SIS-like effects. (G) Schematic illustrating how Tac2 and its receptor (Nk3R) may control SIS-induced behavior. (H) (Upper) Illustration summarizing LOF and GOF effects on behavior. (Lower) Model graphs showing how different thresholds for acute vs. persistent freezing, and different dose-dependencies of freezing on Tac2 levels in dBNSTa vs. CeA (bottom graph), could explain the differential effects of shRNA -1 (weaker) and -2 (stronger; upper graphs) in the two regions (see Fig. 6). The model also illustrates how an increase in Tac2 levels caused by SIS (red line) could convert acute (CeA-dependent) to persistent (dBNSTa-dependent) freezing. Gray dot, baseline levels of Tac2 in GH mice are higher in CeA than in dBNSTa, based on FISH data (Fig. 2L, N). See related Figure S7.

Comment in

References

    1. An D, Chen W, Yu DQ, Wang SW, Yu WZ, Xu H, Wang DM, Zhao D, Sun YP, Wu JC, Tang YY, Yin SM. Effects of social isolation, resocialization and age on cognitive and aggressive behaviors of Kunming mice and BALB/c mice. Animal science journal = Nihon chikusan Gakkaiho. 2017;88:798–806. - PubMed
    1. Andero R, Daniel S, Guo JD, Bruner RC, Seth S, Marvar PJ, Rainnie D, Ressler KJ. Amygdala-Dependent Molecular Mechanisms of the Tac2 Pathway in Fear Learning. Neuropsychopharmacology : official publication of the American College of Neuropsychopharmacology. 2016;41:2714–2722. - PMC - PubMed
    1. Andero R, Dias BG, Ressler KJ. A role for Tac2, NkB, and Nk3 receptor in normal and dysregulated fear memory consolidation. Neuron. 2014;83:444–454. - PMC - PubMed
    1. Anderson DJ. Circuit modules linking internal states and social behaviour in flies and mice. Nature reviews Neuroscience. 2016;17:692–704. - PubMed
    1. Anderson DJ, Adolphs R. A Framework for Studying Emotions across Species. Cell. 2014;157:187–200. - PMC - PubMed

Publication types

MeSH terms