. 2018 Sep;84(9):2059-2074.
doi: 10.1111/bcp.13641. Epub 2018 Jun 25.

Pharmacokinetics and C-reactive protein modelling of anti-interleukin-6 antibody (PF-04236921) in healthy volunteers and patients with autoimmune disease

Affiliations

Pharmacokinetics and C-reactive protein modelling of anti-interleukin-6 antibody (PF-04236921) in healthy volunteers and patients with autoimmune disease

Cheryl Li et al. Br J Clin Pharmacol. 2018 Sep.

Abstract

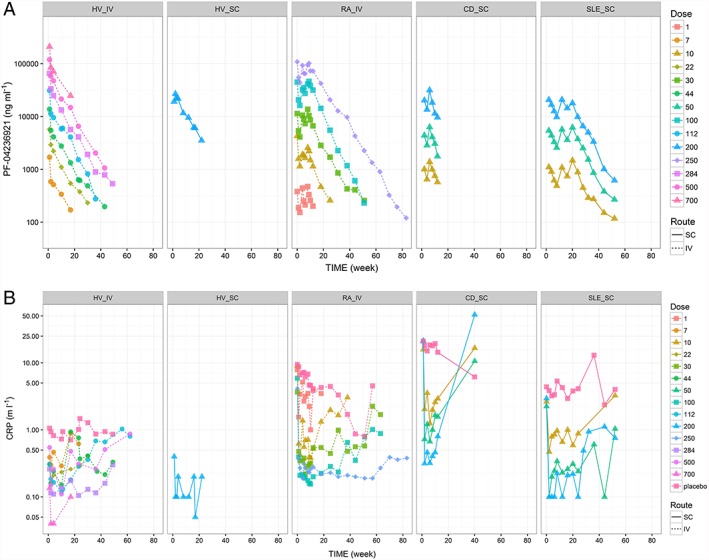
Aims: The purpose of this study was to characterize pharmacokinetics (PK) of PF-04236921, a novel anti-interleukin-6 monoclonal antibody, and its pharmacokinetic/pharmacodynamic (PK/PD) relationship on serum C-reactive protein (CRP) in healthy volunteers and patients with rheumatoid arthritis (RA), systemic lupus erythematosus (SLE) and Crohn's disease (CD).

Methods: Population modelling analyses were conducted using nonlinear mixed effects modelling. Data from two phase 1 healthy volunteer studies, a phase 1 RA study, a Phase 2 CD study and a Phase 2 SLE study were included.

Results: A two-compartment model with first order absorption and linear elimination and a mechanism-based indirect response model adequately described the PK and PK/PD relationships, respectively. Central compartment volume of distribution (Vc) positively correlated with body weight. Clearance (CL) negatively correlated with baseline albumin concentration and positively correlated with baseline CRP and creatinine clearance, and was slightly lower in females. After correcting for covariates, CL in CD subjects was approximately 60% higher than other populations. Maximum inhibition of PF-04236921 on CRP production (Imax ) negatively correlated with baseline albumin. Imax positively correlated with baseline CRP and the relationship was captured as a covariance structure in the PK/PD model.

Conclusion: Integrated population PK and PK/PD models of PF-04236921 have been developed using pooled data from healthy subjects and autoimmune patients. The current model enables simulation of PF-04236921 PK and PD profiles under various dosing regimens and patient populations and should facilitate future clinical study of PF-04236921 and other anti-interleukin-6 monoclonal antibodies.

Trial registration: ClinicalTrials.gov NCT00838565 NCT01287897 NCT01166555 NCT01405196.

Keywords: modelling and simulation; monoclonal antibodies; pharmacokinetic-pharmacodynamic; pharmacokinetics.


Figures

Figure 1
Figure 1
Observed median serum PF‐04236921 concentrations vs. time stratifying by protocol and dose (a) and observed median serum CRP concentrations vs. time by protocol and dose (b). HV_IV = B0151001, HV_SC = B0151004, RA_IV = B0151002, CD_SC = B0151003, SLE_SC = B0151006. Median PF‐04236921 and CRP concentrations at individual visits derived based on fewer than three observations were excluded from the plots. HV = healthy volunteers; RA = rheumatoid arthritis; CD = Crohn's disease; SLE = systemic lupus erythematosus; IV = intravenous administration; SC = subcutaneous administration
Figure 2
Figure 2
Relationships between baseline covariates of interest and post‐hoc η (s) based on (a) pharmacokinetic (PK) base model; (b) PK final model; (c) PK/pharmacodynamic base model; and (d) PK/pharmacodynamic final model. Note: Each red line represents a smoother (loess) line. BWT = body weight; BMI = body mass index; CLcr = creatinine clearance; ALB = albumin; CRP_log = log‐transformed C‐reactive protein; RACE {W = White; B = Black; A = Asian; O = others}; Study {HV1 = B0151001; HV2 = B0151004; RA = B0151002; CD = B0151003; SLE = B0151006}. ETA CL, ETA Vc, ETA Vp, ETA Ka and ETA Eps represent individual empirical Bayes estimates for CL, Vc, Vp, ka and η for residual error in PK (ε), respectively. ETA BL, ETA Imax, ETA IC50 and ETA Eps represent individual empirical Bayes estimates for BLCRP, I max, IC 50 and η for residual error in PD (ε), respectively
Figure 3
Figure 3
Goodness‐of‐fit plots for the final pharmacokinetic (a) and for pharmacodynamic model of C‐reactive protein response (b). Left panels: Scatter plots of observed concentrations (DV) vs. population predicted concentrations (PRED) and DV vs. individual predicted concentrations (IPRED). Right panels: Scatter plots of residuals normalized by the standard deviation of the data (conditional weighted residuals, CWRES) vs. PRED and CWRES vs. time after the first dose. Note: Each red line represents a smoother (loess) line. For CWRES vs. time plot, time value zero was replaced with 0.1 to show the point at time = 0 in the log scale
Figure 4
Figure 4
Upper panels (a) show prediction‐corrected visual predictive check plot for PF‐04236921 concentrations stratifying by protocol. Lower panels (b) show prediction‐corrected visual predictive check plot for C‐reactive protein (CRP) concentrations stratifying by protocol. Note: For each panel, the black line (black dashed lines) represents observed median (10, 90 percentiles) PF‐04236921 and CRP prediction‐corrected concentrations time course. The red line (red dashed lines) represents predicted median (10, 90 percentiles) PF‐04236921 and CRP prediction‐corrected concentrations time course. The blue areas represent model‐predicted 95% intervals of 10, 50 and 90 percentiles of the time course. The closed circles indicate observed individual PF‐04236921 and CRP prediction‐corrected concentration time data. HV IV = healthy volunteers IV; HV SC = healthy volunteers SC; RA IV = RA patients IV; CD SC = CD patients SC; and SLE SC = SLE patients SC. RA = rheumatoid arthritis; CD = Crohn's disease; SLE = systemic lupus erythematosus; IV = intravenous administration; SC = subcutaneous administration

References

    1. Catarzi S, Favilli F, Romagnoli C, Marcucci T, Picariello L, Tonelli F, et al Oxidative state and IL‐6 production in intestinal myofibroblasts of Crohn's disease patients. Inflamm Bowel Dis 2011; 17: 1674–1684. - PubMed
    1. Danese S, Vermeire S, Hellstern P, Panaccione R, Rogler G, Fraser G, et al Randomised trial and open‐label extension study of an anti‐interleukin‐6 antibody in Crohn's disease (ANDANTE I and II). Gut 2017; gutjnl‐2017‐314562. - PMC - PubMed
    1. Ito H. IL‐6 and Crohn's disease. Curr Drug Targets Inflamm Allergy 2003; 2: 125–130. - PubMed
    1. Tanaka T, Narazaki M, Kishimoto T. Anti‐interleukin‐6 receptor antibody, tocilizumab, for the treatment of autoimmune diseases. FEBS Lett 2011; 585: 3699–3709. - PubMed
    1. Fogel R, Sridharan S, Li C, Bradley J, Riese R, Labadie R, et al Safety, pharmacokinetics, and pharmacodynamics of a human anti‐IL6 monoclonal antibody PF‐04236921 in healthy subjects. Ann Rheum Dis 2013; 71 (Suppl 3): 680.

Publication types

MeSH terms

Associated data

LinkOut - more resources